MTF Pivots Zones [tanayroy]Dear Fellow Traders,
I only publish scripts that I use and found good for my trading. Pivots are my favorite indicator. I use daily, weekly, monthly, quarterly, and yearly pivots levels. multiple pivot zones are very strong levels and I like to watch these levels for possible price action.
But when I include all pivots levels at a time, my charts get too clumsy. To see price action properly, you need a clean chart. And when we trade we want to see only important levels within the price horizon.
To resolve this, I created this script, which shows important levels within my display option. I control the display option with 14 periods ATR and a multiplier to adjust the display levels.
The following chart displays levels within 14 ATR * 0.5 multipliers. As the price progress, it will automatically add levels and delete levels that do not come within this option.
What levels are included?
I have used traditional pivot calculation and included Daily, Weekly, Monthly, Quarterly, and Yearly pivots with high and low.
What options are available?
You can replace the yearly timeframe with your desired time frame and can adjust the ATR multiplier to increase or decrease display levels.
Use this in 5m, 15m, or 1H chart or any timeframe below Daily.
Please like, share, and comment.
Pivot

OscillatorPivotsLibrary "OscillatorPivots"
Measures pivots in an oscillator and flags if they are above a configurable size. Uses absolute size rather than just highest/lowest in a candle range.
f_osc_Pivots()
Uses the total change in the Y axis, instead of a simple Williams pivot over a defined number of bars. In other words, it measures the size of the actual pivot, not just whether it happens to be the highest/lowest value in a range.
Measures the absolute, cumulative change both before and after the pivot, to avoid flagging mere kinks in trends.
The advantage is that absolute pivot size is, in some cases, precisely what we care about. A disadvantage is that it can take an arbitrary, perhaps long, time to confirm.
You can configure the threshold size of the pivot so that it finds large or small pivots.
Always returns a pivot high after a pivot low, then another pivot high and so on, in order. It never returns a high followed by a high, which simple indicators based on the ta.pivot() function can do.
@param chart_H_1 This must always be set to 1, unless you are using my HighTimeframeTiming library, in which case set it to the output of the function for a _HTF_H of 1.
@param chart_H_2 This must always be set to 2, unless you are using my HighTimeframeTiming library, in which case set it to the output of the function for a _HTF_H of 2.
@param _osc This is the oscillator float value.
@param _oscPivotSize This is the user setting for what counts as a big enough change to be a pivot.
@returns Information about the pivot that is likely to be useful in further calculations:
confirmPeak, confirmDip - whether the pivot was confirmed this bar
peakBarsBack, dipBarsBack - how many bars ago the actual peak or dip was
peakPrice, dipPrice - the value of the oscillator at the peak/dip
It also returns some internal variables, which are plotted in this library only for an understanding of how the function works.
debug_peakStartLevel, debug_dipStartLevel - The level of the currently active peak/dip

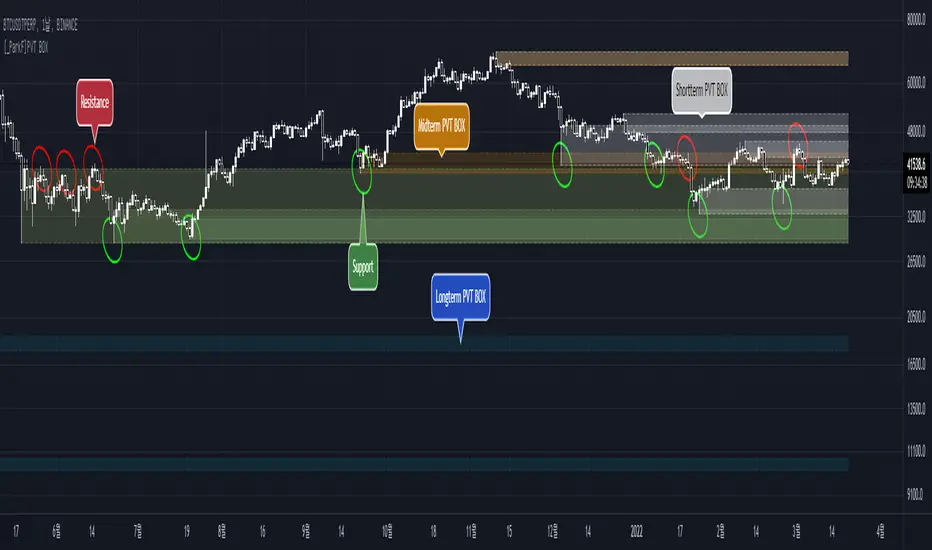
[_ParkF]PVT BOXIt creates a box based on price and pivot .
PVT BOX represents short, medium, and long term boxes in their respective colors,
which can confirm support and resistance .
This indicator has the number of displays per box, period, color, and on/off switch options.
I hope it will help you with your trading.
hope you become rich!
---------------------------------------------------------------------------------------------
가격과 피봇을 기반으로 하는 박스를 생성하여 줍니다.
PVT BOX는 단기, 중기, 장기의 박스를 각각의 색으로 표현되며,
이 박스들로 인해 지지와 저항을 확인할 수 있습니다.
이 지표에는 각 박스별 표시갯수, 기간값, 색상, on / off 스위치의 옵션을 가지고 있습니다.
거래에 도움이 되셨으면 합니다.
부자되세요!
Pivot Based Trailing Maxima & Minima [LuxAlgo]This indicator returns trailing maximums/minimums and the resulting average, each resetting on the occurrence of a pivot point high/low, thus allowing to highlight past and current support and resistance levels.
Note that the user has the option to make the indicator subject to backpainting or not. Backpainting would offset the indicator output to the past and as such would be less suited for real-time applications.
🔶 USAGE
🔹 Non Backpainting
The indicator can highlight points of support and resistance given by the trailing maximum/minimum average.
An uptrend is indicated when the trailing maximum is making a new higher high, while a downtrend is indicated when the trailing minimum makes a new lower low.
🔹 Backpainting
When backpainting is enabled the historical trailing maximum/minimum and their resulting average are offset to the past. However, we extend these to the most recent bar, allowing for real-time applications of the indicator.
Users can easily analyze past trends and determine their type by observing the trailing maximum/minimum behavior. For example, trailing maximums/minimums not making new higher high/lower low would indicate a ranging market.
The frequency of new higher high/lower low can also help determine how bullish/bearish a trend was.
🔶 SETTINGS
Length: Determines the pivot high/low lookback, with higher values allowing to detect longer-term tops and bottoms.
Backpaint: Determine if the indicator is subject to backpainting. Enabling this setting would offset the returned results in the past.

Mean Shift Pivot ClusteringCore Concepts
According to Jeff Greenblatt in his book "Breakthrough Strategies for Predicting Any Market", Fibonacci and Lucas sequences are observed repeated in the bar counts from local pivot highs/lows. They occur from high to high, low to high, high to low, or low to high. Essentially, this phenomenon is observed repeatedly from any pivot points on any time frame. Greenblatt combines this observation with Elliott Waves to predict the price and time reversals. However, I am no Elliottician so it was not easy for me to use this in a practical manner. I decided to only use the bar count projections and ignore the price. I projected a subset of Fibonacci and Lucas sequences along with the Fibonacci ratios from each pivot point. As expected, a projection from each pivot point resulted in a large set of plotted data and looks like a huge gong show of lines. Surprisingly, I did notice clusters and have observed those clusters to be fairly accurate.
Fibonacci Sequence: 1, 2, 3, 5, 8, 13, 21, 34...
Lucas Sequence: 2, 1, 3, 4, 7, 11, 18, 29, 47...
Fibonacci Ratios (converted to whole numbers): 23, 38, 50, 61, 78, 127, 161...
Light Bulb Moment
My eyes may suck at grouping the lines together but what about clustering algorithms? I chose to use a gimped version of Mean Shift because it doesn't require me to know in advance how many lines to expect like K-Means. Mean shift is computationally expensive and with Pinescript's 500ms timeout, I had to make due without the KDE. In other words, I skipped the weighting part but I may try to incorporate it in the future. The code is from Harrison Kinsley . He's a fantastic teacher!
Usage
Search Radius: how far apart should the bars be before they are excluded from the cluster? Try to stick with a figure between 1-5. Too large a figure will give meaningless results.
Pivot Offset: looks left and right X number of bars for a pivot. Same setting as the default TradingView pivot high/low script.
Show Lines Back: show historical predicted lines. (These can change)
Use this script in conjunction with Fibonacci price retracement/extension levels and/or other support/resistance levels. If it's no where near a support/resistance and there's a projected time pivot coming up, it's probably a fake out.
Notes
Re-painting is intended. When a new pivot is found, it will project out the Fib/Lucas sequences so the algorithm will run again with additional information.
The script is for informational and educational purposes only.
Do not use this indicator by itself to trade!

TWS Pivot PointsStandard Pivot Points
This Script includes the Mid Pivot Points
R1-R5,
S1 - S5
What is a Pivot Point?
A pivot point is a technical analysis indicator, or calculations, used to determine the overall trend of the market over different time frames. The pivot point itself is simply the average of the high, low and closing prices from the previous trading day. On the subsequent day, trading above the pivot point is thought to indicate ongoing bullish sentiment, while trading below the pivot point indicates bearish sentiment.
The pivot point is the basis for the indicator, but it also includes other support and resistance levels that are projected based on the pivot point calculation. All these levels help traders see where the price could experience support or resistance. Similarly, if the price moves through these levels it lets the trader know the price is trending in that direction.
When the price of an asset is trading above the pivot point , it indicates the day is bullish or positive.
When the price of an asset is trading below the pivot point , it indicates the day is bearish or negative.
The indicator typically includes four additional levels: S1, S2, R1, and R2. These stand for support one and two, and resistance one and two.
Support and resistance one and two may cause reversals, but they may also be used to confirm the trend. For example, if the price is falling and moves below S1, it helps confirm the downtrend and indicate a possible continuation to S2.

TWS Pivot Points FibsPivot Points with Fibonacci
Day, Week, Month. Year Time Frames
0% to 200%
What is a Pivot Point?
A pivot point is a technical analysis indicator, or calculations, used to determine the overall trend of the market over different time frames. The pivot point itself is simply the average of the high, low and closing prices from the previous trading day. On the subsequent day, trading above the pivot point is thought to indicate ongoing bullish sentiment, while trading below the pivot point indicates bearish sentiment.
The pivot point is the basis for the indicator, but it also includes other support and resistance levels that are projected based on the pivot point calculation. All these levels help traders see where the price could experience support or resistance. Similarly, if the price moves through these levels it lets the trader know the price is trending in that direction.
When the price of an asset is trading above the pivot point , it indicates the day is bullish or positive.
When the price of an asset is trading below the pivot point , it indicates the day is bearish or negative.
The indicator typically includes four additional levels: S1, S2, R1, and R2. These stand for support one and two, and resistance one and two.
Support and resistance one and two may cause reversals, but they may also be used to confirm the trend. For example, if the price is falling and moves below S1, it helps confirm the downtrend and indicate a possible continuation to S2.
All levels are based on Fibonacci
Makuchaku's Trade Tools - Pivots/Fractals & CrossoversPivots/Fractals are at minimum a 3 candlestick pattern.
Bearish pivot/fractal is formed when a candle is flanked by 2 lower candles on either side
Bullish pivot/fractal is formed when a candle is flanked by 2 higher candles on either side
They are great to determine market structure.
This indicator also prints boxes when those pivots/fractals are crossed over, printing bearish & bullish boxes.

[Excalibur] Pivoted Automatic Breakout Trend LinesPREAMBLE:
As I will elaborate further, lines and linearity are everywhere in the our thoughts, words, objects, and nature. For example, in our youth, drawing lines on paper, ascribing them in the dirt, and using them to perfect hand writing is common occurrences in life everyone has experienced. Our minds are uniquely adaptable to envision linearities in many natural or abstract objects, including facial geometry. That's how we easily recognize each other in person. For decades, along our path on roadways to and from our destinations, road lines have long safely guided us. Common phrases are "get in line", "walk the line", "line of duty", and "finish line" in English. Gazing upon the earth's line of horizon on calm wide open ocean standing upon the shoreline, it is easily visible and it has curvature. Sorry to break it to you flat earthers.
Multitudes of agreed upon lines define nationally recognized boundaries on maps for very specific reasons. Some lines are just simply not meant to be crossed and are purposefully intended to be respected. Even at the time of this original release, lines are being "crossed" on unimaginable and tragic scales, forming a trend of devastation of lives and livelihoods. On occasion in human history, border lines have to be redefined, especially when a godvernment no longer represents the WILL of a vast geographic majority of it's citizens. When puppet representatives and misleaders only have a self serving interest to put their citizens most treasured values, grievances, and souls in the grave, succession is a matter of last resort and it's often statistically speaking 101% necessary.
As an American, from my opinionated perspective assessing the situation, I welcome the ancestral people of Donetsk and Luhansk to the world stage, being independent to choose their own destinies and fates, because all that Ukraine wishes to do with them year, after year, after year is render them as subjugates or use them for target practice. And that isn't right! The way 2021+ is heading, by the year 2100 I suspect every continental map is going to have new lines on them.
LINES OF ANTIQUITY:
Many recorded instances throughout history detailing the use of lines, has endured centuries of time. The ancient origins and study of "Euclidean geometry" would have been performed scribbling in the ground, preferably in sand. The Greek mathematician Euclid of Alexandria, the founder of geometry, most probably spent a great deal of his life doing this in order to pass his bold ideas onto future generations.
Before Euclid's time, Spartans in the battle of Thermopylae drew their lines in the sand with their swords adhering to the infamous words "Molon Labe" (come and take ). These disciples of agoge, born and destined for rigorous entrainment were bound by duty, no retreat, no surrender. Hundreds of Spartan sigma males held the line for as long as they could for the security of their free peoples. In almost every case of Spartan history the imperative notion of holding the battle lines was absolutely necessary at all costs, regardless of the carnage delivered from their enemy adversaries, including the unrelenting hordes of invasion commanded by the tyrant Xerxes. ALL gave some on those days.
Over two millennia later, Colonel William Travis at the Alamo carved a line in the ground for able men to decide which side of history they would reside on. History has an awfully bad habit of repeating itself, as it is always told in forewarnment. Lines have always been pertinent, decisive, and always shall be. A world without lines, would make our grasp of understanding and existence nearly impossible to carry on civilization.
LINES IN MODERN TIMES:
The versatility of lines are every where imaginable in this 21st century. A short list of their applications are in art, design, engineering, architecture, demarcation, and they are always, always ever pervasive in computer graphics. Without a doubt, lines are now pinnacle to having the ability to make our charting possible in order to recognize trends. Here in this script's application I intended them to automatically reveal geometry, trends, and breakout zones.
When I originally encountered my discovery of TradingView's existence, the very first thing I was doing, was to naturally draw lines across the price action pivot points in search of identifiable opportunities. Three years later, I have now finalized my vision of automatically drawing an ample amount of them by harnessing the "Power of Pine" in version 5. As you will soon see, utilization of this script will reveal hidden geometry that is otherwise typically unforeseen.
SCRIPT FUNCTIONALITY:
Programmatically drawing lines on top of numeric chaos has been an arduous task, taking me over a year to stabilize this code to my liking. The possibilities of automatically drawing lines on market price action could in theory actually result into hundreds per chart pane. This script does have a limitation of 60 line segments/rays maximum. I have gone to great lengths to accomplish this feat, just to arrive at 60 per overlay indicator. Beyond that, I am experiencing limitations of Pine. Because of the amount of work required to finalize this indicator, this is one of my "Excalibur" indicators. I literally had to pull this code from the deepest recesses of my mind. I would classify this kind of indicator as a weapon of mass financial creation, so I'm offering it's availability to all members.
Segments/rays may be computationally drawn as far back as 5000 bars into the chart's history, but no more than that are to be expected. Only one line will occur from pivot point to pivot point. All duplicate line occurrences computed are not redrawn over another, as I ensured by filtration this would not happen. Numerous adjustments are present to handle a majority of expectations and the numerous visual acuities of members. I envision many thousands of members utilizing this script's versatility as a visual aid to help guide them along their path of trading assessments and decisiveness.
SCRIPT UTILITY:
Having the ability to recognize geometry in price movements is ultra handy in relation to directional trending and channeling arrangements especially. Trends are guaranteed at some unknown point in time to breakout, and form new trends or cycles. I employed a fire and ice color duo to differentiate between the upper trend lines from the lower trend lines. It seemed to be most visible without interfering too often with other indicators. These can be changed to any color combo you desire in Settings. Additional line preferences are provided to support your tailored experience while having other indicators present in the overlay pane. It may even be configured to only display two lines at a minimum. By doing so, you can really focus and fine tune Settings for just these two segments/rays with very specific refined tweaks.
One caveat of detecting pivots, is that they aren't recognized until after they have formed. Always remember that pivot points aren't instantaneously discoverable until their full form is computationally apparent in the form of a chevron. Technically describing the pivot detection is beyond normal comprehension and to difficult to explain in this description. I will also say, viewing this on a 4K display resolution reveals the best view. If you wish to use more than one instance of this indicator in the overlay for more than 60 lines at a time, go right ahead. However it may become messy.
P.S. This script and it's description was partially inspired by Twisted Sister's song "We're Not Gonna Take It"
RISK DISCLAIMER:
My scripts and indicators are specifically intended for informational and educational use only. This script uses historical data points to perform calculations to derive real-time calculations. They do not infer, indicate, or guarantee future results or performance.
By utilizing this script/indicator or any portion of it, you agree to accept 100% responsibly and liability for your investment or financial decisions, and I will not be held liable for your subjective analytic interpretations incurring sustained monetary losses. The opinions and information visual or otherwise provided by this script/indicator is not investment advice, nor does it constitute recommendation.

Bias Pivot PointA simple indicator that uses Pivot Points as a filter and to generate a Directional Bias .
How to use this indicator?
1. Directional Bias
Bullish => Closing Price > Pivot Point
Bearish => Closing Price < Pivot Point
2. Support / Resistance
Each Pivot Points can be used as Support or Resistance
3. Take Profit Targets
Each Pivot Points can be used as targets for taking profit

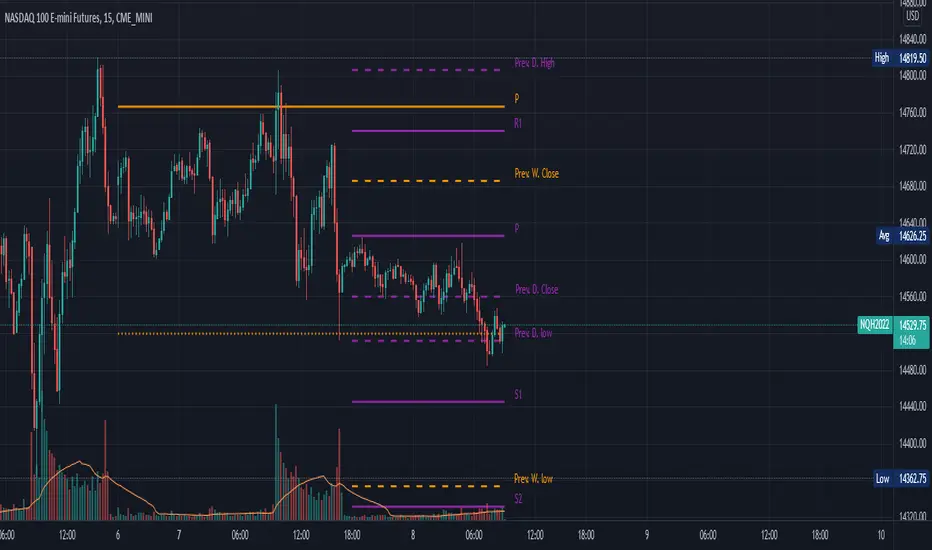
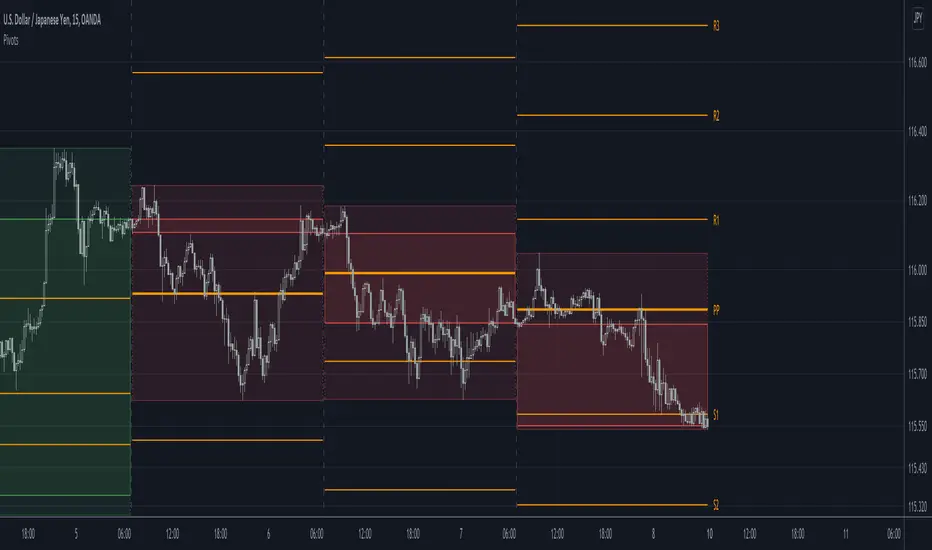
Daily, Weekly, Monthly Pivot Points StandardShow Higher timeframe Pivot Point along with 3 support/Resistance and mid line between them
Option to show the Monthly lines, with or without mid line, and can select the color
Option to show the Weekly lines, with or without mid line, and can select the color
Option to show the Daily lines, with or without mid line, and can select the color
Option to show a tables with the previous Open, High, Low, Close for these higher timeframe
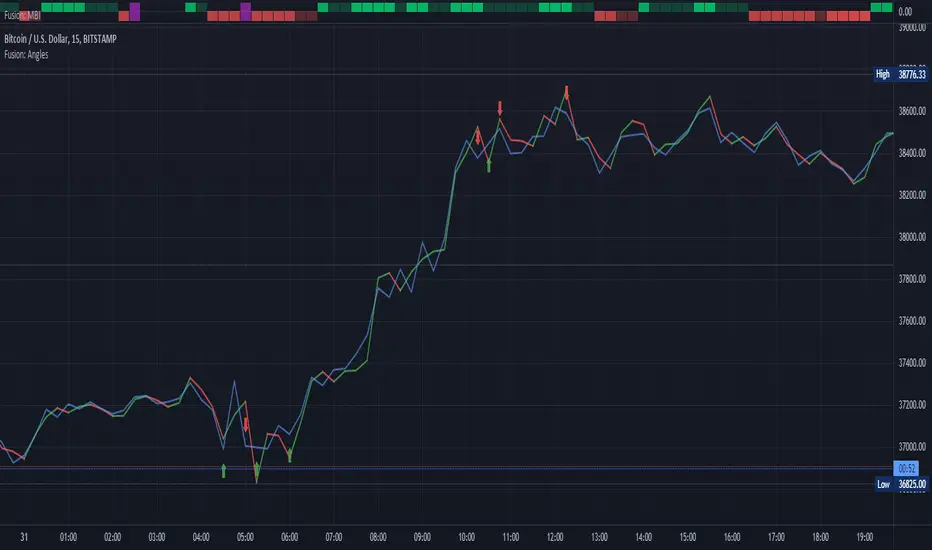
Fusion: Pivot Angles and ThresholdsThis is a somewhat unusual indicator working purely on geometry.
You set a threshold for an angle of a pivot and if the angle is LESS THAN (because the sharper the pivot the smaller the angle) your threshold then a signal is given.
I use this as an exit indicator and it works well for me when other methods don't give a clear signal. Seeing where it shows up it might also make a good entry indicator but I'll leave it up to others to play with that and see if it's a good entry indicator for them. If you find it is good for entries or other things please drop me a note or make a comment, I would appreciate knowing.
If you set the length to 1 for the moving average then it will just use the source and not perform a moving average operation.
There's half a dozen or so moving average types to select from so you will probably find one that suits you pretty well.
The settings are certainly not optimized so set to whatever suits your needs as my defaults will probably be wrong for you.
The code is structured to easily drop into a bigger system so use it as a lone indicator or add the code to some bigger project you are creating. If you do integrate it into something else then send me a note as it would be nice to know it's being well used.
Finally, if you find value please do make a comment, give a thumbs up etc.
Enjoy and good luck!
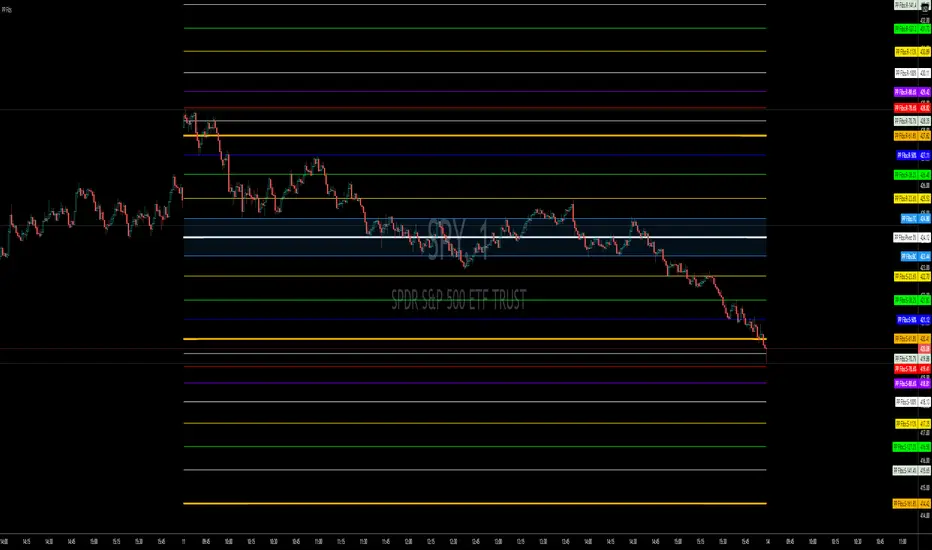
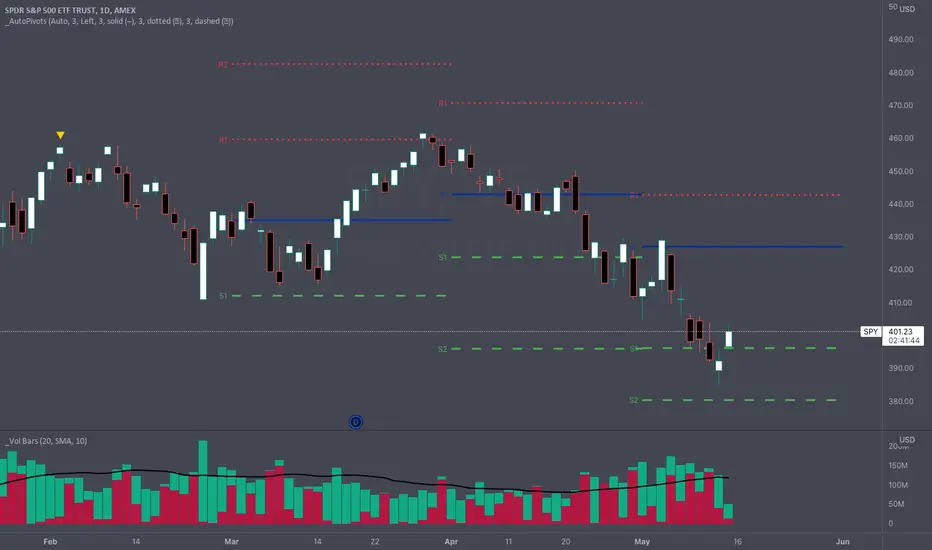
_Auto Pivot PointsOne of the main drawbacks to displaying Pivot Points on a chart is that many times the more extreme pivots (R/S3, R/S4, R/S5) aren't anywhere close to the price action during a timeframe. These extreme pivot points clutter up your chart and make it hard to use the "auto" zoom feature of TradingView.
The " _Auto Pivot Points " indicator solves these problems by automatically only displaying the pivot points if the price has crossed the pivot during the timeframe or it is the next closest pivot . For example, on monthly pivots if the price has only crossed the R1 Pivot then this indicator will display the R2 Pivot and any pivots below but it won't display the R3, R4, R5 pivots . The R3, R4, & R5 pivots are not very useful to the trader because the price hasn't even crossed the R2 Pivot . But as soon as the price crosses the R2 Pivot then this indicator will display the R3 Pivot because it is the next closest. And the same logic applies to the S Pivots .
If you need to see all the Pivots then there is a convenient toggle to display all the pivots by turning off the intelligent auto pivots . But as soon as you don't need to display all the pivots the toggle will turn on the automatic pivots .
This indicator has many style and logic options. This script allows you to control:
Number of past timeframes to display
Displaying Pivot labels
Label position (left/right)
Line color
Line width
Note: TradingView has a limit of 40 security calls per script. Due to this limitation this indicator can only display pivots a max of 7 time periods back.
Note 2: This indicator uses the Traditional pivot calculations.
Swing Pivots High LowBINANCE:BTCUSDT
This indicator is an opensource merge of the built in 'Pivot Points High Low' and the most popular 'Swing-high-low-support-resistance' indicators. The original 'Pivot Points High Low' does not have extensions with better visibility, while the most popular 'Swing-high-low-support-resistance' has no source available. I've also added additional configurable alert conditions for Pivot High and Low Crossover/Crossunder.
Please read the official documentation for further information about the indicator.

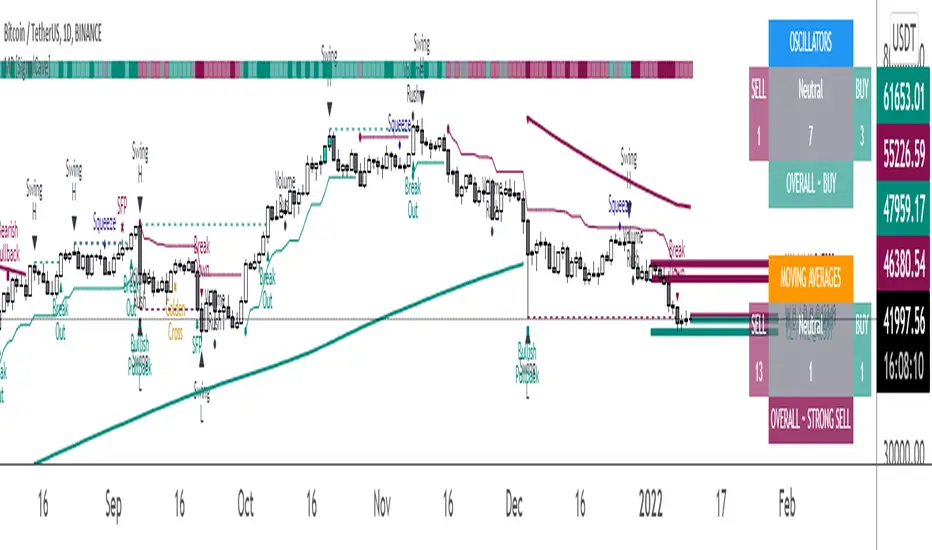
Multi-Purpose All in One [SignalCave]Multi-Purpose All in One Indicator Functions
1) Technical Analysis, Technical Ratings
2) Pivots, Primary & Secondary Trends
3) Swings, Engulfs, Golden & Death Crosses, Price Squeezes, Pullbacks, Breakout & Breakdowns, Volume Rushes
4) Momentum Strength
1) Technical Analysis, Technical Ratings
Technical analysis display real-time ratings. It based on the most popular technical indicators such as RSI, Stochastic, CCI, ADX, AO, Momentum, MACD, Stochastic RSI, Williams %, Ichimoku Cloud, SMA, EMA, VWMA and HMA.
Technical analysis is a built-in function on TradingView. You can access any asset’s technical analysis page and see it’s performance in real time.
"Multi-Purpose All in One" indicator brings this function into your TradingView charting screen. Indicator allows you to see the same output without visiting any external web page in TradingView. Indicator also works on every timeframe and asset class.
Technical Ratings is a technical analysis tool that combines the ratings of several technical indicators to make it easier for traders and investors to find profitable trades.
Technical Ratings can be a valuable technical analysis tool for many analysts or traders. Many traders use a selection of complementary indicators to make better decisions. Technical Ratings simplifies this task by combining the most popular indicators and their signals.
2) Pivots, Primary & Secondary Trends
Helps you to identify primary and secondary trends and potential support/resistance zones.
Trend detection have three modes which are “Aggressive, Moderate and Conservative” . You can customize the mode on settings screen.
3) Swings, Engulfs, Golden & Death Crosses, Price Squeezes, Pullbacks, Breakout & Breakdowns, Volume Rushes
A swing low is when price makes a low and is immediately followed by consecutive higher lows. Likewise, a swing high is when price makes a high and is followed by consecutive lower highs.
Swing Failure Pattern (SFP) is a type of reversal pattern that can be used as buy or sell signals.
Engulfing candles tend to signal a reversal of the current trend in the market. This specific pattern involves two candles with the latter candle 'engulfing' the entire body of the candle before it.
On this indicator, bullish engulfs visible only on downtrend and oversold conditions. Bearish engulfs visible only on uptrend and overbought conditions.
The death cross and golden cross are technical analysis terms for when a moving average (MA) intersects with another from either above or below.
The cross, depending on which it is, can signal the start of a new trend or the end of one.
Squeeze signs signifies low volatility, market preparing itself for an explosive move up or down direction.
Bullish Pullbacks are widely seen as buying opportunities after an asset has experienced a large upward price movement. Most pullbacks involve an asset's price moving to an area of technical support , such as a moving average, before resuming their uptrend.
Bearish Pullbacks are widely seen as selling opportunities after an asset has experienced a large downward price movement. Most pullbacks involve an asset's price moving to an area of technical resistance , such as a moving average, before resuming their downtrend.
A breakout refers to when the price of an asset moves above a resistance area, breakdown refers to when the price of an asset moves below a support area.
Breakouts/breakdowns indicate the potential for the price to start trending in the breakout direction.
For example, a breakout to the upside from a chart pattern could indicate the price will start trending higher.
Volume rush signs appears when the trading volume increases more then a usual period. It can be useful with combining breakout signals as a confirmation.
4) Momentum Strength
Momentum Indicator helps you to identify potential reversal areas .
Calculation done with using Relative Strength Index (RSI), Money Flow Index (MFI) and Average Directional Movement Index (ADX) indicators.
On full strength bearish movement bars paints as light red , full strength bullish movement bars paints as light green color.
They indicates that trend can be change to opposite direction in a short period of time.
Momentum Strength have three modes which are "Aggressive, Moderate and Conservative" . You can customize the mode on settings screen.
Pivots libraryLibrary "Pivots"
TODO: add library description here
pivots(_type, _open, _high, _low, _clsoe) Calculates the pivot point and returns its value.
Parameters:
_type : Specifies the type of pivot point.
_open : The open price
_high : The high price
_low : The low price
_clsoe : The close price
Returns: Returns the value of the calculated pivot point as a tuple.
cpr(_high, _low, _clsoe) Calculate the Central Pivot Range
Parameters:
_high : The high price
_low : The low price
_clsoe : The close price
Returns: Returns the values as a tuple.
htf_ohlc(_htf) Calculate the HTF values
Parameters:
_htf : Resolution
Returns: Returns the values as a tuple.
T3 + BB
TRES EMAS + BANDAS DE BOLLINGER
INDICADOR 1: TRES EMAS (MEDIA MOVIL EXPONENCIAL)
Con este indicador puede visualizar el promedio de precios con mayor peso a los datos mas recientes.
Se calculan y dibujan tres medias móviles exponenciales: 4, 20 y 200 últimas velas.
-Rápida EMA1 = 4, paso = 1
-Media EMA2 = 20, paso = 2
-Lenta EMA 3 = 200, paso = 10
INDICADOR 2: BANDAS DE BOLLINGER
Con este indicador podrá ver la fuerza y la tendencia del mercado, es decir la mide la volatilidad del precio del activo.
Si el precio sobrepasa la banda superior, el activo está sobrecomprado.
Si el precio sobrepasa la banda inferior, el activo está sobrevendido.
Longitud tendencia - BASE = 20, paso = 1
Desviación Estándar - Multiplicador = 2, paso = 0.2
Estos 2 indicadores sirven para todo tipo de activos: FOREX, CRIPTO, CFD´s, ETC.
------------------------------------------------------------------------------------------------------------------
THREE EMAS + BOLLINGER BANDS
INDICATOR 1: THREE EMAS (EXPONENTIAL MOVING AVERAGE)
With this indicator you can visualize the average of prices with greater weight to the most recent data.
Three exponential moving averages are calculated and drawn: 4, 20 and 200 last candles.
-Fast EMA1 = 4, step = 1
-Average EMA2 = 20, step = 2
-Slow EMA 3 = 200, step = 10
INDICATOR 2: BOLLINGER BANDS
With this indicator you can see the strength and trend of the market, that is, it is measured by the volatility of the asset price.
If the price goes above the upper band, the asset is overbought.
If the price goes above the lower band, the asset is oversold.
Trend length - BASE = 20, step = 1
Standard Deviation - Multiplier = 2, step = 0.2
These 2 indicators are used for all types of assets: FOREX, CRYPT, CFD's, ETC.

Pivots High-Low Screener & AlertsHi fellow traders ,
Pleased to share a Pivot High - Low Screener.
The script uses the TV inbuilt Pivot function.
It Screens 25 tickers default set, these can be modified in the input dialog box.
All you need to do is attach to any chart and set the periodicity or the resolution of the chart to your desired alert() frequency requirement.
Now go to the input settings icon of the script and set your Pivot right and left parameters!
Set the alert from the menu as usual click - Any alert() function call and bingo you are done!!
Similarily change the chart periodicity to the next timeframe and set the next alert.
No more opening multiple charts and setting individual time consuming alerts().
You will get concatenated alerts or summary alerts for your tickers.
Track 25tickers with a single alert for each timeframe(Supports 40 tickers).
Happy trading with TV..

The Divergent - Advanced Divergence IndicatorAutomated divergence detection with unparalleled customizability for any market on TradingView.
This is the Basic (Free) version of The Divergent - Advanced Divergence Indicator .
Features :
1. Divergence detection for any market & any timeframe
Bitcoin? Tesla? Gold? You name it. The Divergent will spot divergences for you on any market and any timeframe.
2. Choose from 2 built-in oscillators
The Basic version of The Divergent comes with 2 built-in oscillators: MACD and RSI
3. Automated detection of Regular Bullish and Regular Bearish divergences
The Basic version of The Divergent can detect two types of divergences: Regular Bullish and Regular Bearish
4. Complete control over every aspect of divergence detection
The Divergent exposes over 40 different settings to allow you fine tune the divergence detection algorithm.
- Oscillator (MACD / RSI)
- Detect Regular Bullish Divergences
- Detect Regular Bearish Divergences
- Pivot Detection Source (Price / Oscillator)
- Source smoothing
- Candle Pivot Detection Mode (Bodies / Wicks)
- Pivot Lookback Right
- Pivot Lookback Left
- Divergence Max. Length
- Divergence Min. Length
- Number of Historic Pivots to Compare
- Pivot Correction
- Restrict Starting Pivot to a Single Divergence
- Allow Early Detection of Divergences
- Line of Sight filter
- Minimum Pivot Change filter
- Pivot Candle Color filter
- Moving Average Filter
- MACD settings
- RSI settings
5. Divergence statistics
6. Fully documented
The Divergent has each and every of its inputs documented via tooltips inside the settings panel. Simply hover your mouse over the ( i ) icon next each the input field to learn more about the purpose of the configuration.
---

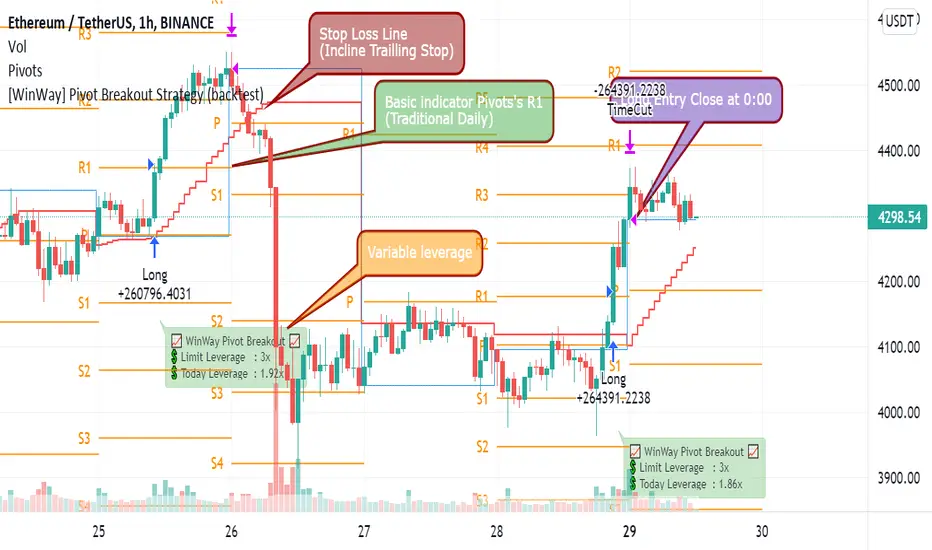
[WinWay] Pivot Breakout Strategy (backtest)This is the Winway's Pivot breaktout,
Using the Pivot point , we made a new volatility breakout strategy.
It's the strategy for ETH / BTC.
Please choose 1H time frame.
No repaint.
"As a long-only day trend strategy, we pursue profits in the downward / transverse / rising market."
- It will be exited based on the closing price of the day as a strategy to take only the day trend.
- It's a long-only strategy without short trade.
- It has high market adaptability in response to market volatility .
"The efficiency has been increased by delicate control of entry volume ."
- Control losses by managing funds in line with market changes.
- Calculate the leverage on the real time automatically.
- It goes in more when it's advantageous and less when it's disadvantageous
- It's a welfare strategy that works against assets
"We further lowered the risk by cutting off in installments."
- If you judge that the trend has declined on the day, you will break off and respond to a sharp drop by using the real time trailing stop.
========================================================================================
윈웨이의 피봇돌파입니다.
피봇 포인트를 이용한 새로운 변동성 돌파 전략입니다.
이더리움과 비트코인을 위한 전략이며
1H 타임프레임으로 선택해주세요
리페인트는 발생하지 않습니다.
롱 온리 당일 추세 전략으로 하락/횡보/상승 장에서 수익을 추구합니다.
- 당일 추세만 취하는 전략으로 일봉 종가 기준 청산됩니다.
- 숏은 없는 롱 온리 전략입니다.
- 시장 변동성에 따라 대응하여 시장 적응력이 높습니다.섬세한 진입 물량 제어로 효율을 높였습니다.
- 시장 변화에 맞춰 자금관리를 하여 손실을 제어합니다.
- 당일 레버리지를 실시간으로 자동 계산합니다.
- 유리할때 더 들어가고, 불리할때 적게 들어갑니다.
- 자산대비로 작동하는 복리 전략입니다.
손절로 리스크를 더욱 낮췄습니다.
- 당일 추세가 꺾였다고 판단하면 손절하여, 실시간 트레일링 스탑을 이용하여 급락에 대응합니다.
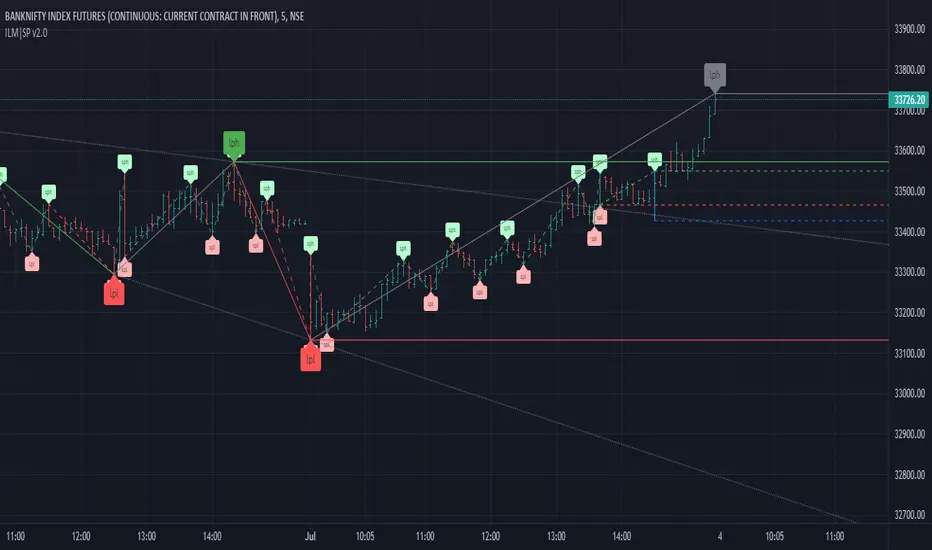
ILM | Structural Pivots v1This script will mark the structural pivots based on some rules.
Solid green/red lines are for major trend to mark LPH (Large Pivot High) and LPL (Large Pivot Low).
Dotted green/red lines are for minor trend SPH (Small Pivot High) and SPL (Small Pivot Low). SPH and SPL are not marked as labels to reduce congestion on the chart.
Gray lines are to identify temporary large pivots before they get promoted to LPH / LPL
Blue lines are to identify temporary small pivots before they get promoted to SPH / SPL
Couple of common trading strategies
- Go Long above LPH
- Go Short below LPL
- Go Long above SPH after LPH
- Go Short below SPL after LPL
Mean Reversion
- Go Long above SPH after LPL
- Go Short below SPL after LPH
This is the initial version and I am making it as public beta to iron out any issues. I might make this script private in future - FYI
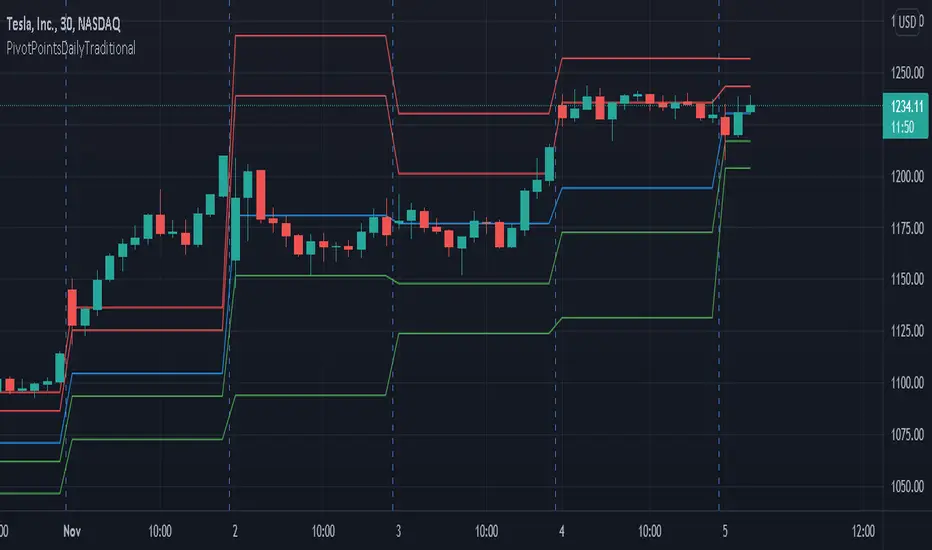
PivotPointsDailyTraditionalLibrary "PivotPointsDailyTraditional"
Provides the traditional daily pivot values and a pivot vacinity function.
P(level, daysPrior) Returns the P value.
Parameters:
level : The level to caclulate.
daysPrior : The number of days in the past to do the calculation.
R(level, daysPrior) Calculates the R value for a given pivot level.
Parameters:
level : The level to caclulate.
daysPrior : The number of days in the past to do the calculation.
S(level, daysPrior) Calculates the S value for a given pivot level.
Parameters:
level : The level to caclulate.
daysPrior : The number of days in the past to do the calculation.
vacinity(value, daysPrior, maxLevel) Returns a value representing where the provided value is in relation to each pivot level.
Parameters:
value : The value to compare against.
daysPrior : The number of days in the past to do the calculation.
maxLevel : The maximum number of pivot levels to include.
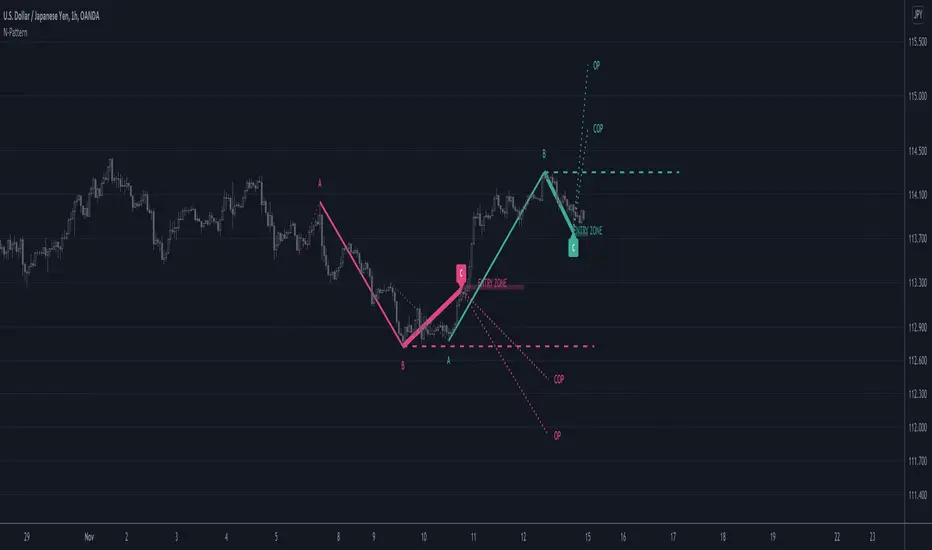
N PatternThis indicator looks for N patterns on the chart and illustrates them.
It predicts the future point D from the most recent point C and the past points A and B.
Settings:
Pivot Right bar / Pivot Left bar
Pivot settings.
Lookback
Go back a specified number of bars to find point A.
When point A is found, the opposite vertex in between is point B.
Nearest Bars Count
If the most recent C point and the previous C point are too close, the previous C point will be hidden.
Specify the number of bars to determine if they are too close.
Objectives
There are three types of D points, which are future prices.
Each can be shown or hidden.
Support/Resistance
Draw a line extending horizontally from point B as a support line or resistance line.