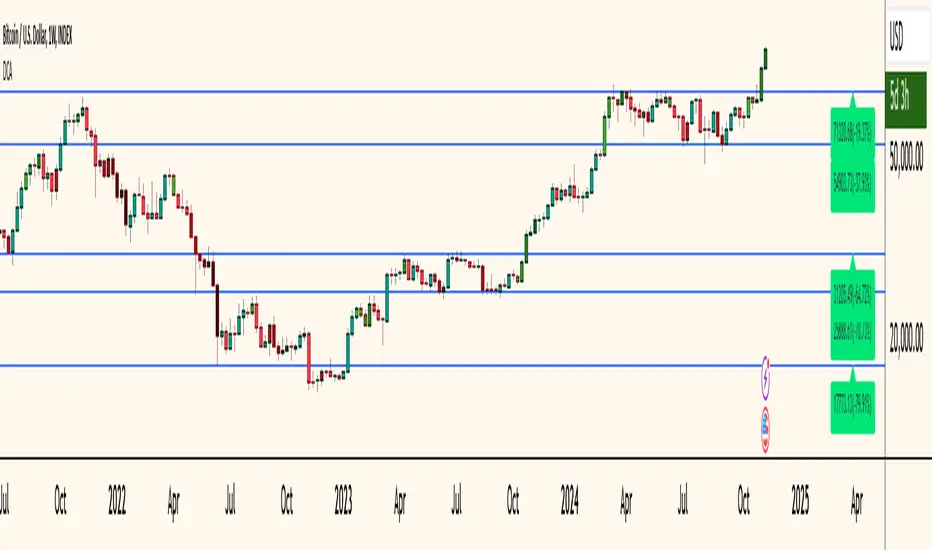
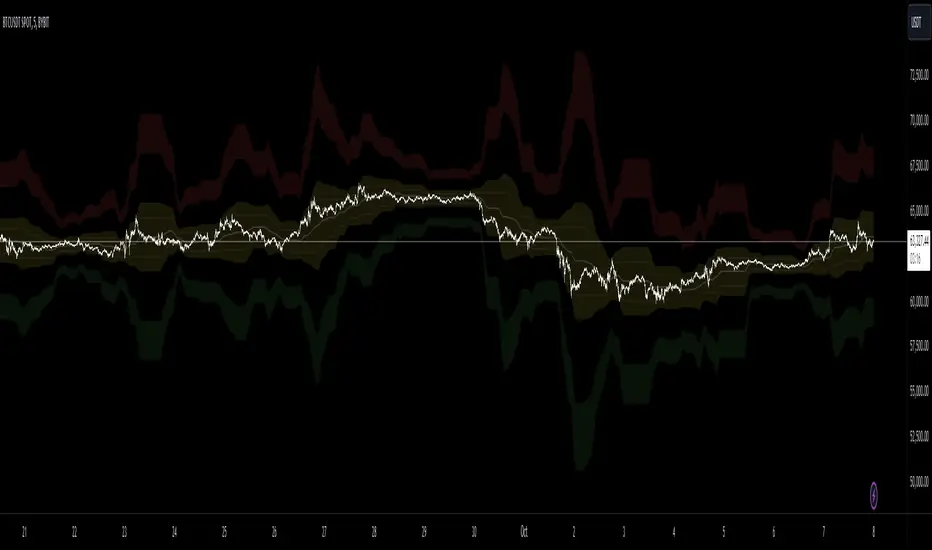
Dollar Cost Averaging (YavuzAkbay)The Dollar Cost Averaging (DCA) indicator is designed to support long-term investors following a Dollar Cost Averaging strategy. The core aim of this tool is to provide insights into overbought and oversold levels, assisting investors in managing buy and sell decisions with a clear visual cue system. Specifically developed for use in trending or fluctuating markets, this indicator leverages support and resistance levels to give structure to investors' buying strategies. Here’s a detailed breakdown of the indicator’s key features and intended usage:
Key Features and Color Coding
Overbought/Oversold Detection:
The indicator shades candles from light green to dark green when an asset becomes increasingly overbought. Dark green signals indicate a peak, where the asset is overbought, suggesting a potential opportunity to take partial profits.
Conversely, candles turn from light red to dark red when the market is oversold. Dark red signifies a heavily oversold condition, marking an ideal buying window for initiating or adding to a position. This color scheme provides a quick visual reference for investors to manage entries and exits effectively.
Support and Resistance Levels:
To address the risk of assets falling further after an overbought signal, the DCA indicator dynamically calculates support and resistance levels. These levels guide investors on key price areas to watch for potential price reversals, allowing them to make more informed buying or selling decisions.
Support levels help investors assess whether they should divide their capital across multiple buy orders, starting at the current oversold zone and extending to anticipated support zones for maximum flexibility.
Usage Methodology
This indicator is intended for Dollar Cost Averaging, a method where investors gradually add to their position rather than entering all at once. Here’s how it complements the DCA approach:
Buy at Oversold Levels: When the indicator shows a dark red candle, it signals that the asset is oversold, marking an optimal entry point. The presence of support levels can help investors determine if they should fully invest their intended amount or stagger buys at potential lower levels.
Sell at Overbought Levels: When the indicator transitions to dark green, it suggests that the asset is overbought. This is an ideal time to consider selling a portion of holdings to realize gains. The resistance levels, marked by the indicator, offer guidance on where the price may encounter selling pressure, aiding investors in planning partial exits.
Customizable Settings
The DCA indicator offers several user-adjustable parameters:
Pivot Frequency and Source: Define the pivot point frequency and the source (candle wick or body) for more tailored support/resistance detection.
Maximum Pivot Points: Set the maximum number of pivot points to be used in support/resistance calculations, providing flexibility in adapting to different market structures.
Channel Width and Line Width: Adjust the width of the channel for support/resistance levels and the thickness of the lines for easier visual tracking.
Color Intensities for Overbought/Oversold Levels: Customize the shading intensity for each overbought and oversold level to align with your trading preferences.
Các điểm Pivot
Swing Percentile Lines [QuantVue]The Swing High/Low Percentile Indicator is designed to help traders identify key price levels based on the most recent swing high and low. By anchoring to the most recent swing high and swing low, the indicator automatically generates percentile lines ( 25%, 50%, 75%) that act as dynamic support and resistance levels.
What Does the Indicator Do?
The Swing High/Low Percentile Indicator works by identifying the most recent significant price swings, whether it's a swing high or swing low. It then calculates the range between these points and divides the distance into percentage-based levels. These levels are plotted on the chart as clear, easy-to-read lines at 25%, 50%, and 75% of the range between the swing high and low.
These percentile lines serve as dynamic price zones where traders can anticipate potential reactions, whether the market is trending or consolidating.
How Can Traders Use the Indicator?
Support and Resistance: The percentile lines act as evolving support and resistance zones. Traders can anticipate price bounces or breaks at these levels, providing opportunities for trend-following or reversal trades.
Trend Identification: The indicator helps traders determine the strength of a trend. In a strong uptrend, price will likely stay above the 50% or 75% lines, while in a downtrend, it may remain below the 50% or 25% lines. This gives traders an edge in recognizing the overall market direction.
Entry and Exit Points: Traders can use the percentile lines to time their entries and exits. For example, entering a trade on a pullback to the 25% or 50% line offers a favorable risk-to-reward ratio. Similarly, the percentile lines serve as natural profit targets, allowing traders to plan exits as the price approaches the 50% or 75% levels.
Risk Management: The clear delineation of price levels makes it easy for traders to set stop-loss orders. For example, if price falls below the 25% line in an uptrend, it may signal weakness, prompting an exit or reduced position size.
Breakout and Breakdown Scenarios: When price breaks above a recent swing high or below a swing low, the percentile lines provide traders with pullback entry opportunities or key levels to watch for continuation of the move.

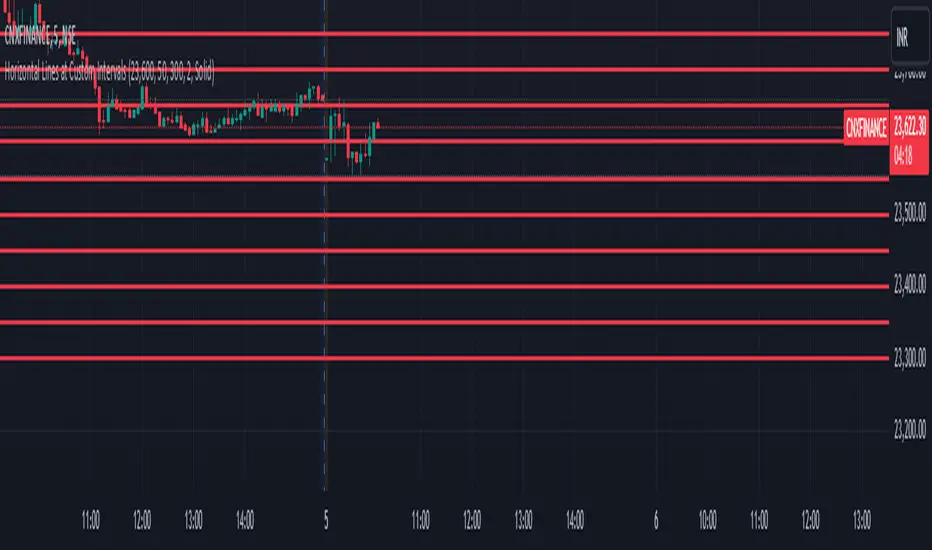
Horizontal Lines at Custom IntervalsThis Pine Script indicator, "Horizontal Lines at Custom Intervals," is a versatile tool designed to help traders visualize key price levels at regular intervals above and below a specified starting price. It is particularly useful for identifying support and resistance zones, psychological price levels, or potential entry and exit points around a central price reference.
Customizable Starting Price**: Set a central price around which the lines will be drawn, such as a current asset price, pivot level, or significant historical level.
- **Adjustable Intervals and Range**: Choose the interval distance (in points) between each horizontal line, as well as the total range above and below the starting price. This flexibility allows the indicator to adapt to different asset classes and timeframes.
- **Full Chart Extensions**: Each line is set to extend across the entire chart, providing a clear, continuous visual reference that spans both past and future price action.
- **Editable Line Style, Width, and Color**: Personalize the appearance of the lines with selectable color, width, and style options (Solid, Dotted, Dashed), enabling the indicator to match your charting preferences and visual style.
### Applications:
1. **Support and Resistance Identification**: Traders can use the evenly spaced lines to identify potential support and resistance zones around the starting price, helping to mark areas of interest where price may react.
2. **Psychological Levels**: Round-number levels often hold psychological significance in trading. By setting intervals to common round numbers, this indicator can help identify these critical levels.
3. **Scalping and Range Trading**: This tool is especially valuable in range-bound markets, where repeated price action within defined levels allows traders to buy and sell around predictable zones.
4. **Trend Reversal and Breakout Signals**: In trending markets, observing how price interacts with these levels can offer insights into possible breakouts or trend reversals.
### Example Use Case:
For instance, if BankNifty is trading around 51,130, you can set this as the starting price. With 50-point intervals and a range of 1,000 points, the indicator will plot lines at 50-point increments both above and below 51,130, covering a total range of 2,000 points. This setup provides clear visual cues for potential price reaction zones as the asset moves through different price levels.
This indicator is a simple yet powerful addition to any trader’s toolkit, offering a structured approach to analyzing price levels and making informed trading decisions.
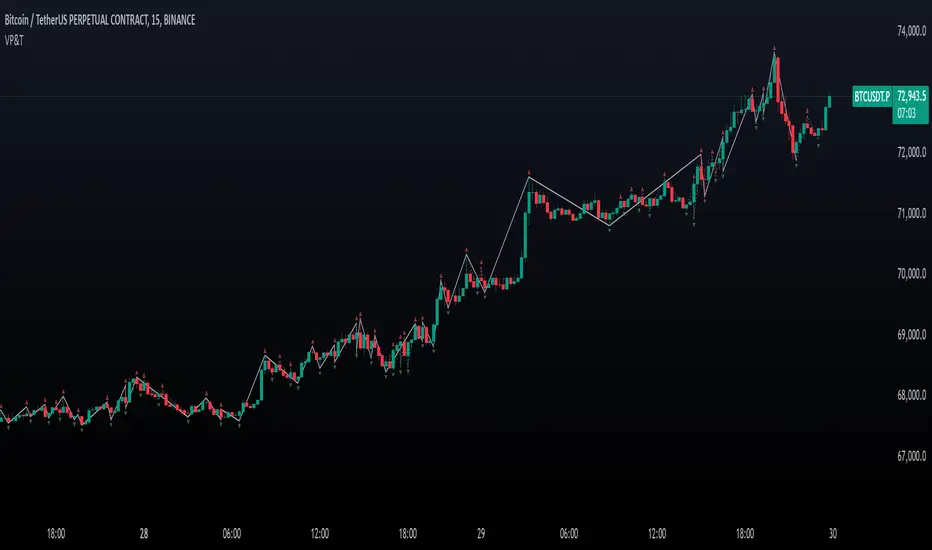
Valid Pullbacks and Trend by kpt. GonzoThis script helps identify valid pullbacks. Based on the marked pullbacks, it can draw both internal and external structure trendlines.
A pullback is marked with a small triangle above or below the candle that created the local high or low.
A new local high is marked with a red triangle above the candle if at least one subsequent candle has a low lower than the low of the candle that created the new local high.
A new local low is marked with a green triangle below the candle if at least one subsequent candle has a high higher than the high of the candle that created the new local low.
Based on the marked local highs and lows, the internal structure trendline is created by simply connecting all highs and lows with a line.
The external structure is drawn in a similar way, but only highs and lows that have broken the previous structure are connected. This helps focus on important pivots and better understand the market structure.
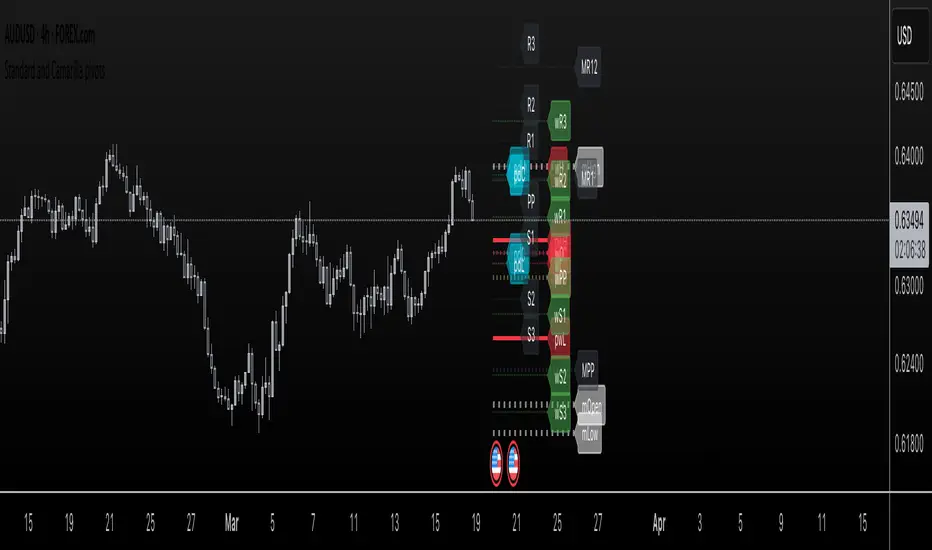
Standard and Camarilla pivotsHi guys, I would like too introduce to all of you my script. As the name already tell you what this script is all about. It's about pivot points.
You may ask, Tradingview already have a script for pivot points, why would I need another script?
here is the answer: This script allow you to add more than one type of pivot, sounds good right?
But there's more: You can see not just one timeframe pivots, you can see many timeframe pivots, nice huh?
let dive into it to know a bit more.
In this script you can see daily pivots include Standard pivots as R1, R2, R3 and Camarilla pivots as cR1, cR2, cR3, and I you different color for different pivots, so you don't confuse between those two.
You can see weekly pivots the same as daily pivots only has letter "w" in front of it, for examples: "wR1, wR2, wcR1, wcR2" ,nice right?
What's about month level: yes, you can see monthly pivots too, and it start with "m".
Along with pivots points above, you also can see daily open, previous day close, previous high,.., for instances: daily open as "O", previous day open as "PDO",
You are able to see previous week level, previous month levels.
have fun.
I dont wanna lock this script because open-source script help me learn how to code pine script, so that's why I keep it open. Thank to all the coders out there that shared everything they have for us to learn.
5-0 Harmonic Pattern [TradingFinder] 0XABCD 50 Harmonic Detector🔵 Introduction
Harmonic patterns are a powerful tool in technical analysis, widely used to detect reversal points and trend changes. Among these, the 5-0 Harmonic Pattern stands out due to its reliance on specific Fibonacci ratios—1.13, 1.618, 2.24, and 0.45 to 0.55—anchored at points 0, X, A, B, C, and D. This pattern provides a structured approach for identifying critical buy and sell points, helping traders achieve optimal entry and exit levels in volatile markets.
This 5-0 Harmonic Pattern indicator automatically detects and marks bullish and bearish formations on the chart, offering precise trading signals based on established harmonic ratios. With its dynamic signals, the 5-0 pattern enables traders to anticipate market movements and capitalize on favorable price trends.
Especially in fast-moving markets, harmonic patterns, particularly the 5-0 Harmonic Pattern, equip traders with an essential framework for identifying reversal opportunities and refining their trading strategies.
Bullish 5-0 Pattern :
Bearish 5-0 Pattern :
🔵 How to Use
The 5-0 Harmonic Pattern indicator is designed to automatically mark the key levels of the harmonic structure: 0, X, A, B, C, and D. By doing so, it detects both bullish and bearish patterns and helps traders recognize optimal entry and exit points.
Formed through specific Fibonacci levels, this pattern signals potential shifts in trend direction, giving traders critical insights for managing entries and exits effectively. The tool proves valuable in high-volatility settings, enabling traders to leverage these signals for refined decision-making.
🟣 Bullish 5-0 Pattern
A bullish 5-0 pattern materializes when Fibonacci levels indicate a potential price reversal to the upside. With points 0, X, A, B, C, and D in alignment, the indicator highlights this upward momentum by displaying a green arrow as a buy signal on the chart. This marking provides a clear entry point, indicating that prices are likely to rise, making it a prime moment for traders to enter long positions.
Additionally, the bullish 5-0 pattern is equipped with tools for traders to set stop-loss and take-profit points based on harmonic lines within the pattern, which represent support and resistance levels. Using these dynamic points, traders can create a more effective risk-reward setup while following the bullish signals in a standalone harmonic strategy.
🟣 Bearish 5-0 Pattern
The bearish 5-0 pattern functions similarly but signals a likely downturn. This pattern emerges when Fibonacci ratios align at points 0, X, A, B, C, and D, predicting a reversal downward. The indicator generates a sell signal, marked by a red arrow, prompting traders to exit long positions or initiate short trades to capitalize on falling prices.
Traders can utilize this bearish pattern for defining exit strategies and setting key levels for stop-loss and take-profit orders. The bearish 5-0 pattern enhances traders’ abilities to gauge critical price levels and manage trade risk effectively, especially in volatile markets. For traders focused on profiting from downward trends, this indicator serves as a powerful tool for timely entries and exits.
🔵 Setting
🟣 Logical Setting
ZigZag Pivot Period : You can adjust the period so that the harmonic patterns are adjusted according to the pivot period you want. This factor is the most important parameter in pattern recognition.
Show Valid Forma t: If this parameter is on "On" mode, only patterns will be displayed that they have exact format and no noise can be seen in them. If "Off" is, the patterns displayed that maybe are noisy and do not exactly correspond to the original pattern.
Show Formation Last Pivot Confirm : if Turned on, you can see this ability of patterns when their last pivot is formed. If this feature is off, it will see the patterns as soon as they are formed. The advantage of this option being clear is less formation of fielded patterns, and it is accompanied by the latest pattern seeing and a sharp reduction in reward to risk.
Period of Formation Last Pivot : Using this parameter you can determine that the last pivot is based on Pivot period.
🟣 Genaral Setting
Show : Enter "On" to display the template and "Off" to not display the template.
Color : Enter the desired color to draw the pattern in this parameter.
LineWidth : You can enter the number 1 or numbers higher than one to adjust the thickness of the drawing lines. This number must be an integer and increases with increasing thickness.
LabelSize : You can adjust the size of the labels by using the "size.auto", "size.tiny", "size.smal", "size.normal", "size.large" or "size.huge" entries.
🟣 Alert Setting
Alert : On / Off
Message Frequency : This string parameter defines the announcement frequency. Choices include: "All" (activates the alert every time the function is called), "Once Per Bar" (activates the alert only on the first call within the bar), and "Once Per Bar Close" (the alert is activated only by a call at the last script execution of the real-time bar upon closing). The default setting is "Once per Bar".
Show Alert Time by Time Zone : The date, hour, and minute you receive in alert messages can be based on any time zone you choose. For example, if you want New York time, you should enter "UTC-4". This input is set to the time zone "UTC" by default.
Conclusion
The 5-0 Harmonic Pattern indicator serves as a robust solution for technical analysts and traders looking to pinpoint market reversal points. By automatically recognizing 5-0 patterns and generating buy and sell signals based on Fibonacci ratios, this tool supports precise trend analysis and entry/exit timing. The indicator’s adjustable alerts, color themes, and pattern toggles allow for comprehensive customization, ensuring alignment with individual trading strategies.
Harmonic patterns, especially the 5-0 Harmonic Pattern, guide traders in identifying high-accuracy entry and exit points, thus aiding in more informed trading decisions. By combining Fibonacci ratio analysis with real-time signal updates, this indicator provides a well-rounded approach for risk management and capitalizing on trading opportunities. Professional traders can harness this tool to enhance technical analysis precision and capitalize on price trends effectively, maximizing profitability in both bullish and bearish markets.

Swing Breakout Sequence [LuxAlgo]The Swing Breakout Sequence tool enables traders to identify a directional price action scalping sequence comprising two unsuccessful breakouts in the same direction, with the expectation of a third.
🔶 USAGE
This sequence looks for pressure on one side of a swing zone.
The market tried to break out of the zone twice but failed. This led to a pullback into the zone after each attempt. Once a reversal inside the zone is identified, the sequence is complete. It is expected that the market will move from the final reversal within the zone to the final breakout attempt outside the zone.
The sequence of price action is as follows:
Point 1: Breakout attempt out of the swing zone
Point 2: Pullback into the zone
Point 3: Breakout attempt out of Point 1
Point 4: Pullback into the zone, tapping into Point 2 liquidity
Point 5: Reversal structure with Point 4 in the form of a double top or double bottom
This sequence assumes traders will be caught off-guard when they try to capitalize on the initial breakout at Point 1, which is likely to result in a loss. If the breakout at Point 3 fails, all traders will be caught out and switch positions.
If there is enough pressure in the swing zone to cause a reversal at Point 5, the trapped traders could be the start of the next breakout attempt.
🔹 Sequence Detection
Traders can define sequence behavior and adjust detection with three parameters from the Settings panel.
Disabling Points 4 and 5 will detect the most uncompleted sequences.
🔹 Showing/Hiding Elements
Traders can change the look of sequences by showing or hiding their parts using the Style settings.
🔶 SETTINGS
Swing Length: Number of candles to confirm a swing high or swing low. A higher number detects larger swings.
Internal Length: Number of candles to confirm a internal high or internal low. A lower number detects smaller swings. It must be the same size or smaller than the swing length.
🔹 Detection
Point 4 Beyond Point 2: It only detects sequences where Point 4 is beyond Point 2.
Show Point 5: Enable/disable Point 5 detection.
Require Equal H/L at Point 5: Enable/Disable double top/bottom detection at Point 5 within a given threshold. A bigger value detects more sequences.
🔹 Style
Show Sequence Path: Enable/disable a line between sequence points.
Show Boxes: Enable/disable colored boxes for each sequence.
Show Lines: Enable/disable horizontal lines from each point of the sequence.
Default Color: Define the color or enable/disable auto color.

Pivot Bollinger BandThis is a special kind of Bollinger Bands indicator that adapts to the market's pivot points. Instead of using regular price data, it first finds important swing highs and lows in the market (called pivot points). It then uses these pivot points to create a center line, which is like a moving average of where the market is pivoting.
Around this center line, it draws the classic Bollinger Bands - an upper and lower band that show where prices might find resistance or support. The distance between these bands changes based on market volatility, just like regular Bollinger Bands. You can adjust how sensitive it is to pivot points and how wide the bands should be.
By using pivot point based Bollinger Bands, we expect band breakout can be captured more effectively.

CPR by NKDCentral Pivot Range (CPR) Trading Strategy:
The Central Pivot Range (CPR) is a widely-used tool in technical analysis, helping traders pinpoint potential support and resistance levels in the market. By using the CPR effectively, traders can better gauge market trends and determine favorable entry and exit points. This guide explores how the CPR works, outlines its calculation, and describes how traders can enhance their strategies using an extended 10-line version of CPR.
What Really Central Pivot Range (CPR) is?
At its core, the CPR consists of three key lines:
Pivot Point (PP) – The central line, calculated as the average of the previous day’s high, low, and closing prices.
Upper Range (R1) – Positioned above the Pivot Point, acting as a potential ceiling where price may face resistance.
Lower Range (S1) – Found below the Pivot Point, serving as a potential floor where price might find support.
Advanced traders often expand on the traditional three-line CPR by adding extra levels above and below the pivot, creating up to a 10-line system. This extended CPR allows for a more nuanced understanding of the market and helps identify more detailed trading opportunities.
Applying CPR for Trading Success
1. How CPR is Calculation
The CPR relies on the previous day's high (H), low (L), and close (C) prices to create its structure:
Pivot Point (PP) = (H + L + C) / 3
First Resistance (R1) = (2 * PP) - L
First Support (S1) = (2 * PP) - H
Additional resistance levels (R2, R3) and support levels (S2, S3) are calculated by adding or subtracting multiples of the previous day’s price range (H - L) from the Pivot Point.
2. Recognizing the Market Trend
To effectively trade using CPR, it’s essential to first determine whether the market is trending up (bullish) or down (bearish). In an upward-trending market, traders focus on buying at support levels, while in a downward market, they look to sell near resistance.
3. Finding Ideal Entry Points
Traders often look to enter trades when price approaches key levels within the CPR range. Support levels (S1, S2) offer buying opportunities, while resistance levels (R1, R2) provide selling opportunities. These points are considered potential reversal zones, where price may bounce or reverse direction.
4. Managing Risk with Stop-Loss Orders
Proper risk management is crucial in any trading strategy. A stop-loss should be set slightly beyond the support level for buy positions and above the resistance level for sell positions, ensuring that losses are contained if the market moves against the trader’s position.
5. Determining Profit Targets
Profit targets are typically set based on the distance between entry points and the next support or resistance level. Many traders apply a risk-reward ratio, aiming for larger potential profits compared to the potential losses. However, if the next resistance and support level is far then middle levels are used for targets (i.e. 50% of R1 and R2)
6. Confirmation Through Other Indicators
While CPR provides strong support and resistance levels, traders often use additional indicators to confirm potential trade setups. Indicators such as moving averages can
help validate the signals provided by the CPR.
7. Monitoring Price Action At CPR Levels
Constantly monitoring price movement near CPR levels is essential. If the price fails to break through a resistance level (R1) or holds firm at support (S1), it can offer cues on when to exit or adjust a trade. However, a strong price break past these levels often signals a continued trend.
8. Trading Breakouts with CPR
When the price breaks above resistance or below support with strong momentum, it may signal a potential breakout. Traders can capitalize on these movements by entering positions in the direction of the breakout, ideally confirmed by volume or other technical indicators.
9. Adapting to Changing Market Conditions
CPR should be used in the context of broader market influences, such as economic reports, news events, or geopolitical shifts. These factors can dramatically affect market direction and how price reacts to CPR levels, making it important to stay informed about external market conditions.
10. Practice and Backtesting for Improvements
Like any trading tool, the CPR requires practice. Traders are encouraged to backtest their strategies on historical price data to get a better sense of how CPR works in different market environments. Continuous analysis and practice help improve decision-making and strategy refinement.
The Advantages of Using a 10-Line CPR System
An extended 10-line CPR system—comprising up to five resistance and five support levels—provides more granular control and insight into market movements. This expanded view helps traders better gauge trends and identify more opportunities for entry and exit. Key benefits include:
R2, S2 Levels: These act as secondary resistance or support zones, giving traders additional opportunities to refine their trade entries and exits.
R3, S3 Levels: Provide an even wider range for identifying reversals or trend continuations in more volatile markets.
Flexibility: The broader range of levels allows traders to adapt to changing market conditions and make more precise decisions based on market momentum.
So in Essential:
The Central Pivot Range is a valuable tool for traders looking to identify critical price levels in the market. By providing a clear framework for identifying potential support and resistance zones, it helps traders make informed decisions about entering and exiting trades. However, it’s important to combine CPR with sound risk management and additional confirmation through other technical indicators for the best results.
Although no trading tool guarantees success, the CPR, when used effectively and combined with practice, can significantly enhance a trader’s ability to navigate market fluctuations.

Weekly Initial BalanceWeekly Initial Balance Indicator
The Weekly Initial Balance (IB) indicator is a powerful tool designed for traders to identify key support and resistance levels based on the market's initial activity at the start of each week. By analyzing the first 30 hours of trading.
Key Features:
Customizable IB Period: Define the start hour and duration of the initial balance period to suit your trading schedule and the specific market you are analyzing, I have it set at 30 hours by default.
IB High, Low, and Midpoint Levels: Automatically plots the high, low, and midpoint of the IB period, providing immediate visual reference to critical price levels.
Extension Levels: Calculate and display extension levels based on customizable percentages (e.g., 50%, 100%, 150%), allowing you to project potential breakout targets and identify areas of interest beyond the initial balance range.
Dynamic Lines and Labels: The indicator updates in real-time, extending lines and repositioning labels as new bars form, ensuring you always have the most current information.
Customizable Appearance: Adjust line styles, widths, colors, and label positions to match your charting preferences and improve visual clarity.
How to Use:
Set the IB Parameters:
Week Start Hour (UTC): Specify the hour when the weekly IB period begins. I use 1800EST as that is when the futures market opens.
IB Duration in Hours: Define how many hours constitute the IB period.
Configure Extension Levels:
Input the desired extension percentages to calculate levels beyond the IB range.
Customize Visual Settings:
Adjust line colors, styles, widths, and label offsets to tailor the indicator's appearance.
Interpret the Levels:
Use the IB high and low as immediate support and resistance levels.
Monitor the midpoint for potential pivot areas.
Watch for price interactions with extension levels to anticipate breakouts or reversals.
Benefits:
Identify Key Weekly Levels: Understand the market's initial sentiment each week to gauge potential trends.
Enhance Trading Strategies: Incorporate the IB levels into your trading plan for better entry and exit points.
Adaptable to Various Markets: Suitable for Forex, commodities, indices, and other markets where weekly analysis is beneficial.

[MAD] Fibonacci Bands with SmoothingHi, this is just an easy script, nothing special, it was a request from a community member and was finished in just 40 minutes :D
This indicator offers a approach to tracking market price movements by utilizing Fibonacci-based levels combined with customizable smoothing options for both the bands and the high/low values.
Key Features:
Customizable Moving Averages: Choose from a variety of smoothing methods, including SMA, EMA, WMA, HMA, VWMA, and advanced Ehlers-based methods.
This allows for flexible adaptation to different assets.
Multiple Fibonacci Band Multipliers: The user can define six different multipliers for both the upper and lower Fibonacci bands, allowing for granular customization of the indicator. The middle line serves as the central reference, and the multipliers extend the bands outward based on price range dynamics.
High/Low Smoothing: In addition to smoothing the Fibonacci bands, users can apply smoothing to the high and low prices that form the basis for calculating the Fibonacci bands. This ensures that the indicator responds smoothly to market movements, reducing noise while capturing key trends.
Forward Shift Option: Allows for projecting the bands into the future by shifting the calculated levels forward by a user-specified number of periods. This feature is particularly useful for those interested in anticipating price actions and future trends.
Visual Enhancements: The indicator features filled regions between bands to clearly visualize the zones of price movement. The fills between the bands offer insight into potential support and resistance zones, based on price levels defined by the Fibonacci ratios.
How It Works:
The indicator uses the highest and lowest closing prices over a specified lookback period to establish a price range. Based on this range, it calculates the middle line (0.5 level) and applies user-defined Fibonacci multipliers to generate both upper and lower bands. Users have control over the smoothing method for both the high/low prices and the bands themselves, allowing for an adaptive experience that can be tailored to different timeframes or market conditions.
For visualization, areas between the upper and lower bands are filled with distinct colors, providing an intuitive view of the potential price zones where the market might react or consolidate.
These fills highlight the zones created by the Fibonacci bands, helping users identify critical market levels with ease.
have fun
p.s.: @frankchef hope that suits your needs & expectations ;-)
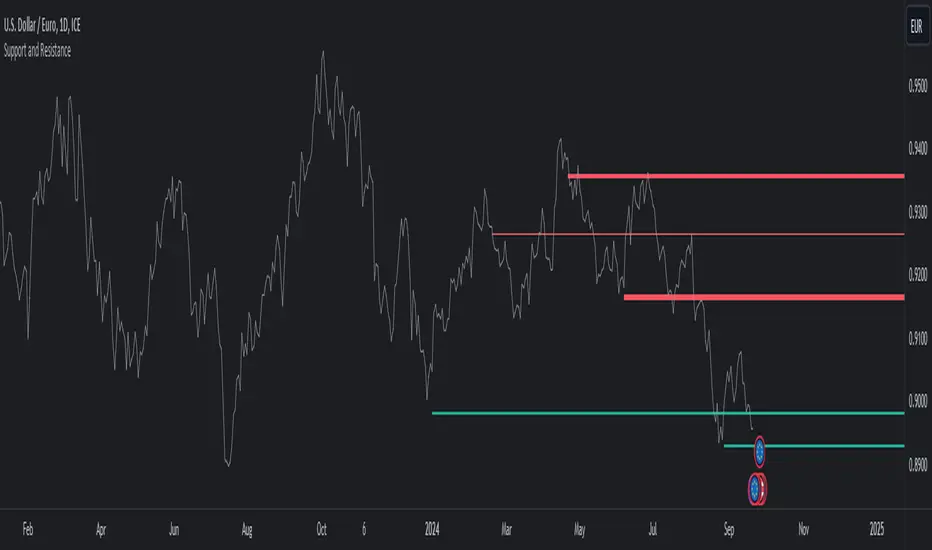
Support and ResistanceThis indicator, titled "Support and Resistance," is designed to identify and display key price levels based on volume and pivot points. It's a versatile tool that can be adapted for different market views and timeframes.
Key Features
Market View Options
The indicator offers three market view settings:
Short term
Standard
Long term
These settings affect the lookback periods used in calculations, allowing users to adjust the indicator's sensitivity to market movements.
Volume-Based Levels
The indicator calculates support and resistance levels using a rolling Point of Control (POC) derived from volume data. This approach helps identify price levels where the most trading activity has occurred.
Pivot Points
In addition to volume-based levels, the indicator incorporates pivot points to identify potential support and resistance areas.
Customizable Appearance
Users can adjust:
Number of lines to display (1-8)
Colors for support and resistance levels
Line thickness based on level importance
Calculation Methods
Rolling POC
The indicator uses a custom function f_rolling_poc to calculate the rolling Point of Control. This function analyzes volume distribution across price levels within a specified lookback period.
Pivot Points
Both standard and quick pivot points are calculated using the rolling POC as input, rather than traditional price data.
Level Importance
The indicator assigns importance to each level based on:
Number of touches (how often price has interacted with the level)
Duration (how long the level has been relevant)
This importance score determines the thickness of the displayed lines.
Unique Aspects
Dynamic Line Thickness: Lines become thicker when levels overlap, highlighting potentially stronger support/resistance areas.
Adaptive Coloring: The color of each line changes dynamically based on whether the current price is above or below the level, indicating whether it's acting as support or resistance.
Flexible Time Frames: The market view options allow the indicator to be easily adapted for different trading styles and timeframes.
Potential Uses
This indicator could be valuable for:
Identifying key price levels for entry and exit points
Recognizing potential breakout or breakdown levels
Understanding the strength of support and resistance based on line thickness
Adapting analysis to different market conditions and timeframes
Overall, this "Support and Resistance" indicator offers a sophisticated approach to identifying key price levels, combining volume analysis with pivot points and providing visual cues for level importance and current market position.
This Support and Resistance indicator is provided for informational and educational purposes only. It should not be considered as financial advice or a recommendation to buy or sell any security. The indicator's calculations are based on historical data and may not accurately predict future market movements. Trading decisions should be made after thorough research and consultation with a licensed financial advisor. The creator of this indicator is not responsible for any losses incurred from its use. Past performance does not guarantee future results. Use at your own risk.
Absolute ZigZagThis ZigZag Indicator is a bit unique in it's kind.
It uses my own Absolute ZigZag Lib to calculate the pivots:
Instead of using percentages or looking more than 1 bar left or right, this Zigzag library calculates pivots by just looking at the current bar highs and lows and the ones of one bar earlier. This is a very fast and accurate way of calculating pivots.
The library also features a solution for bars that have both a higher high and a higher low like seen below.
You can also use your own colors for the labels and the lines:
You can also quickly select a one-colored theme without changing all colors at once:

Support Resistance DynamicsThe Support Resistance Dynamics indicator is an advanced technical analysis tool designed to identify and visualize key support and resistance levels in real-time. This innovative indicator stands out from traditional support and resistance tools by employing a dynamic approach that adapts to market conditions.
Key Features:
Dynamic Level Calculation: Unlike static support and resistance indicators, this tool continuously updates levels based on recent price action, providing traders with the most relevant and up-to-date information.
Logarithmic Scale Option: The indicator offers a unique logarithmic scale feature, essential for analyzing long-term trends or assets with significant price changes. This allows for more accurate level plotting across various timeframes and price ranges.
Customizable Display: Users can adjust the number of support and resistance lines displayed, allowing for a clean and uncluttered chart view while focusing on the most significant levels.
Adaptive Slope Calculation: The indicator uses an innovative approach to calculate the slope of support and resistance lines, offering options from dynamic adaptation to fixed long-term periods. This ensures the lines remain relevant in both trending and ranging markets.
Enhanced Visualization: With customizable line colors, styles, and transparency, traders can easily distinguish between support and resistance levels, improving chart readability and analysis.
Flexible Period Settings: From dynamic calculations based on recent pivots to fixed long-term periods, the indicator adapts to various trading styles and timeframes.
The Support Resistance Dynamics indicator is particularly useful for:
Identifying potential reversal points in trends
Setting more accurate entry and exit points for trades
Placing stop-loss orders with greater precision
Recognizing breakout levels for potential new trends
By combining dynamic calculation methods with customizable visual elements, this indicator provides traders with a powerful tool for market analysis. Whether you're a day trader looking for short-term opportunities or a long-term investor analyzing macro trends, the Support Resistance Dynamics indicator offers valuable insights to enhance your trading strategy.
This indicator is provided for informational and educational purposes only. It should not be considered as financial advice or a recommendation to buy or sell any financial instrument. Past performance is not indicative of future results. Trading involves significant risk of loss. Users should conduct their own research and due diligence before making any investment decisions. The creator of this indicator is not responsible for any losses incurred from its use. Always test thoroughly on demo accounts before applying to live trading.

[DarkTrader] Pivot Point HeatmapThe indicator calculates pivot points using price data from different timeframes such as 12M, 1M, 1W, 3D, and 1D. For each timeframe, it retrieves the high, low, open, and close prices of the previous bar. The pivot point is calculated as the average of the high, low, and close prices, which provides a central level where market sentiment may shift. This calculation is repeated for each timeframe, ensuring a multi-dimensional view of potential interest zones.
Importance of Pivot Points :
Pivot points are essential tools in technical analysis, providing traders with levels that act as potential support and resistance zones. These zones help identify price levels where reversals or breakouts are more likely to occur.
Visual Representation :
The core feature of this indicator is its ability to visualize pivot points as a heatmap on the chart. Instead of showing just the latest pivot points, it tracks the historical pivot swipe, providing a dynamic view of how price interacts with these key levels. Each pivot point is represented by a line, color-coded based on its position relative to other points, creating a gradient effect that highlights the most critical price areas.
Customization Options :
Traders can customize various aspects of the heatmap to suit their preferences. The indicator offers options to toggle pivot swipe history, enabling traders to either focus on the most recent price interactions or consider how price has behaved over time. The background color and pivot line colors are fully customizable, making it easy to match the heatmap with your chart's theme or emphasize certain price levels.
Detecting Sweeps and Price Interaction :
Another important feature is the detection of price interactions with pivot levels. If the current bar's high and low cross a pivot point, it signals that the pivot level has been "swept" by price action, potentially indicating a change in market sentiment. The indicator either extends the line if the pivot point remains relevant or deletes it if price has broken through. This dynamic adjustment helps traders stay updated on which pivot levels are still valid.

Support Resistance UltimateThe "Support Resistance ULTIMATE" indicator is a comprehensive tool for traders on the TradingView platform, designed to identify key support and resistance levels using two primary techniques: pivot points and volume data. This indicator provides flexibility and customization, allowing traders to adapt it to their specific trading strategies.
KEY FEATURES
Pivot-Based Levels:
This feature calculates support and resistance levels using pivot points, which are derived from the high, low, and close prices of previous trading periods. Pivot points are crucial for forecasting potential market turning points.
Users can customize the pivot calculation by selecting the source type (either 'Close' or 'High/Low') and adjusting the lookback periods for both the left and right sides of the pivot calculation. This flexibility allows traders to adapt the indicator to different market conditions and timeframes.
Volume-Based Levels:
This option focuses on identifying support and resistance levels based on volume data, specifically the Point of Control (POC). The POC represents the price level with the highest traded volume during a specific time period, reflecting a consensus value among market participants.
The indicator includes a rolling POC calculation, allowing traders to dynamically assess areas of significant trading interest that may serve as support or resistance zones.
ADVANTAGES
Customization and Flexibility:
Traders can choose between pivot-based and volume-based levels or use both simultaneously, depending on their analysis needs. This dual approach provides a comprehensive view of market dynamics, accommodating various trading styles.
The indicator offers customizable color settings for support and resistance lines, enhancing chart readability and allowing traders to personalize their visual analysis.
Enhanced Market Insights:
By utilizing pivot points, traders can identify potential reversal or consolidation points, aiding in the prediction of market trends and the establishment of strategic entry and exit points.
Volume-based levels provide insights into market sentiment and participation, highlighting areas of strong support or resistance based on trading volume. This can improve risk management and trade execution by identifying high-probability trading zones.
Importance Scoring:
The indicator calculates the importance of each level based on the number of touches and the duration it holds. This scoring system helps traders assess the strength of support and resistance levels, with thicker lines indicating more significant levels.
This indicator is intended for educational and informational purposes only and should not be considered financial advice. Trading involves significant risk, and you should consult with a financial advisor before making any trading decisions. The performance of this indicator is not guaranteed, and past results do not predict future performance. Use at your own risk.

Pivot Data [QuantVue]The Pivot Data Indicator is designed to provide traders with valuable insights by identifying and analyzing pivot points on the price chart. It calculates both pivot highs and lows, then presents detailed statistics on the distance and time between these pivots.
a pivot point is defined as a specific point on the chart where the price either reaches a high or a low, with no bars higher or lower than it for a set number of bars on both sides (left and right). Essentially, it's a local high or low point, with the market moving in the opposite direction after the pivot forms.
For example:
A pivot high occurs when there are no bars with higher prices for a specified number of bars before and after that point.
A pivot low occurs when there are no bars with lower prices for the same number of bars on either side.
The number of bars to the left and right is adjustable via the Pivot Lookback Bars setting, allowing you to define how many bars are used to determine these pivot points.
Key features include:
Pivot Highs and Lows Identification: Automatically marks significant pivot highs and lows based on a user-defined lookback period, helping traders identify potential trend reversals or continuation points.
Prediction Labels: Provides forecasted pivot levels based on historical pivot price and time patterns, with options to show predictions for pivot highs, lows, or any pivot point.
Customizable Table Display: Displays a table summarizing important statistics, such as the average price percentage and the number of bars between pivots, along with the distance and time from the most recent pivot.
Traders can use this tool to map out potential levels of support and resistance based on historical data on pivot points.

Bat Harmonic Pattern [TradingFinder] Bat Chart Indicator🔵 Introduction
The Bat Harmonic Pattern, created by Scott Carney in the 1990s, is a sophisticated tool in technical analysis, used to identify potential reversal points in price movements by leveraging Fibonacci ratios.
This pattern is classified into two primary types: the Bullish Bat Pattern, which signals the end of a downtrend and the beginning of an uptrend, and the Bearish Bat Pattern, which indicates the conclusion of an uptrend and the onset of a downtrend.
🟣 Bullish Bat Pattern
The Bullish Bat Pattern is designed to identify when a downtrend is likely to end and a new uptrend is about to begin. The key feature of this pattern is Point D, which typically aligns near the 88.6% Fibonacci retracement of the XA leg.
This point is considered a strong buy zone. When the price reaches Point D after a significant downtrend, it often indicates a potential reversal, presenting a buying opportunity for traders anticipating the start of an upward movement.
🟣 Bearish Bat Pattern
In contrast, the Bearish Bat Pattern forms when an uptrend is nearing its conclusion. Point D, which also typically aligns near the 88.6% Fibonacci retracement of the XA leg, serves as a critical point for traders.
This point is regarded as a strong sell zone, signaling that the uptrend may be ending, and a downtrend could be imminent. Traders often open short positions when they identify this pattern, aiming to capitalize on the anticipated downward movement.
🔵 How to Use
The Bat Pattern consists of five key points: X, A, B, C, and D, and four waves: XA, AB, BC, and CD. Fibonacci ratios play a crucial role in this pattern, helping traders pinpoint precise entry and exit points. In both the Bullish and Bearish Bat Patterns, the 88.6% retracement of the XA leg is a critical level for identifying potential reversal points.
🟣 Bullish Bat Pattern
Traders typically enter buy positions after Point D forms, expecting the downtrend to end and a new uptrend to start. This point, located near the 88.6% retracement of the XA leg, serves as a reliable buy signal.
🟣 Bearish Bat Pattern
Traders usually open short positions after identifying Point D, expecting the uptrend to end and a downtrend to begin. This point, also near the 88.6% retracement of the XA leg, acts as a valid sell signal.
🟣 Trading Tips for the Bat Pattern
Accurate Fibonacci Point Identification : Accurately identify Points X, A, B, C, and D, and calculate the Fibonacci ratios between these points. Point D should ideally be near the 88.6% retracement of the XA leg.
Signal Confirmation with Other Tools : To enhance the pattern's accuracy, avoid trading solely based on the Bat Pattern.
Risk Management : Always use stop-loss orders. In a Bullish Bat Pattern, place the stop-loss below Point X, and in a Bearish Bat Pattern, above Point X. This helps limit potential losses if the pattern fails.
Wait for Price Movement Confirmation : After identifying Point D, wait for the price to move in the anticipated direction to confirm the pattern's validity before entering a trade.
Set Realistic Profit Targets : Use Fibonacci retracement levels to set realistic profit targets, such as 38.2%, 50%, and 61.8% retracement levels of the CD leg. This strategy helps maximize profits and prevents premature exits.
🔵 Setting
🟣 Logical Setting
ZigZag Pivot Period : You can adjust the period so that the harmonic patterns are adjusted according to the pivot period you want. This factor is the most important parameter in pattern recognition.
Show Valid Forma t: If this parameter is on "On" mode, only patterns will be displayed that they have exact format and no noise can be seen in them. If "Off" is, the patterns displayed that maybe are noisy and do not exactly correspond to the original pattern.
Show Formation Last Pivot Confirm : if Turned on, you can see this ability of patterns when their last pivot is formed. If this feature is off, it will see the patterns as soon as they are formed. The advantage of this option being clear is less formation of fielded patterns, and it is accompanied by the latest pattern seeing and a sharp reduction in reward to risk.
Period of Formation Last Pivot : Using this parameter you can determine that the last pivot is based on Pivot period.
🟣 Genaral Setting
Show : Enter "On" to display the template and "Off" to not display the template.
Color : Enter the desired color to draw the pattern in this parameter.
LineWidth : You can enter the number 1 or numbers higher than one to adjust the thickness of the drawing lines. This number must be an integer and increases with increasing thickness.
LabelSize : You can adjust the size of the labels by using the "size.auto", "size.tiny", "size.smal", "size.normal", "size.large" or "size.huge" entries.
🟣 Alert Setting
Alert : On / Off
Message Frequency : This string parameter defines the announcement frequency. Choices include: "All" (activates the alert every time the function is called), "Once Per Bar" (activates the alert only on the first call within the bar), and "Once Per Bar Close" (the alert is activated only by a call at the last script execution of the real-time bar upon closing). The default setting is "Once per Bar".
Show Alert Time by Time Zone : The date, hour, and minute you receive in alert messages can be based on any time zone you choose. For example, if you want New York time, you should enter "UTC-4". This input is set to the time zone "UTC" by default.
🔵 Conclusion
The Bat Harmonic Pattern is a powerful tool in technical analysis, offering traders the ability to identify critical reversal points using Fibonacci ratios. By recognizing the Bullish and Bearish Bat Patterns, traders can anticipate potential trend reversals and make informed trading decisions.
However, it is essential to combine the Bat Pattern with other technical analysis tools and confirm signals for better trading outcomes. With proper use, this pattern can help traders minimize risk and optimize their entry and exit points in the market.

Market Structure Trailing Stop [BigBeluga]The Market Structure Trailing Stop indicator is an advanced tool for identifying market structure shifts, liquidity sweeps, and potential trend reversals using comprehensive volume analysis. This indicator combines the analysis of market structure pivots (CHoCH - Change of Character) with a sophisticated volume-based trailing stop logic. By evaluating delta volume at key structural points, it allows traders to identify high-probability trend continuations or reversals and manage their trades more effectively.
🔵 KEY FEATURES
● Market Structure Analysis
Pivot-Based Market Structure : The indicator identifies high and lows using user-defined periods, allowing traders to spot key market structure shifts.
Change of Character (CHoCH) : The first significant break of a market structure is marked as a CHoCH, indicating a potential trend reversal.
Break of Structure (BoS) : The indicator highlights subsequent breaks of structure after CHoCH, providing traders with crucial insights into trend strength.
● Advanced Volume Analysis
Delta Volume Evaluation : The indicator calculates delta volume (difference between up and down volume) at each ChoCh or BoS market structure point to assess the strength of the move. Identify Delta Volume from break point back to Pivot
● Trailing Stop Logic
Volume-Validated Trailing Stop : The indicator automatically plots a trailing stop if the delta volume at the UP CHoCH is positive and above the defined threshold and vice versa for Down CHoCH , allowing traders to protect their profits while riding the trend.
Trend Weakness Detection : If a subsequent BoS occurs with negative delta volume or lower volume than the input threshold, the trailing stop disappears, indicating potential trend exhaustion or reversal.
Dynamic Stop Placement : The trailing stop is dynamically adjusted based on market structure and volume, providing traders with a more adaptive stop-loss strategy.
Up Trend Trailing Stop:
Down Trend Trailing Stop:
● Liquidity Sweep Detection
Liquidity Sweep (X) Labels : The indicator identifies liquidity sweeps—points where the price temporarily reverses to sweep liquidity above or below a key level—marked with an “X” label.
Potential Reversal Zones : These liquidity sweeps are potential reversal zones, especially when accompanied by significant delta volume changes, providing traders with early warnings of potential trend reversals.
🔵 HOW TO USE
● Identifying Market Structure Shifts
Change of Character (CHoCH) : When a CHoCH occurs, the indicator calculates the total volume from the high point to the break point. If the delta volume is positive and exceeds the input threshold, a trailing stop is plotted, signaling potential trend continuation.
Break of Structure (BoS) : If BoS is enabled, subsequent breaks of structure are highlighted. If these BoS points show weaker volume or negative delta volume, the trailing stop will disappear, indicating that the trend may be losing strength.
● Using the Trailing Stop Feature
Protecting Profits : Once a CHoCH occurs and the delta volume validates the trend, the trailing stop will be plotted below (or above) the price to protect profits while allowing the trend to run.
Trend Reversal Signals : If the trailing stop disappears due to weak volume at subsequent BoS points, it may signal that the trend is losing momentum, and traders may consider closing their positions or tightening their stops manually.
● Liquidity Sweep Interpretation
Spotting Reversal Zones : Liquidity sweeps, marked with an “X” label, indicate zones where the price has swept liquidity. These areas can serve as potential reversal zones, especially when significant delta volume is observed at these points.
Early Reversal Warnings : Traders can use these liquidity sweep labels as early warnings for potential trend reversals, particularly in conjunction with other technical analysis methods.
🔵 CUSTOMIZATION
Highs and Lows Calculation : Customize the number of bars to the left and right for identifying pivots and market structure shifts.
Volume Threshold : Define the volume threshold to filter out weaker moves and focus on significant market structure shifts.
BoS and Liquidity Sweep Labels : Toggle on or off the BoS and Liquidity Sweep labels to tailor the indicator to your trading style.
Trend Color : Enable or disable trend coloring for candles to visually highlight uptrends and downtrends on the chart.
🔵 CONCLUSION
The Market Structure Trailing Stop indicator combines advanced volume analysis with market structure detection to provide traders with a powerful tool for identifying and managing trends. By leveraging delta volume at key structure points, it helps traders validate trend strength and manage their positions with a dynamic trailing stop strategy. The addition of liquidity sweep detection further enhances its utility, offering early warnings of potential trend reversals. This indicator is ideal for traders who want to gain a deeper understanding of market structure while incorporating volume-based insights into their trading strategies.

Uptrick: SMA Pivot Marker### Uptrick: SMA Pivot Marker (SPM) — Extensive Guide
#### Introduction
The **Uptrick: SMA Pivot Marker (SPM)** is a sophisticated technical analysis tool crafted by Uptrick to help traders interpret market trends and identify key price levels where significant reversals might occur. By integrating the principles of the Simple Moving Average (SMA) with pivot point analysis, the SPM offers a comprehensive approach to understanding market dynamics. This extensive guide explores the purpose, functionality, and practical applications of the SPM, providing an in-depth analysis of its features, settings, and usage across various trading strategies.
#### Purpose of the SPM
The **SMA Pivot Marker (SPM)** aims to enhance trading strategies by offering a dual approach to market analysis:
1. **Trend Identification**:
- **Objective**: To discern the prevailing market direction and guide trading decisions based on the overall trend.
- **Method**: Utilizes the SMA to smooth out price fluctuations, providing a clearer picture of the trend. This helps traders align their trades with the market's direction, increasing the probability of successful trades.
2. **Pivot Point Detection**:
- **Objective**: To identify key levels where the price is likely to reverse, providing potential support and resistance zones.
- **Method**: Calculates and marks pivot highs and lows, which are significant price points where previous trends have reversed. These levels are used to predict future price movements and establish trading strategies.
3. **Trend Change Alerts**:
- **Objective**: To notify traders of potential shifts in market direction, enabling timely adjustments to trading positions.
- **Method**: Detects and highlights crossover and crossunder points of the smoothed line, indicating possible trend changes. This helps traders react promptly to changing market conditions.
#### Detailed Functionality
1. **Smoothing Line Calculation**:
- **Simple Moving Average (SMA)**:
- **Definition**: The SMA is a type of moving average that calculates the average of a security’s price over a specified number of periods. It smooths out price data to filter out short-term fluctuations and highlight the longer-term trend.
- **Calculation**: The SMA is computed by summing the closing prices of the chosen number of periods and then dividing by the number of periods. For example, a 20-period SMA adds the closing prices for the past 20 periods and divides by 20.
- **Purpose**: The SMA helps in identifying the direction of the trend. A rising SMA indicates an uptrend, while a falling SMA indicates a downtrend. This smoothing helps traders to avoid being misled by short-term price noise.
2. **Pivot Points Calculation**:
- **Pivot Highs and Lows**:
- **Definition**: Pivot points are significant price levels where a market trend is likely to reverse. A pivot high is the highest price over a certain period, surrounded by lower prices on both sides, while a pivot low is the lowest price surrounded by higher prices.
- **Calculation**: The SPM calculates pivot points based on a user-defined lookback period. For instance, if the lookback period is set to 3, the indicator will find the highest and lowest prices within the past 3 periods and mark these points.
- **Purpose**: Pivot points are used to identify potential support and resistance levels. Traders often use these levels to set entry and exit points, stop-loss orders, and to gauge market sentiment.
3. **Visualization**:
- **Smoothed Line Plot**:
- **Description**: The smoothed line, calculated using the SMA, is plotted on the chart to provide a visual representation of the trend. This line adjusts its color based on the trend direction, helping traders quickly assess the market condition.
- **Color Coding**: The smoothed line is colored green (upColor) when it is rising, indicating a bullish trend, and red (downColor) when it is falling, indicating a bearish trend. This color-coding helps traders visually differentiate between uptrends and downtrends.
- **Line Width**: The width of the line can be adjusted to improve visibility. A thicker line may be more noticeable, while a thinner line might provide a cleaner look on the chart.
- **Pivot Markers**:
- **Description**: Pivot highs and lows are marked on the chart with lines and labels. These markers help in visually identifying significant price levels.
- **Color and Labels**: Pivot highs are represented with green lines and labels ("H"), while pivot lows are marked with red lines and labels ("L"). This color scheme and labeling make it easy to distinguish between resistance (highs) and support (lows).
4. **Trend Change Detection**:
- **Trend Up**:
- **Detection**: The indicator identifies an upward trend change when the smoothed line crosses above its previous value. This crossover suggests a potential shift from a downtrend to an uptrend.
- **Usage**: Traders can interpret this signal as a potential buying opportunity or an indication to review and possibly adjust their trading positions to align with the new uptrend.
- **Trend Down**:
- **Detection**: A downward trend change is detected when the smoothed line crosses below its previous value. This crossunder indicates a potential shift from an uptrend to a downtrend.
- **Usage**: This signal can be used to consider selling opportunities or to reassess long positions in light of the emerging downtrend.
#### User Inputs
1. **Smoothing Period**:
- **Description**: This input determines the number of periods over which the SMA is calculated. It directly affects the smoothness of the line and the sensitivity of trend detection.
- **Range**: The smoothing period can be set to any integer value greater than or equal to 1. There is no specified upper limit, offering flexibility for various trading styles.
- **Default Value**: The default smoothing period is 20, which is a common choice for medium-term trend analysis.
- **Impact**: A longer smoothing period results in a smoother line, filtering out more noise and highlighting long-term trends. A shorter period makes the line more responsive to recent price changes, which can be useful for short-term trading strategies.
2. **Pivot Lookback**:
- **Description**: This input specifies the number of periods used to calculate the pivot highs and lows. It influences the sensitivity of pivot point detection and the relevance of the identified levels.
- **Range**: The pivot lookback period can be set to any integer value greater than or equal to 1, with no upper limit. Traders can adjust this parameter based on their trading timeframe and preferences.
- **Default Value**: The default lookback period is 3, which provides a balance between detecting significant pivots and avoiding excessive noise.
- **Impact**: A longer lookback period generates more stable pivot points, suitable for identifying long-term support and resistance levels. A shorter lookback period results in more frequent and recent pivot points, useful for intraday trading and quick responses to price changes.
#### Applications for Different Traders
1. **Trend Followers**:
- **Using the SMA**: Trend followers utilize the smoothed line to gauge the direction of the market. By aligning trades with the direction of the SMA, traders can capitalize on sustained trends and improve their chances of success.
- **Trend Change Alerts**: The trend change markers alert trend followers to potential shifts in market direction. These alerts help traders make timely decisions to enter or exit positions, ensuring they stay aligned with the prevailing trend.
2. **Reversal Traders**:
- **Pivot Points**: Reversal traders focus on pivot highs and lows to identify potential reversal points in the market. These points indicate where the market has previously reversed direction, providing potential entry and exit levels for trades.
- **Pivot Markers**: The visual markers for pivot highs and lows serve as clear signals for reversal traders. By monitoring these levels, traders can anticipate price reversals and plan their trades to exploit these opportunities.
3. **Swing Traders**:
- **Combining SMA and Pivot Points**: Swing traders can use the combination of the smoothed line and pivot points to identify medium-term trading opportunities. The smoothed line helps in understanding the broader trend, while pivot points provide specific levels for potential swings.
- **Trend Change Alerts**: Trend change markers help swing traders spot new swing opportunities as the market shifts direction. These markers provide potential entry points for swing trades and help traders adjust their strategies to capitalize on market movements.
4. **Scalpers**:
- **Short-Term Analysis**: Scalpers benefit from the short-term signals provided by the SPM. The smoothed line and pivot points offer insights into rapid price movements, while the trend change markers highlight quick trading opportunities.
- **Pivot Points**: For scalpers, pivot points are particularly useful in identifying key levels where price may reverse within a short time frame. By focusing on these levels, scalpers can plan trades with tight stop-loss orders and capitalize on quick price changes.
#### Implementation and Best Practices
1. **Setting Parameters**:
- **Smoothing Period**: Adjust the smoothing period according to your trading strategy and market conditions. For long-term analysis, use a longer period to filter out noise and highlight broader trends. For short-term trading, a shorter period provides more immediate insights into price movements.
- **Pivot Lookback**: Choose a lookback period that matches your trading timeframe. For intraday trading, a shorter lookback period offers quick identification of recent price levels. For swing trading or long-term strategies, a longer lookback period provides more stable pivot points.
2. **Combining with Other Indicators**:
- **Integration with Technical Tools**: The SPM can be used in conjunction with other technical indicators to enhance trading decisions. For instance, combining the
SPM with indicators like RSI (Relative Strength Index) or MACD (Moving Average Convergence Divergence) can provide additional confirmation for trend signals and pivot points.
- **Support and Resistance**: Integrate the SPM’s pivot points with other support and resistance levels to gain a comprehensive view of market conditions. This combined approach helps in identifying stronger levels of support and resistance, improving trade accuracy.
3. **Backtesting**:
- **Historical Performance**: Conduct backtesting with historical data to evaluate the effectiveness of the SPM. Analyze past performance to fine-tune the smoothing period and pivot lookback settings, ensuring they align with your trading style and market conditions.
- **Scenario Analysis**: Test the SPM under various market scenarios to understand its performance in different conditions. This analysis helps in assessing the reliability of the indicator and making necessary adjustments for diverse market environments.
4. **Customization**:
- **Visual Adjustments**: Customize the appearance of the smoothed line and pivot markers to enhance chart readability and match personal preferences. Clear visual representation of these elements improves the effectiveness of the indicator.
- **Alert Configuration**: Set up alerts for trend changes to receive timely notifications. Alerts help traders act quickly on potential market shifts without constant monitoring, allowing for more efficient trading decisions.
#### Conclusion
The **Uptrick: SMA Pivot Marker (SPM)** is a versatile and powerful technical analysis tool that combines the benefits of the Simple Moving Average with pivot point analysis. By providing insights into market trends, identifying key reversal points, and detecting trend changes, the SPM caters to a wide range of trading strategies, including trend following, reversal trading, swing trading, and scalping.
With its customizable inputs, visual markers, and trend change alerts, the SPM offers traders the flexibility to adapt the indicator to different market conditions and trading styles. Whether used independently or in conjunction with other technical tools, the SPM is designed to enhance trading decision-making and improve overall trading performance. By mastering the use of the SPM, traders can gain a valuable edge in navigating the complexities of financial markets and making more informed trading decisions.

Swing Points [CrossTrade]The "Swing Points" indicator is designed to help identify key swing points, trends, and potential support and resistance areas on a trading chart. This indicator overlays on the price chart and offers several features for enhanced market analysis.
Swing Point Identification: The indicator identifies swing highs and lows (pivot points) over a user-defined period. These points are crucial in understanding market reversals and momentum.
Swing Points Display: Users have the option to visually display these pivot points on the chart. Swing highs are marked with a red "H" above the bar, and swing lows with a green "L" below the bar, aiding in quick visual identification.
Center Line Calculation and Display: A dynamic center line is calculated using the pivot points, providing a baseline that adapts to market movements. The center line's appearance changes based on its position relative to the current price, making it a useful trend indicator.
Support and Resistance Levels: The indicator plots horizontal support and resistance lines based on the swing lows and highs, respectively. This feature helps traders identify potential areas of price consolidation or breakout.
Customization Options: Users can customize the period for swing point calculation and choose whether to display the pivot points, center line, and support/resistance levels.
Alert Features
Swing High Break Alert: An alert is triggered when a new swing high is detected, signaling a potential upward momentum shift.
Swing Low Break Alert: This alert activates when a new swing low is formed, possibly indicating a downward momentum shift.
Center Line Trend Color Change Alert: Alerts users when the center line changes its trend color, which could signify a change in overall market trend direction.

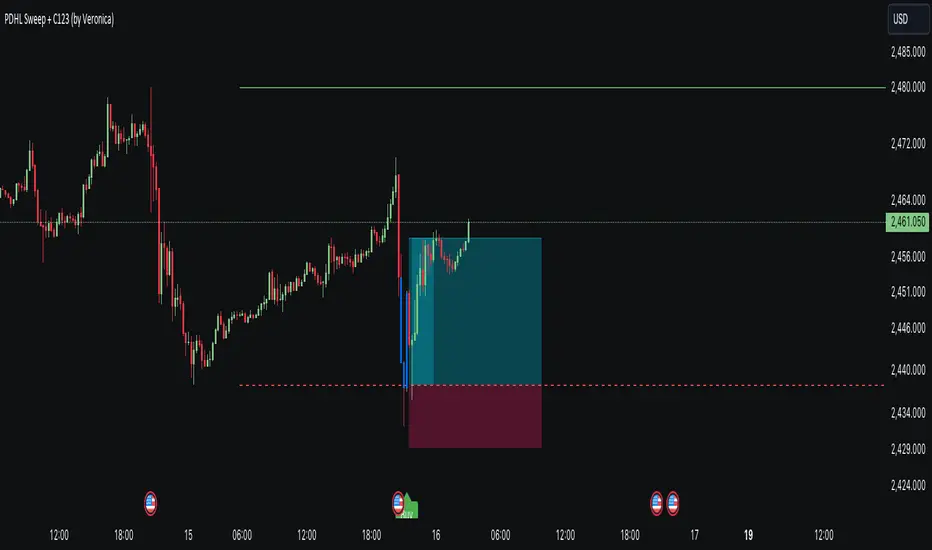
PDHL Sweep + C123 (by Veronica)The "PDHL Sweep + C123" is an indicator to identify potential reversal or continuation patterns in the market by combining key price levels from the previous day with a custom three-candle pattern analysis.
Key Features:
1. Previous Day High/Low Sweep:
The indicator automatically plots horizontal lines marking the previous day's high and low prices.
If the price crosses these key levels, the lines will change from solid to dashed, indicating a potential sweep or breakout.
2. Three-Candle Pattern Analysis:
The indicator identifies specific three-candle patterns that could signal a bullish or bearish setup. The pattern is validated if certain conditions are met, including the relationship between candle bodies and whether the price has crossed the previous day's high or low.
3. Marubozu Condition (Optional):
Users can enable a condition that checks if the Candle 1 and 3 in the pattern is a Marubozu, with a customizable body size percentage.This adds an extra layer of confirmation to the pattern. Default is switch on for both candle 1 and 3.
4. Customizable Alerts:
Users can set alerts for when a "Buy" or "Sell" signal is triggered, allowing them to stay informed of potential trading opportunities without constantly monitoring the charts.
Callout Signals:
When a valid bullish or bearish pattern is identified, the indicator places a "Buy" or "Sell" callout on the chart for clear visual signaling.
5. Customizable colour and text:
Users can customize the color and text of these callouts to suit their preferences.
How to Use:
Bullish Signal: A "Buy" callout will appear when a valid three-candle bullish pattern is detected and the price has crossed below the previous day's low.
Bearish Signal: A "Sell" callout will appear when a valid three-candle bearish pattern is detected and the price has crossed above the previous day's high.
Customize the appearance of the indicator, including line colors, callout colors, and text colors, to match your charting style.
This indicator is ideal for traders who rely on price action and key levels for their trading decisions. It provides clear signals and alerts, helping you stay on top of potential market reversals or continuations.
Historical Swing High-Low Gann IndicatorThe Historical Swing High-Low Gann Indicator is a powerful tool designed to track and visualize key market swing points over time. This indicator identifies significant swing highs and lows within a specified time frame and draws connecting lines between these points, allowing traders to observe the natural ebb and flow of the market.
What sets this indicator apart is its ability to maintain all previously drawn swing lines, creating a comprehensive historical view of market movements. Additionally, the indicator projects Gann-style lines from the most recent swing highs and lows, providing traders with potential future support and resistance levels based on the geometric progression of price action.
Features:
Swing Detection: Automatically detects significant swing highs and lows over a user-defined period (default is 3 hours).
Persistent Historical Lines: Keeps all previously drawn lines, offering a complete visual history of the market's swing points.
Gann-Style Projections: Draws forward-looking lines from the latest swing points to help predict possible future market levels.
Customizable Parameters: Allows users to adjust the swing detection period to suit different trading styles and time frames.
This indicator is ideal for traders who rely on price action, support and resistance levels, and Gann theory for their analysis. Whether used in isolation or as part of a broader strategy, the Historical Swing High-Low Gann Indicator provides valuable insights into the market's behavior over time.
