Customizable Pivot Support/Resistance Zones [MyTradingCoder]This script uses the standard pivot-high/pivot-low built-in methods to identify pivot points on the chart as a base calculation for the zones. Rather than displaying basic lines, it displays a zone from the original pivot point to the closest part of the available body on the same candle. The script comes in handy by utilizing Pinescripts available input.source() function to allow for an external indicators output value to be used within the indicator. Make sure to read all of the TOOLTIPS in the indicator settings menu to get a full understanding of what each setting does, and how it can affect the results that end up on the chart.
By enabling the custom filter in the indicator settings, you will notice you have the ability to filter out zones using an external indicator such as an RSI. Maybe you only want zones to be calculated/drawn when the RSI is overbought or oversold, or maybe you only want the zones to calculate/draw if the Supertrend is green or red. The list of possible filters that you can implement is too many to count. Feel free to play around with the indicator however you like, and configure something that you find to be the most useful for your trading.
On top of everything listed above, the indicator has pre-programmed built-in alertconditions so that you can potentially automate trading, or get a notification to your cell phone when a zone is being touched/broken.
Các điểm Pivot

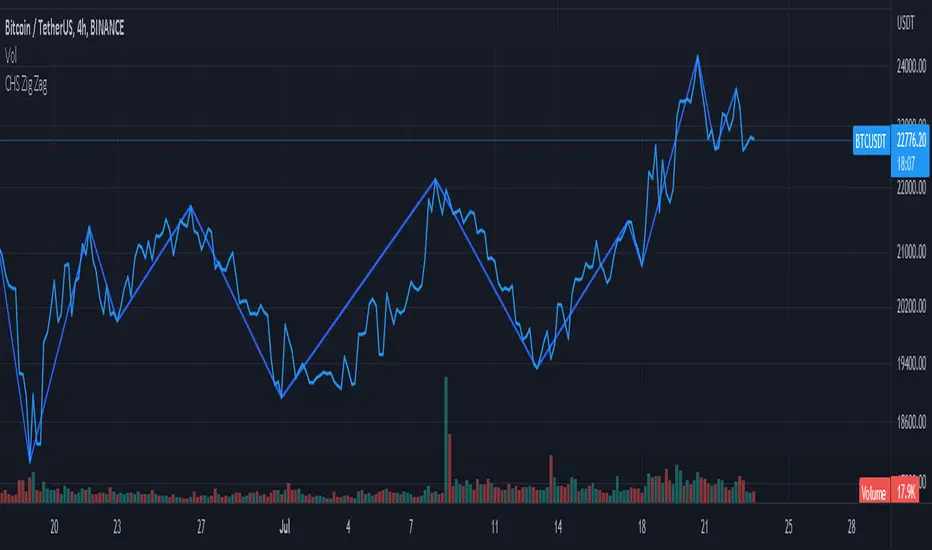
CHS Zig ZagCHS ZigZag stands for Changeable Source ZigZag
The original ZigZag indicator offered by TradingView doesn't have the ability to measure the tips and troughs based on closing prices (line chart), however, this indicator is capable of receiving an input from user that determines the price source used for further calculations.
The default inputs of the original ZigZag indicator have been also changed in order to make it adapt to pivots formed on line chart but users can change arbitrarily.
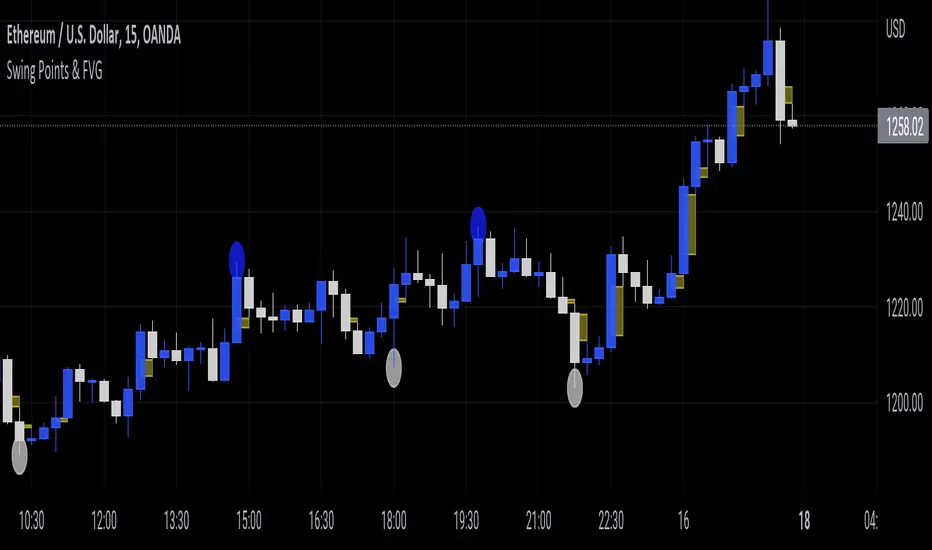
Swing Points & FVGClassic ITH/ITL
Intermediate Term High - High that has short term high on either of it's side.
Intermediate Term Low - Low that has short term low on either of it's side.
FVG
The indicator also marks Fair Value Gaps which is a very important concept in price action trading. FVGs are formed when there is ineffeciency,or imbalance, in the market.
Rebalanced ITH/ITL
Rebalanced ITH - A short term high that rebalanced the ineffeciency in price can be considered as an Intermediate Term High.
Rebalanced ITL - A short term low that rebalanced the ineffeciency in price can be considered as an Intermediate Term Low.
Use the ITH and ITL points marked by the indicator to determine the structure of the market.
Indicator repaints only when it tries to identify the latest ITH/ITL.
Pre Market \ Opening Range High LowGreen vertical lines are showing pre market open and then the opening range as the first hour of market NYSE market open
Pre market high and low are blue lines | intraday opening range high low are in white
Trades are taken in the current direction above | below range breaks with the direction of price action using the moving averages
Price breaking through moving averages and a range is the optimal trade to enter - exit at next range for target - stop loss below the lower | higher moving average depending on short or long
A break above or below the intraday high or low and pre market high or low can give massive profits trailing your stop loss as price runs
Using MA 5 and 12 to filter out entries and exits above or below the ranges short or long is also another strategy to implement
BEST TIME FRAME TO USE IS 5 MINUTE

Price Pivots for NSE Index & F&O StocksPrice Pivots for NSE Index & F&O Stocks
What is this Indicator?
• This indicator calculates the price range a Stock or Index can move in a Day, Week or Month.
Advantages of this Indicator
• This is a Leading indicator, not Dynamic or Repaint.
• Helps to identify the tight range of price movement.
• Can easily identify the Options strike price.
• The levels are more reliable and authentic than Gann Square of 9 Levels.
• Develops a discipline in placing Targets.
Disadvantages of this Indicator
• The indicator is specifically made for National Stock Exchange of India (NSE) listed index and stocks.
• The indicator is calculated only for index NIFTY, BANKNIFTY, FINNIFTY, MIDCPNIFTY and Stocks listed in Futures and Options.
• The indicator shows nothing for other indexes and stocks other than above mentioned.
• The data need to be entered manually.
• The data need to be updated manually when the F&O listed stocks are updated.
Who to use?
Highly beneficial for Day Traders, it can be used for Swing and Positions as well.
What timeframe to use?
• Any timeframe.
• The highlighted levels in Red and Green will not show correct levels in 1 minute timeframe.
• 5min is recommended for Day Traders.
When to use?
• Wait for proper swing to form.
• Recommended to avoid 1st 1 hour or market open, that is 9.15am to 10.15 or 10.30am.
• Within this time a proper swing will be formed.
How to use?
Entry
• Enter when the Price reach closer to the Blue line.
• Enter Long when the Price takes a pullback or breakout at the Red lines.
Exit
• Exit position when the Price reach closer to the Red lines in Long positions.
What are the Lines?
Gray Lines:
• Every lines with price labels are the Strike Prices in the Option Chain from NSE website.
• Price moves from 1 Strike Price level to another.
• The dashed lines are average levels of 2 Strike Prices.
Red & Green Lines:
• The Red and Green Lines will appear only after the first 1 hour.
• The levels are calculated based on the 1st 1 hour.
• Red Lines are important Resistance levels, these are strong Bearish reversal points. It is also a breakout level, this need to be figured out from the past levels, trend, percentage change and consolidation.
• Green Lines are important Support levels, these are strong Bullish reversal points. It is also a breakdown level, this need to be figured out from the past levels, trend, percentage change and consolidation.
What are the Labels?
• First Number: Price of that level.
• Numbers in (): Percentage change and Change of price from LTP(Last Traded Price) to that Level.
How to use?
Entry:
• Enter when price is closer to the Red or Green lines.
• Enter after considering previous Swing and Trend.
• Note the 50% of previous Swing.
• Enter Short when price reverse from each level.
• If 50% of swing and the pivot level is closer it can be a good entry.
Exit:
• Use the logic of Entry, each level can be a target.
• Exit when price is closer to the Red or Green lines.
Indicator Menu
Source
• Custom: Enter the price manually after choosing the Source as Custom to show the Pivots at that price.
• LTP: Pivot is calculated based on Last Traded Price.
• Day Open: Pivot is calculated based on current day opening price.
• PD Close: Pivot is calculated based on previous day closing price.
• PD HL2: Pivot is calculated based on previous day average of High and Low.
• PD HLC3: Pivot is calculated based on previous day average of High, Low and Close.
"Time (IST) (Vertical)"
• This is a marker of every 1 hour.
• Usually major price movement happen between previous day last 1 hour (2:15 pm) to today first 1 hour (10:15 pm).
• Two swings can happen between first 2 hour of current day.
• At the end of the day last 1 hour from 2.15 pm another important movement will happen.
• Usually rest of the time won't show any interesting movement.
To the Users
• Certain symbols may show the levels as a single line. For such symbols choose a different Source or Timeframe from the indicator menu.
• Please inform if any of the Symbol's price levels don't react to the pivots, include the Symbol a well.
• Also inform if you notice any wrong values, errors or abnormal behavior in the indicator.
• Feel free to suggest or adding new features and options.
General Tips
• It is good if Stock trend is same as that of NIFTY trend.
• Lots of indicators creates lots of confusion.
• Keep the chart simple and clean.
• Buy Low and Sell High.
• Master averages or 50%.
• Previous Swing High and Swing Low are crucial.

Fibonacci Pivot Points UltimateA better version of the Fibonacci Pivot Points . I added 100, 138, 161 and 200 support/resistance pivots , lookback function and now you can use daily/weekly/monthly/yearly fibonacci pivot points .

Support and Resistance Multiperiod (Zig Zag Based)Support and Resistance Multiperiod (Zig Zag Based)
What is the indicator?
• The indicator is a multi period (up to 5 lengths) Support and Resistance indicator calculated based on Zig Zag.
Who can use?
Scalpers to Long term investors
What timeframe to use?
• Any timeframe
What are the lines?
• Green lines are Support levels.
• Orange lines are Resistance levels.
How to use?
• Buy Low and Sell High.
• Brighter zones means strong Support or Resistance.
• Weaker zones appear lighter.
• Brighter zones are formed by overlapping of lines from multiple levels of support or resistance.
Indicator Menu
• The indicator can input 5 different Lengths.
• The default settings uses 13, 21, 52, 100 & 200.
• Every option are customizable.

Waddah Attar Weekly Camarilla Pivots [Loxx]Waddah Attar Weekly Camarilla Pivots is an indicator built by Ahmad Waddah Attar that draws weekly Camarilla over lower timeframes.
What are Camarilla pivots?
Camarilla Pivot Points is a math-based price action analysis tool that generates potential intraday support and resistance levels. Similar to classic pivot points, it uses the previous day's high price, low price, and closing price.
Camarilla Pivot Points is a modified version of the classic Pivot Point. Camarilla Pivot Points were introduced in 1989 by Nick Scott, a successful bond trader. The basic idea behind Camarilla Pivot Points is that price has a tendency to revert to its mean until it doesn’t. What makes it different than the classic pivot point formula is the use of Fibonacci numbers in its calculation of pivot levels. Camarilla Pivot Points is a math-based price action analysis tool that generates potential intraday support and resistance levels.
Details
-Used for intraday trading to identify support/resistance levels
-Restricted to timeframes 4 hours and below
-Unlike most versions of Weekly Camarilla Pivots, this version allows you to customize the Fibonacci levels

Pivot Points Standard Higher Timeframe█ OVERVIEW
This indicator was intended as educational purpose only and alternative way to write pine script in version 5 for Pivot Points Standard.
█ CREDITS
Credits to TradingView for original built-in source code.
█ FEATURES
Display price or percentage.
Change color for labels and lines.
█ USAGE EXAMPLES

Relative Strength Index - Divergences - LibertusHello all,
To ease everyone's trading experience I made this script which colors RSI overbought and oversold conditions and as a bonus displays bullish or bearish divergences in last 50 candles (by default, you can change it).
Script is open source, part of code is from Trading View examples. If you have suggestions or you already made some improvements, please report in comment.
Happy trading and good luck!

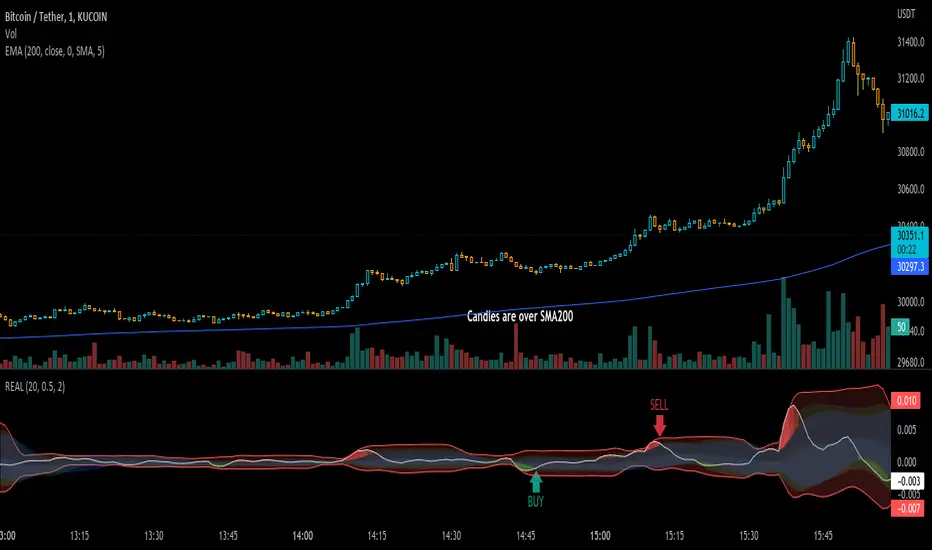
Real IndicatorReal indicator is an indicator to convert ohlcv charts to one oscilator!
there is an effective thing in all charts: "Volume", and I used this thing to mix it by price
Buy: on crossing above to Bollinger-lower-band (on Up-trends)
Sell: on crossing under Bollinger-upper-band (on Down-Trends)
use an SMA-200 to determine trends ;)
Resistance/Support Indicator - FontiramisuIndicator showing resistances and support, based on pivots location
When a new pivot location is near from a resistance/support the latter gains weight.
You can modify multiple parameters :
Nb Max res/sup : Define the number max res/sup to keep in our res/sup history array. The greater it is the older bar index will be taken.
Nb show res/sup : Define the number of res/sup to be drawn.
Min weight shown : Define min res/sup weight to be shown. Weight is used to measure strengh of res/sup.
% range stack : Define price percentage change required to stack a pivot into an existing res/sup. Default is 0.015 = 1.5%.
Pivots are calculated with deviation parameter to validate with more precision.
Fontilab Library is used to code this indicator.

Trend Indicator (dow trending) - FontiramisuIndicator showing pivots and interpret a trend out of it.
Pivots are calculating with deviation parameter to validate with more precision.
Trending moves are calculated according to Dow Theory :
In an uptrend, if the price made a new high, the price must make a new high to confirm the trend, otherwise, it might signal a possible change in the trend.
In an uptrend, if the price made a new low, the price must make a new low to confirm the trend, otherwise, it might signal a possible change in the trend.
The indicator can show 2 trends with 2 different "Pivot Depth"
See indicator parameters.
Tab is display at the bottom right corner to show trend direction and if it is hesitating
Fontilab Library is used to code this indicator

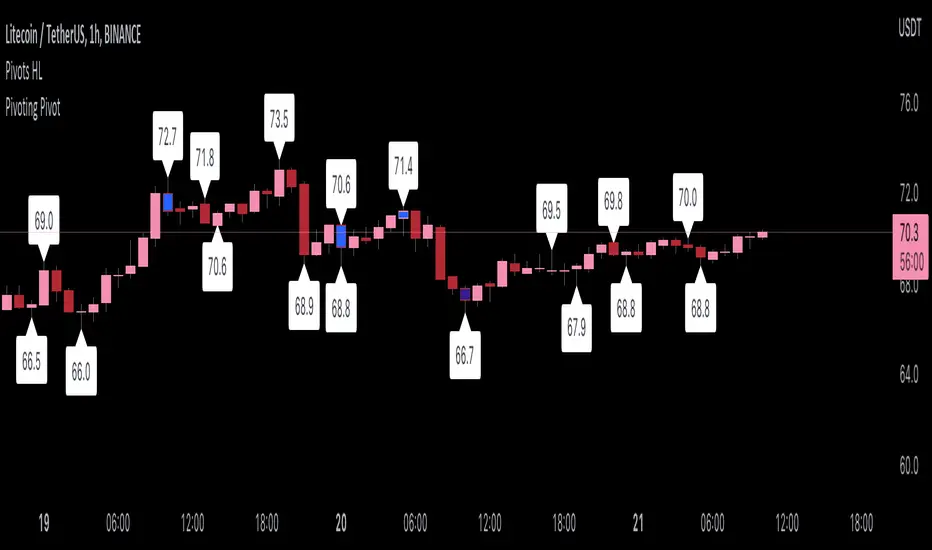
Pivoting PivotMany people use Pivots when conducting analysis, but I don't see many people using pivoting pivots. Pivoting pivots are pivots that don't have any other pivots around them. They can be useful when trying to separate pivot clusters from important pivot points.
The code is calculated by finding the distance between two candlesticks (left check), then calculating the distance between the last pivot and the current candlestick.
On the chart: labels are TradingView's official pivot high and pivot low script, and the blue candle color is my pivoting pivots (both with a look left and look right of 2).
Special thanks to @fikira for helping me with ideas for the calculations!
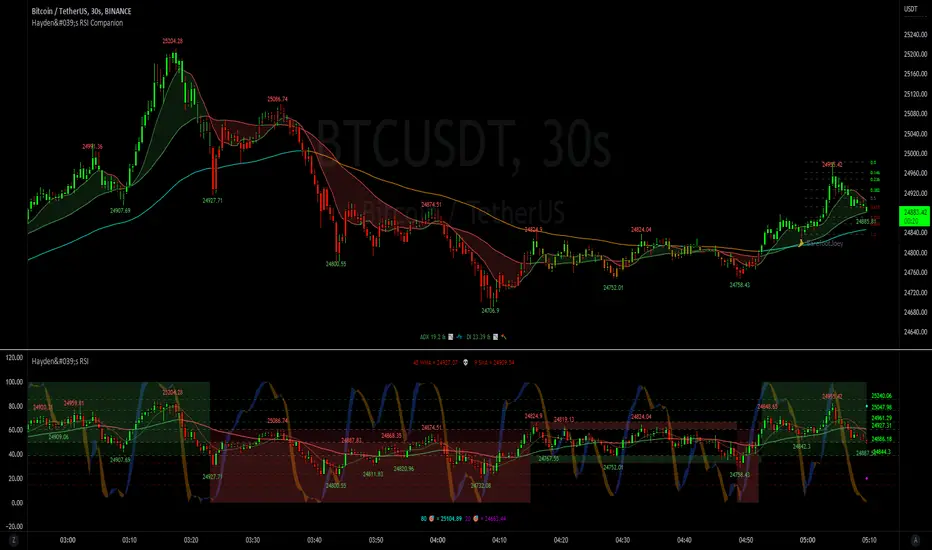
Hayden's Advanced Relative Strength Index (RSI)Preface: I'm just the bartender serving today's freshly blended concoction; I'd like to send a massive THANK YOU to @iFuSiiOnzZ, @Koalafied_3, @LonesomeTheBlue, @LazyBear, @dgtrd and the rest of the PineWizards for the locally-sourced ingredients. I am simply a code editor, not a code author. The book that inspired this indicator is a free download, plus all of the pieces I used were free code from the PineWizards; my hope is that any additional useful development of The Complete RSI trading system also is offered open-source to the community for collaboration.
Features: Fixed & Custom price targeting. Triple trend state detection. Advanced data ticker. Candles, bars, or line RSI . Stochastic of over 20 indicators for adjustable entry/exit signals. Customizable trader watermark. Trend lines for spotting wedges , triangles, pennants , etc. Divergences for spotting potential reversals and Momentum Discrepancy Reversal Point opportunities. RSI percent change and price pivot labels. Gradient bar coloring on-chart.
‼ IMPORTANT: Hover over labels for additional information. Google & read John Hayden's "The Complete RSI" pdf book for comprehensive instructions before attempting to trade with this indicator. Always keep an eye on higher/stronger timeframes.
⚠ DISCLAIMER: DYOR. Not financial advice. Not a trading system. I am not affiliated with TradingView or John Hayden; this is my own personally PineScripted presentation of a suitable RSI to use when trading according to Hayden's rules.
About the Editor: I am a former-FINRA Registered Representative, inventor/patent-holder, and self-taught PineScripter. I mostly code on a v3 Pinescript level so expect heavy scripts that could use some shortening with modern conventions.
Hayden's RSI Rules:
📈 An Uptrend is indicated when:
1. RSI is in the 80 to 40 range
2. The chart shows simple bearish divergence
3. The chart shows Hidden bullish divergence
4. The chart shows Momentum Discrepancy Reversal Up
5. Upside targets being hit
6. 9-bar simple MA is greater than the 45-bar EMA on RSI
7. Counter-trend declines do not exceed 50% of the previous rally
🔮 An Uptrend is in danger when:
1. Longer timeframe fading rally
2. a) Multiple long-term bearish divergences. b) Upside targets not being hit.
3. 9-bar simple MA is less than the 45-bar EMA on RSI
4. Hidden bearish divergence, or simple bullish divergence
5. Deep counter-trend retracements greater than 50%
📉 A Downtrend is indicated when:
1. RSI is in the 60 to 20 range
2. The chart shows simple bullish divergences.
3. The chart shows Hidden bearish divergence
4. The chart shows Momentum Discrepancy Reversal Down
5. Downside targets being hit
6. 9-bar simple MA is less than the 45-bar EMA on RSI
7. Counter-trend rallies do not exceed 50% of the previous decline
🔮 A Downtrend is in danger when:
1. Longer timeframe fading decline
2. a) Multiple long-term bullish divergences. b) Downside targets not being hit.
3. 9-bar simple MA is greater than the 45-bar EMA on RSI
4. Hidden bullish divergence , or simple bearish divergence
5. Steep counter-trend retracements greater than 50%
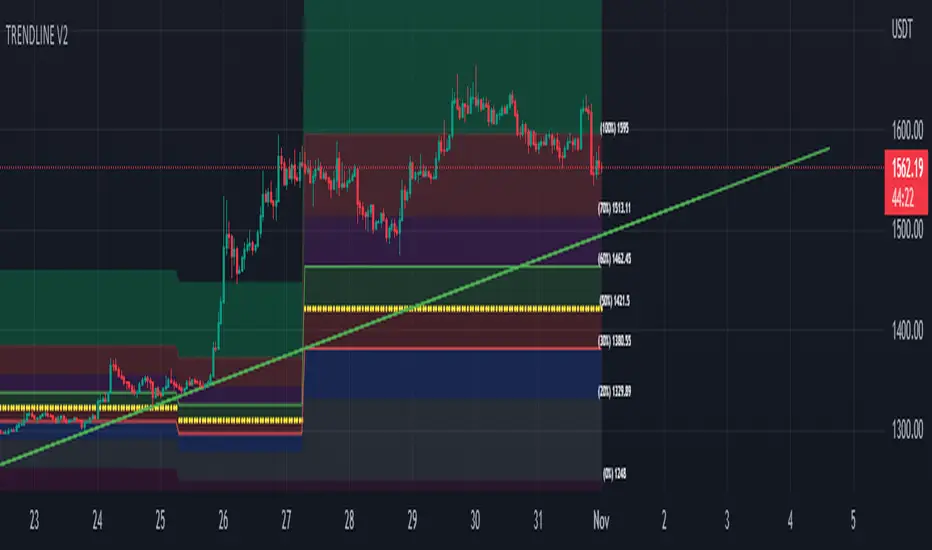
TRENDLINE V1Hello all ...
this is the source trendline of the three pivots
with adjustable resolution and length
function to find a breakout or breakdown
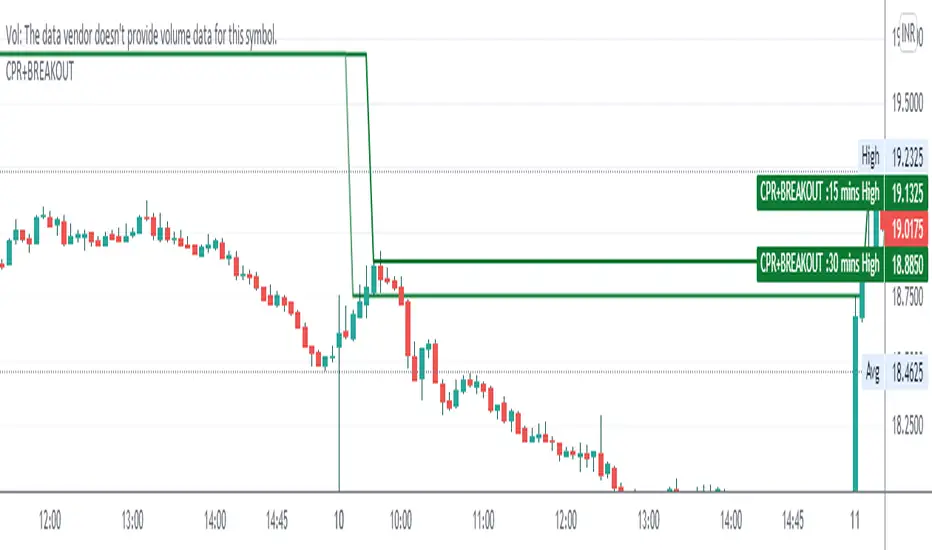
CPR WITH BREAKOUTCPR with 10-30 mins Breakout
This indicator includes CPR with 15-30 mins breakout, resistance, support, previous day low, previous day high, day low and day high etc,
please backtest before use
regards
The Malayali Trader
[CP]Pivot Boss Multi Timeframe CPR Inception with MACD and EMAINTRODUCTION:
This indicator combines multi-timeframe CPR bands with MACD Momentum and EMA trend, all projected on the candlestick chart through a novel visualization.
If you have seen my other indicators on TradingView, you would know that I use floor pivots a lot and “Secrets of a Pivot Boss” is my favorite book. While using floor pivots, time and again I have noticed an interesting price behavior,
Trending moves in price typically start from around the Central Pivot Range (CPR). The CPR could be from ANY timeframe. These moves can easily be caught using simple momentum and trend indicators like MACD and EMA crossovers.
Yes, it is that simple. Follow along to understand how to use this indicator.
INDICATOR SETTINGS:
RANGEBOUND MACD AND EMA MARKINGS:
TradingView limits the max number of labels that can be shown on a chart to 500. Therefore, if you go far back enough, you won't see any markings for the MACD or EMA setups. If you are looking to test the efficacy of this indicator in the past, change the start and end dates to your desired timeframe and then select the ‘Mark MACD and EMA Setups in Range?’ option.
MULTI TIMEFRAME CENTRAL PIVOT RANGE:
Here you can select CPRs and their bands from which timeframes are shown on the chart. I will share my favorite settings later in this description.
CPR CONFIGURATION:
Show CPR Labels: CPRs markings can carry labels, so that you don’t confuse between which line is what. Use this setting to toggle them On/Off.
Show Next Time Period Pivots: Check this option if you want to see the CPR of the next time period. This is typically done to figure out the ’Two Day CPR Relationship’ . Read the book, “Secrets of a Pivot Boss”, to understand more.
EMA TREND:
Show EMA on the Chart: EMAs will be plotted on the chart. Standard stuff.
Mark EMA Crossovers on Chart: EMA crossovers will be marked on the chart in diamond shapes. If you are using EMA crossovers, I recommend setting this option to True.
Rest of the EMA settings are fairly obvious.
MACD MOMENTUM:
Projecting MACD parameters directly on the candlesticks is surely going to give you a new perspective about price action and MACD.
Also, in order to better understand the MACD projections on the chart, you can add a standard MACD indicator on the chart with default settings to figure out what my indicator is actually showing you.
Marking MACD Crossovers on Chart: Marks the MACD signal crossovers on the chart. This visualization was a game changer for me.
Show MACD Histogram on Chart: Projects the complete MACD Histogram in a novel fashion (Try it!). You will be able to visually see the ebbs and flow of momentum in the charts.
Mark MACD Histogram Peaks on Chart: Marks only the MACD peaks instead of the complete histogram. Peaks are a great way to enter an ongoing trend and to play an intraday rangebound market.
Rest of the settings are just the standard settings that you will find in a typical MACD indicator.
ALERTS:
Not shown in the settings panel, but I have added alerts for EMA and MACD Crossovers so that you don’t have to sit in front of the charts or constantly check the price all day long.
If you don’t know how to set alerts in TradingView, then please Google it.
INDICATOR USAGE EXAMPLES:
This indicator can be used in intraday as well as in higher timeframes.
There are quite a few variations possible, I personally prefer to use the EMA crossovers in intraday (5m) and MACD on Daily timeframes.
This is just a matter of personal preference, some people might prefer using EMAs only or MACD only in all timeframes.
Here are my personal settings for the intraday 5-minute timeframe:
Turn on all the CPR pivots starting from Yearly all the way to Daily. You can turn on 6 hourly and 4 hourly as well if you want.
Hourly CPR is mostly used when the price is in a strong trend and you missed the entry and don’t know when to enter. Price will typically experience pullbacks towards the Hourly CPR, before resuming in the direction of the trend. That is your chance to hop onto the bandwagon.
For Intraday, I keep the Bands off. Just a personal preference here.
You can turn ON the Show CPR Labels , if you want.
Turn ON both the options in the EMA TREND section. You would want to see the EMA crossovers marked on the chart as well as the EMAs themselves, as the distance between the two EMAs will give you an idea about the strength of the trend.
Keep rest of the settings in the EMA section as default (you can change the colors if you wish). I keep the same EMAs as the ones kept in the MACD indicator. I like to keep things simple.
In the MACD MOMENTUM section, turn ON Mark MACD Histogram Peaks on Chart and all the other options turned OFF. Leave the other settings as default. By the way, these are the default settings of the standard MACD Indicator.
You can set up EMA Bullcross and Bearcross alarms if you like.
Before checking out the examples, remember one super simple rule:
SOME OF THE BEST TRENDING MOVES IN THE MARKET, BE IT INTRADAY OR OTHERWISE, ORIGINATE IN THE VICINITY OF A LARGER TIMEFRAME PIVOT/CPR.
Look for price settling above/below a pivot, and then a move away from the pivot in any direction is typically a trending move.
You can use hourly pivots or MACD Histogram peaks marked on the chart to enter an existing trend, or add to your positions.
Let’s have a look at a few recent intraday examples from the Crypto, Indian, and US equity markets.
I have added my comments in the charts to make you easily understand what is going on.
Understand that both, moving average crossover and MACD, will give out a lot of signals (chop) every day. But almost 70% of them are going to be fake signals. It is the signals that you get when the price is near a Pivot, that tend to convert into gorgeous trending moves that last.
BTC 5m Charts
NIFTY Futures 5m Charts (good intraday trends are hard to find here, as the market is very efficient)
TSLA 5m Charts
Some important points for using this indicator in higher timeframes:
For higher timeframes, my personal preference is to go with the MACD indicator. I personally find MACD to be lethal on daily and weekly timeframes, if you know how to use it well.
The default settings of the indicator are the settings I use for both, Daily and Weekly, timeframes. Additionally, I turn off the CPR labels.
In theory large trending moves still have a big probability to start near an important pivot level, however, in larger timeframes, trending moves can start from anywhere. They need not start in the vicinity of any important pivot (but they often do!).
Weekly pivots can act as great pullback levels when the price is in strong momentum, when trading on the daily timeframe.
Quarterly Pivots act as great pullback levels when the price is in strong momentum, when trading on the weekly timeframe.
BTC Weekly Chart
BTC Daily Chart
Nifty Weekly Chart
Nifty Daily Chart
NASDAQ Weekly Chart
NASDAQ Daily Chart
FINAL WORDS:
Please understand that I have Cherry Picked the examples to showcase the capability of the indicator and its usage.
DO NOT conflate the accuracy of examples with the accuracy of this indicator.
Biggest catch is the fact that this indicator, like every other indicator out there, will have whipsaws. Some I have also marked in the example charts.
You need to come up with your own technique to avoid whipsaws, one technique I have shared here…… big moves typically start near pivots.
Work on avoiding whipsaws and finding you own edge in the markets.
If you really want to learn how to use Pivots, read the book ’Secrets of a Pivot Boss’ . This book can change your life.

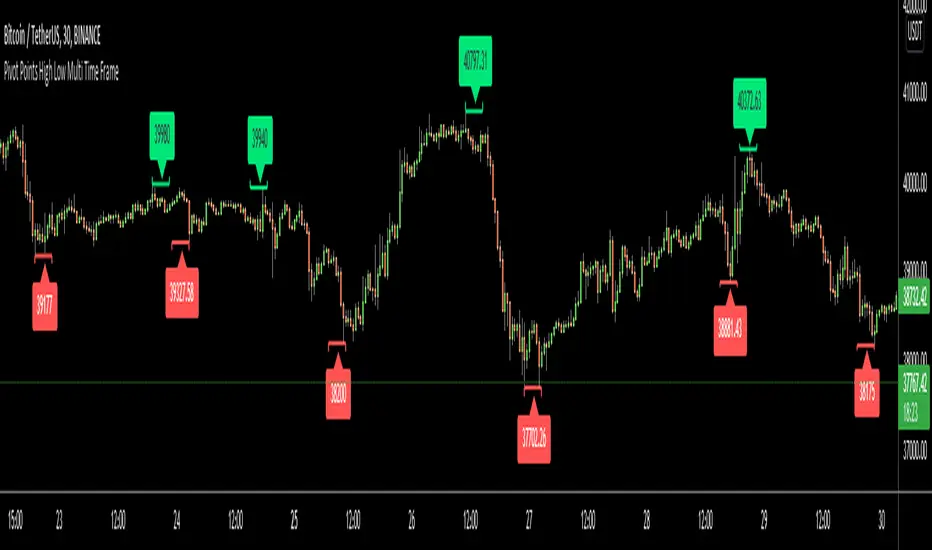
Pivot Points High Low Multi Time FrameHello All,
There are built-in and published Pivot Point High Low indicators in Public Library but as far as I see none of them is for Higher Time frames. so I decided to write & publish this script. I hope it would be useful while trading or developing your own scripts. I also did this to use in one of my future projects (we will see it in a few weeks/months ;) ).
I tried to make all settings optional, so you can play with them as you wish.
P.S. There is no control mechanism if the chart time frame is lower than the time frame in the options. So you better set higher time frame in the options than the chart time frame.
Enjoy!
CPR with Developing Pivot RangeThis Developing Pivot Range(DPR) made by Saravanan_Ragavan based on Pivot Boss Developing Pivot Range Concept. This indicator will show how the CPR is developing during the day. Also it shows how trend developing. range fills with green and widening in up trend, wise versa range fills with red and widening in down trend.
Pivot Boss described as following about this indicator:
The Developing Pivot Range (DPR) indicator dynamically calculates the central pivot range in real time as new data enters the market bar by bar. Essentially, this indicator allows you to see the “meat of the market” as the day’s trading activity is taking place. More importantly, however, the closing values for the indicator tell you where the central pivot range will be located for the following session, which paves the way for analyzing extremely important two-day pivot range relationships and key width characteristics. Having this information in advance allows us to prepare properly for the
upcoming session.
Note: Today Session end DPR become Tomorrow's CPR.
Hope this Helps you!

RSI Local TrendA simple indicator using two RSIs.
Conditions for buy:
RSI(slow) < RSI(fast) and RSI(slow) < long_trigger
Conditions for sell:
RSI(slow) > RSI(fast) and RSI(slow) > short_trigger
It is recommended to use in small timeframes for scalping.
Recommended settings:
slow = 3
fast = 14
long_trigger = 30
short_trigger = 70
In markets where there is very high volatility, it is recommended to change the trigger parameters:
long_trigger = 20
short_trigger = 80

3EMA + Boullinger + PIVOTTRES EMAS + BANDAS DE BOLLINGER + PIVOTE
INDICADOR 1: TRES EMAS (MEDIA MOVIL EXPONENCIAL)
Con este indicador puede visualizar el promedio de precios con mayor peso a los datos mas recientes.
Se calculan y dibujan tres medias móviles exponenciales: 8, 20 y 200 últimas velas.
-Rápida EMA1 = 8
-Media EMA2 = 20
-Lenta EMA 3 = 200
INDICADOR 2: BANDAS DE BOLLINGER
Con este indicador podrá ver la fuerza y la tendencia del mercado, es decir la mide la volatilidad del precio del activo.
Si el precio sobrepasa la banda superior, el activo está sobrecomprado.
Si el precio sobrepasa la banda inferior, el activo está sobrevendido.
Longitud tendencia - BASE = 20, paso = 1
Desviación Estándar - Multiplicador = 2, paso = 0.2
INDICADOR 3: PIVOTE
Este indicador etiqueta los puntos donde el precio es mínimo y máximo, en un rango de velas determinado en el parámetro "Distancia para el Pivote".
Estos 3 indicadores sirven para todo tipo de activos: FOREX, CRIPTO, CFD´s, ETC.
------------------------------------------------------------------------------------------------------------------
THREE EMAS + BOLLINGER BANDS + PIVOT
INDICATOR 1: THREE EMAS ( EXPONENTIAL MOVING AVERAGE )
With this indicator you can visualize the average of prices with greater weight to the most recent data.
Three exponential moving averages are calculated and drawn: 4, 20 and 200 last candles.
-Fast EMA1 = 8
-Average EMA2 = 20
-Slow EMA 3 = 200
INDICATOR 2: BOLLINGER BANDS
With this indicator you can see the strength and trend of the market, that is, it is measured by the volatility of the asset price.
If the price goes above the upper band, the asset is overbought.
If the price goes above the lower band, the asset is oversold.
Trend length - BASE = 20, step = 1
Standard Deviation - Multiplier = 2, step = 0.2
INDICATOR 3: PIVOT
This indicator labels the points where the price is minimum and maximum, in a range of candles determined in the parameter "Distance to Pivot".
These 3 indicators are used for all types of assets: FOREX, CRYPT, CFD's, ETC.
