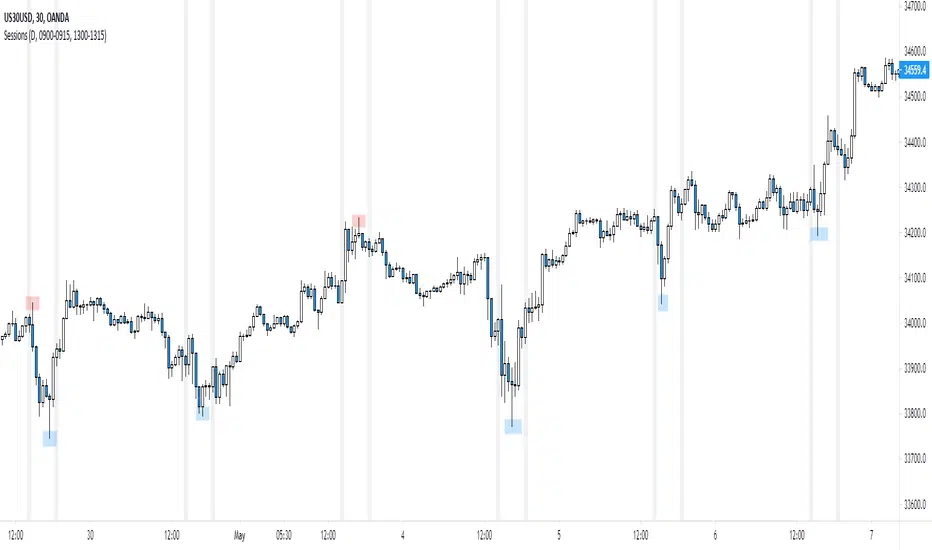
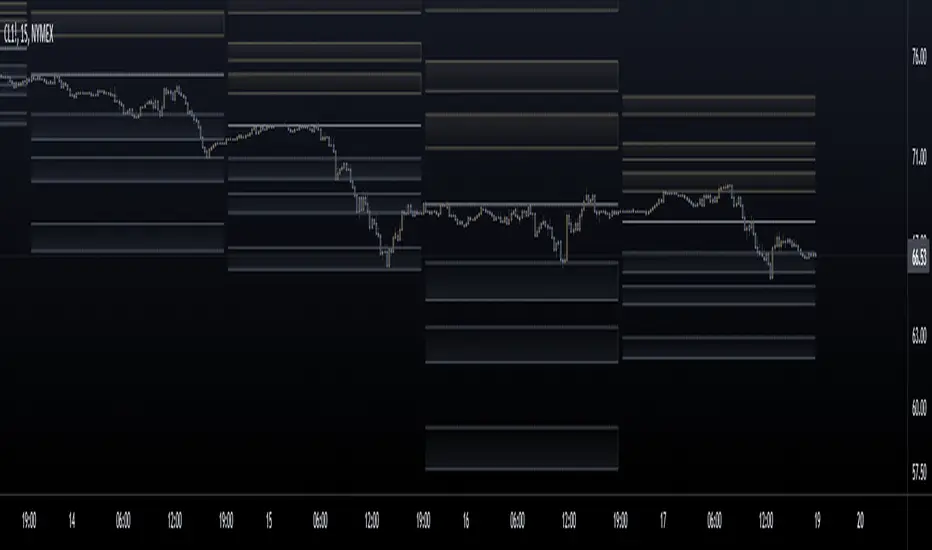
Trend Key PointsEach trend has its high and low key points that are important in the next prices. Sometimes it's hard to find out the keys with a naked eye, so I tried to code a simple indicator to marking these points also, as a bonus, to draw support and resistance lines from previous critical pivot points.
Let me explain the details with a downtrend. If we consider the previous trend, each downtrend starts with a HH and end with a LL. There are always many tries between that HH and LL to turn the trend up. This indicator counts that inner attempts. The higher the number of attempts, the more important move has been started from the beginning (HH). These numbers take their final form when the trend ends and are included in the label at the beginning of each trend.
Key points with 3 and more inner tries are consider as critical point by default but It's alterable and you can change it as you want. The indicator draws lines from critical points too, so you can use that lines as support and resistance in next candles.
Likewise, there are marks below inner LLs and above inner HHs.
This indicator idea is entirely my own and is a product I've really thought about, AND you have allowed to use and share it anywhere to anyone. I did my best to make it useful, even so I am open to any improvement. If you have an idea or a suggestion, don't forget to leave a comment.
Các điểm Pivot

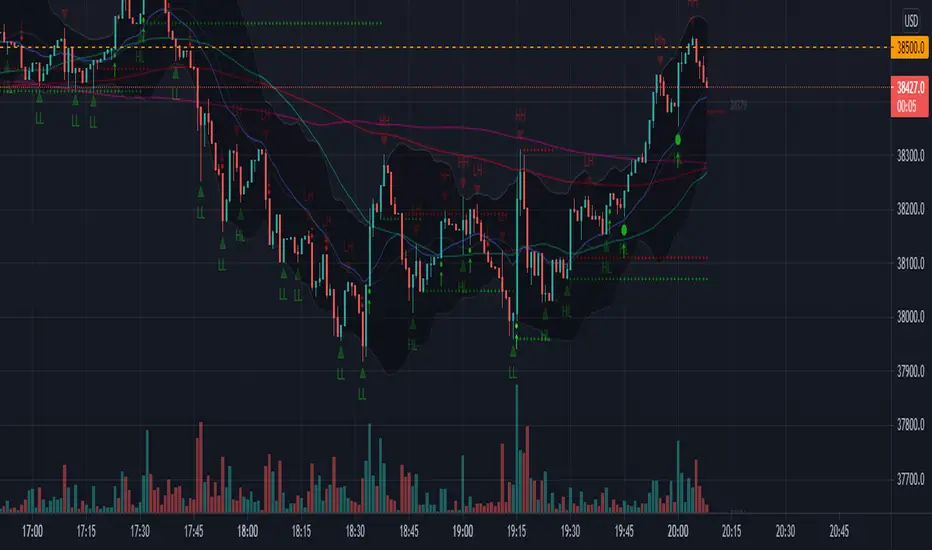
FullPac4Trader (I.Denis)The script combines the three most important indicators on the chart.
1. A set of six moving averages ( EMA and SMA ), which can be turned on and adjusted at your discretion.
2. Indication of support and resistance levels, calculated according to the Bollinger scheme.
3. Pivot Point and the nearest goals using the Floor method with the possibility of selecting a time period.
The script version is v.1 (beta)
The development of this script will continue. Feedback and suggestions are welcome.
Martyv Auto Fib Retracement with Logarithmic SupportSimple & easy auto-fib levels. Took the out-of-the-box version provided by TradingView and added Logarithmic support and a nicer palette, and made the controls a bit nicer to use (in my opinion lol). Enjoy.

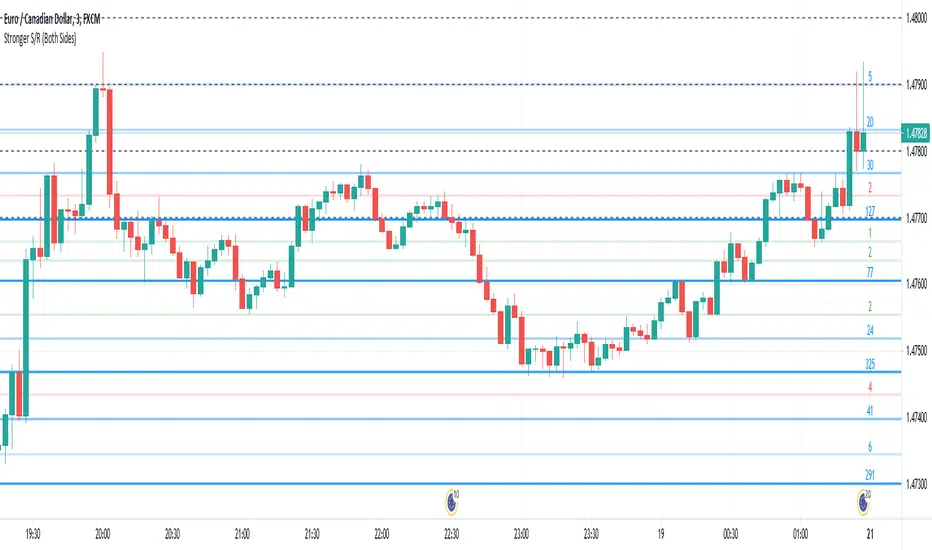
Stronger Classical Support/Resistance + Round LevelsI wrote some Support/Resistance scripts before this. In this new script, I implemented the logic of the code from the scratch, so it's very different from my previous S/R indicators and I think it's more advanced, accurate and efficient.
As the result it could do the followings for now:
- Draw more strong classical resistance/support levels by checking previous direction changes of the chart as far as Pine technically allows
- Colorize the levels based on the counted points of retracement/pullback (The darker the color is, the stronger the level is.)
- Show the number of reactions to each level
- Change the color of each level based on its main role as support, resistance or both
- Draw close round levels to current price for Forex pairs
I suggest all users of my previous S/R indicators to try this one.
Feel free to send me any issue or opinion!
Wide BarsSimple scripts show the wide range bars within in the look back period, visualizing the bigger momentum.
Added four exponential moving averages which define the trend of the instrument.
Wide range candles in the direction of overall trend on higher timeframes; give confluence of higher participation in the same direction.
Note : Decent volume above the average volume with wide range candle adds more value.

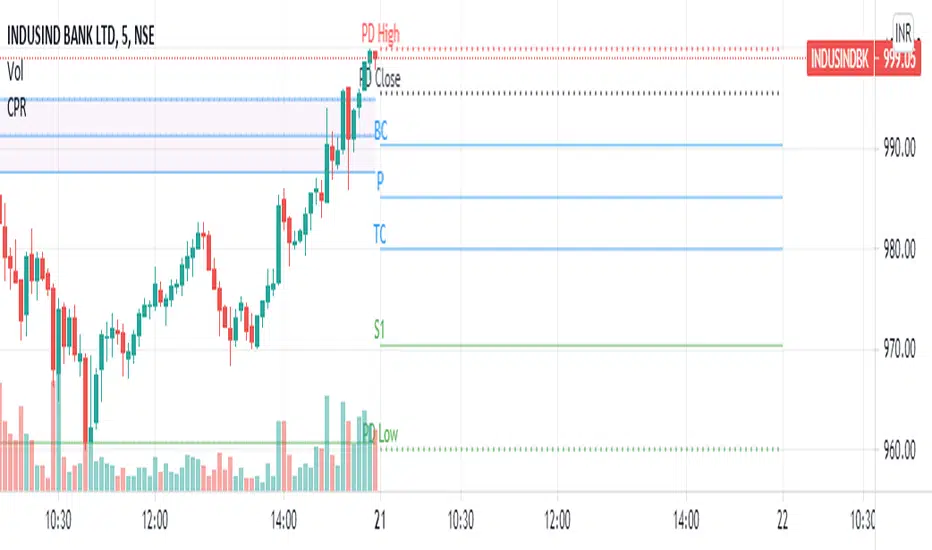
CPR SutradingA simple CPR indicator which plots pivot line, bottom cpr, top cpr, supports , resistances along with previous day high, low and close.
2 Dimensional Array using one floating point entry This is an attempt to create a two dimensional floating point array from the pine single dimension array.
It enables some useful array functions like sorting, when you are trying to keep track of price and location in time or bars and you would like to sort the array.
Other array functions on this array will not work, like average and other statistical functions - they will provide bad results. I would suggest continuing to use a single dimensional array for each element where that kind of array function is required.
I wrote this simply as a mean of using the sort functions when I had to sort price and try to keep the bar location or time in synch.
Other array functions could be written to manipulate this kind of array, leave that to others. The goal here was to avoid using for loops which would be a performance impact on large arrays.
The basic concept is to create one floating point number from two, put that into an array, and then be able to pull the compound value out and parse out the individual components.
I imagine it could also accommodate a 3 or 4 dimensional array with some work, as long as you had some idea of how many digits are consumed by each element. For example you may be interested in storing price, RSI, x_loc values and then be able to sort and parse them out.
Zig Lines with Percent & ValueOverview, Features, and Usage:
The Zig Lines with Percent & Value is an indicator that highlights the highest and lowest points of the market from pivot points and zigzag lines based on the ZigZag Period setting. By a default value of 13 for the ZigZag Period this works well on Bitcoin or other alt coins on the 1 hour or higher timeframe charts.
What makes this indicator unique is that it draws a green line to signify an uptrend or a red line to signify a down trend. It will also show the percent difference between the previous point/line, for example: If you see a -negative percentage point with a red line drawn to it, then you are looking at a low pivot point and then as the green line is drawn to a +positive percentage value the percentage you see is the difference between the two points. This is great to see a trend reversal as you can look at previous pivot points and notice about how far the price moves before it changes direction (trend reversal).
There is an invisible EMA line that is used to assist with coloring the negative vs positive values. The value above or below the percentage is the lowest or highest price at that pivot point . The display of the price at the pivot point depends on your ZigZag Period setting and the timeframe of your chart.
Added Bollinger Bands as it fits perfectly with the visuals of the Zig Lines & Pivots.
Usage of Bollinger Bands:
~As the price or candle gets close to the top or bottom of the Bollinger band it can give you a better confirmation that the pivot location is at it's final place, and the trend is more likely to switch directions.
It’s important to know this indicator should not be used for alerts of any type it does repaint as the green or red line is drawing based on live chart data and it can change depending on the direction of the market. This is a great visual tool for trend analysis or to be used with other indicators as a confirmation for a possible good entry or exit position.
Credits ( and consent to use ):
Credits go to user LonesomeTheBlue for creation of this 'Double Zig Zag with HHLL' script.
The addition of the Value above/below the Percentages is from user Noldo and that script is found here:
The Bollinger Bands setup was suggested by user countseven12 and his script that uses the same BB setup is found here:
References:
1. Chen, James. (2021 March 15). Zig Zag Indicator . Received from http: www.investopedia.com
2. Mitchell, Cory. (2021 April 30). Pivot Points . Received from http: www.investopedia.com

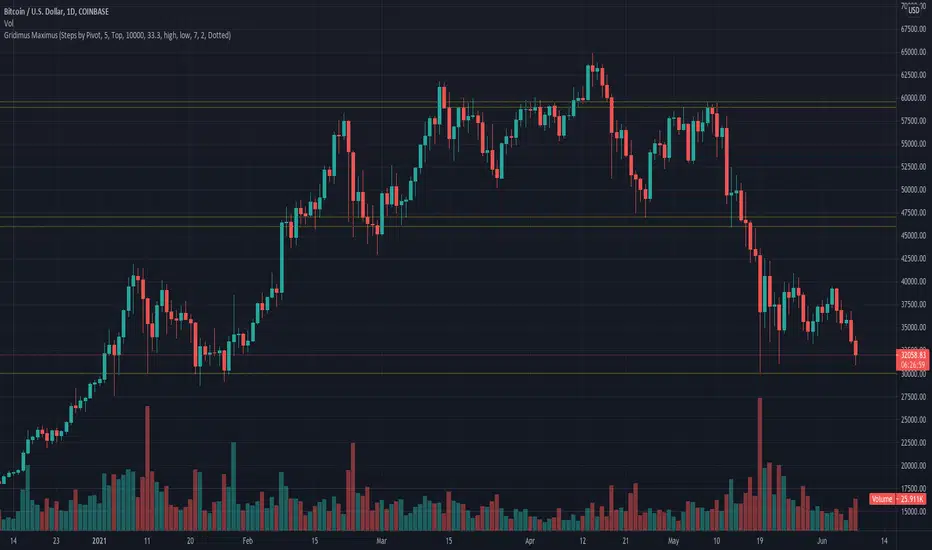
Gridimus MaximusGridimus Maximus draws N grid lines stepping by price or percent in chosen direction from set price, or draws N grid lines stepping by pivots.
The queue function method used is adapted from an example provided on the PineCoders website, much gratitude to LucF for this gem!
To prevent grid lines out of range from causing chart to rescale right click on chart's price column and enable Scale Price Chart Only.
Pictured example above is using Type Of Increment: Steps By Pivot, Number Of Steps: 5.
Pictured example below is using Type Of Increment: Steps By Price, Number Of Steps: 6, Starts From Price: $10k, Steps By Percent Or Price: $10k.
Pictured example below is using Type Of Increment: Steps By Percent, Number Of Steps: 7, Starts From Price: $10k, Steps By Percent Or Price: 33%.
NOTICE: This is an example script and not meant to be used as an actual strategy. By using this script or any portion thereof, you acknowledge that you have read and understood that this is for research purposes only and I am not responsible for any financial losses you may incur by using this script!
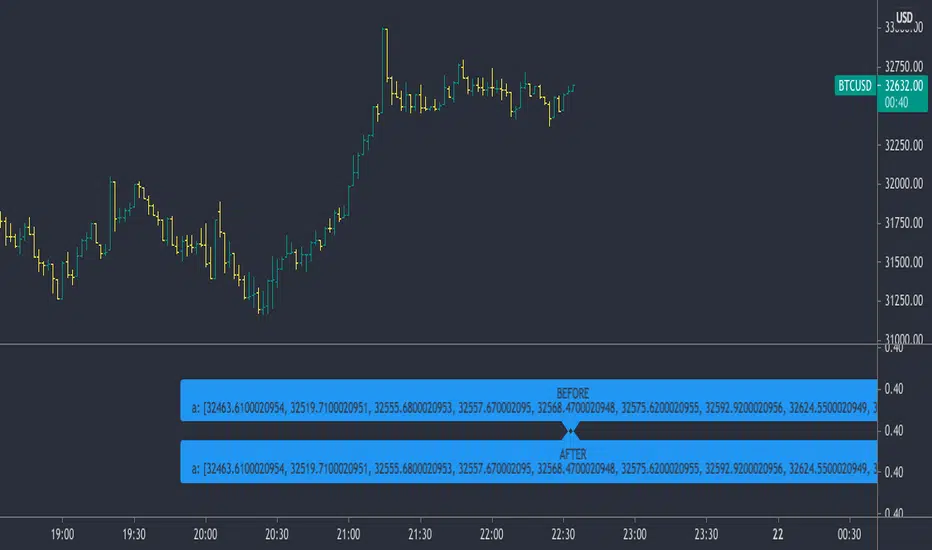
Logging in Pine ScriptI'm building quite a lot of pretty complicated indicators/strategies in Pine Script. Quite often they don't work from the 1 try so I have to debug them heavily.
In Pine Script there are no fancy debuggers so you have to be creative. You can plot values on your screens, check them in the data window, etc.
If you want to display some textual information, you can plot some info as labels on the screen.
It's not the most convenient way, so with the appearance of tables in Pine Script, I decided to implement a custom logger that will allow me to track some useful information about my indicator over time.
Tables work much better for this kind of thing than labels. They're attached to your screen, you can nicely scale them and you can style them much better.
The idea behind it is very simple. I used few arrays to store the message, bar number, timestamp, and type of the message (you can color messages depend on the type for example).
There is a function log_msg that just append new messages to these arrays.
In the end, for the last bar, I create the table and display the last X messages in it.
In parameters, you can show/hide the entire journal, change the number of messages displayed and choose an offset. With offset, you can basically scroll through the history of messages.
Currently, I implemented 3 types of messages, and I color messages according to these types:
Message - gray
Warning - yellow
Error - red
Of course, it's a pretty simple example, you can create a much fancier way of styling your logs.
What do you think about it? Is it useful for you? What do you use to debug code in Pine Script?
Disclaimer
Please remember that past performance may not be indicative of future results.
Due to various factors, including changing market conditions, the strategy may no longer perform as good as in historical backtesting.
This post and the script don’t provide any financial advice.

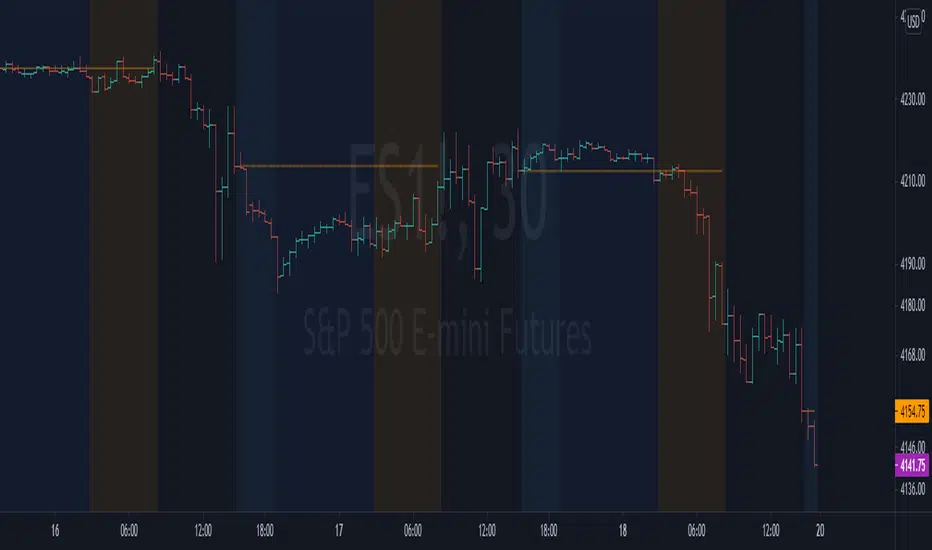
NYSE extended session backgroundThis script adds background to the chart to highlight different time areas in any chart.
The time areas are in relation to the open/close time of NYSE , both regular and extended session.
The background colors are the following by default:
NO COLOR : NYSE is open
DARK BLUE : NYSE is closed
LIGHT BLUE : NYSE post market session
ORANGE : NYSE pre market session
In addition, previous day close price line is shown during extended and closed sessions (orange line).
This script is useful to visualize any chart in relation to the NYSE timetable.
MTF Trend WidgetThis indicator identifies trends in multiple higher timeframes (D, W, M) and shows them in a widget off to the right of the chart.
It's meant to be used as an alternative filter for "trading with the trend." Typically people use moving averages of varying lengths for this (i.e. if over 200 MA it's an uptrend, etc.), but I wanted to see if it might be more effective to see if the higher timeframes were actually trending or not in a certain direction.
For the purposes of this indicator, an uptrend is defined as higher highs and higher lows. So if currently in a downtrend and the highs are broken, the indicator will flip to an uptrend because now we have a higher high. Vice versa for downtrends.
The user can choose the lookback period for defining these highs/lows (the pivot points). A smaller lookback number will give you more frequent pivot points.
The user can toggle on visibility of all historical pivot points to make sure the frequency and placement of the swing highs/lows is to their liking.
The user can show the support/resistance lines of those most recent swing high/low points on the multiple timeframes as well.
When these lines are breached, that is when the trends change, so you can see if you are close to changing any longer term trends.
My hope is that this gives people a quick glance at the overall trend without having to cycle through different timeframes.

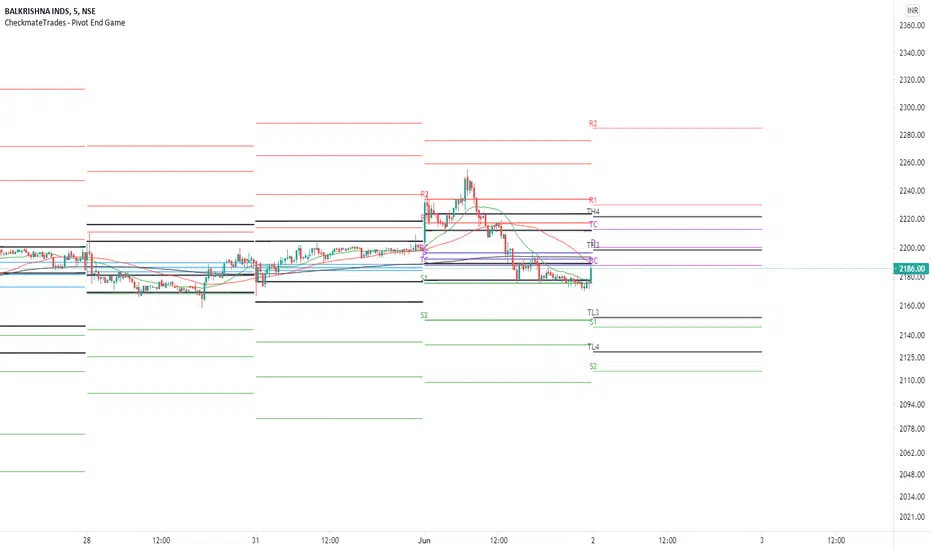
CheckmateTrades - Pivots End GameThis indicator is based on the Pivot study. Traders will be able to plot CPR, Standard floor pivots as well as Camarilla Pivots on multiple timeframes.
Why pivots from multiple timeframes are relevant and included in this one indicator?
We can analyse pivots on multiple timeframes for different trading setups. As in, Daily floor pivots are best suited for analysing the market trend for Day trading. Similarly, Weekly and Monthly floor pivots can be analysed for Swing and positional trading entries. Whereas yearly pivot is best suited for trend analysis for investment purpose.
What is the relevance of plotting tomorrow's pivot level in advance?
Pivot are calculated based on the price happened on a previous day. And hence trader can plot tomorrow pivots in advance to shortlist stocks for tomorrow's trading session.
TimeFrames Available to traders are –
1. Daily
2. Weekly
3. Monthly
A) Daily Pivots
Present Day –
1. Trader can plot Daily CPR
2. Trader can plot Daily R1, R2, R3 and R4 pivot resistance levels
3. Trader can plot Daily S1, S2, S3 and S4 pivot support levels
4. Trader can plot Daily Camarilla levels
Future Day –
1. Trader can plot Tomorrow CPR
2. Trader can plot Tomorrow R1, R2, R3 and R4 pivot resistance levels
3. Trader can plot Tomorrow S1, S2, S3 and S4 pivot support levels
4. Trader can plot Tomorrow Camarilla levels
5. Previous Day High and Low
B) Weekly Pivots
Present Week –
1. Trader can plot Present week CPR
2. Trader can plot Present week R1, R2, R3 and R4 pivot resistance levels
3. Trader can plot Present week S1, S2, S3 and S4 pivot support levels
4. Trader can plot Present week Camarilla levels
Next Week –
1. Trader can plot Next week CPR
2. Trader can plot Next week R1, R2, R3 and R4 pivot resistance levels
3. Trader can plot Next week S1, S2, S3 and S4 pivot support levels
4. Trader can plot Next week Camarilla levels
5. Previous Week High and Low
C) Monthly Pivots
Present Month –
1. Trader can plot Present Month CPR
2. Trader can plot Present Month R1, R2, R3 and R4 pivot resistance levels
3. Trader can plot Present Month S1, S2, S3 and S4 pivot support levels
4. Trader can plot Present Month Camarilla levels
Next Month –
1. Trader can plot Next Month CPR
2. Trader can plot Next Month R1, R2, R3 and R4 pivot resistance levels
3. Trader can plot Next Month S1, S2, S3 and S4 pivot support levels
4. Trader can plot Next Month Camarilla levels
5. Previous Month High and Low
Moreover, I have also included SMA (Simple moving averages) study in this indicator. Trader can add 20,50 & 200 SMA on there charts.
Why is it relevant? Trader can get a visual confirmation of an up-trending or an down-trending move by looking at rising or falling 20 & 50 SMA respectively
Usually in an uptrending stocks. 20 & 50 SMA will move in parallel to each other and will rise upwards. Price will tend to trade above the 20 SMA and 20 SMA will continue to act as a support.
Pivot boxes [LM]Hello traders,
let me intoduce you pivot boxes. New features of pinescript that allows to render boxes enabled to highlight pivot zone. Range high or low is defined by pivot high or low and rangeLow and RangeHigh are defined by close of following candle.
It has two settings that you can change at your will, it also enables hide/show particular pivot setting
Hope you will enjoy as I enjoyed to write it.
Lukas

Example - HTF Step InterpolationAbout this script:
This example aims to highlight an alternative way to view HTF data by providing basic interpolation functionality.
This script does not aim to provide use in itself as an indicator or strategy.
Reason for study:
Educational Purposes Only

Fibonacci Pivot ZonesFibonacci Pivot Zones make use of the average price between the high, low & close of the previous session, while adding deviations based on Fibonacci numbers to form support and resistance zones, which can be used as targets for intraday and swing trading.
You can select the timeframe for the zones, for example 12 hour pivots to trade in 15m timeframe, or even monthly pivots to trade on the daily timeframe.
You can choose the different fibonacci levels on the menu, by default these are:
0.382
0.618
0.782
1
Enjoy!
MultiPrice AlertThis is an alert script using Pinescript version 4. This enables one to set 5 alerts (1 StopLoss, 4 Targets), on 3 different symbols, at using a single alert in the UI.
Every visible line will only appear on the symbols that are selected. After setting targets when making an alert, select this indicator as a condition. Change the name to whatever you want, usually the names of the set of tickers.
The Alert message is dyanmic showing which Symbol with each type of alert, at whatever price.
Ability to disable the targets + symbols.
Alerts work by Stop Loss crossing under price and Targets Cross Over. Enabling the "Short" Targets reverses this.
The line that is being displayed is actually the price of the asset being moved over x number of bars. I have not found a way to plot a traditional horizontal line, as the code for it uses a fixed price.
As it being a user input, it is a variable. Any help with this would be appreicated.
Alerts are set to once per bar.
Known bug that sometimes if the prices that you set are inside the current candle stick, then your alert will immeaditally fire, either change the timeframe or let it fire and wait fo
After a target is hit, I reccomend setting the alert to 0 and REMAKING the alert. You MUST REMAKE THE ALERT AFTER ANY CHANGES. This script WILL NOT CHANGE ALERTS AS YOU CHANGE SETTINGS.
TradingView Alerts are not this smart , at least I haven't found a way to do this yet.

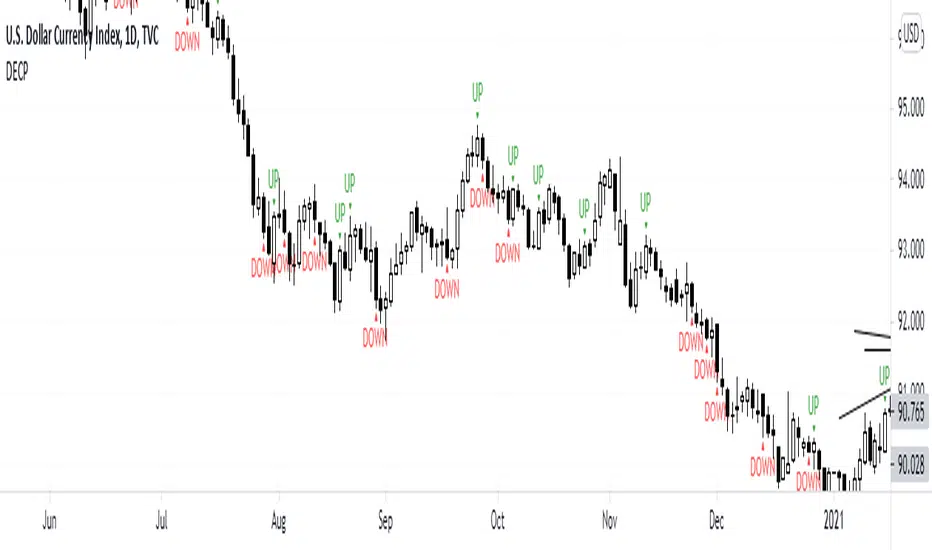
DECPDECP is simple and easy to use!
It detects bullish and bearish engulfing candlestick patterns.
After detecting the patterns I've said, it mentions that the pattern is going to continue its direction to up or down.
But remember candlestick patterns don't determine targets and it's possible that predicted directions fail.
So use it carefully and enjoy it!
WattageSimple plot script for ranges from prior day closed based on Brian Watts talks.
Should work on any timeframe. For example, if 5m the ranges will still be for the prior day.
Edit based on daily ranges of whatever symbol. Change the ranges as you see fit.
It is interesting if you turn on prior day close for verification and current day high/low in the chart settings.
Meant as open source for you to do what you please.
Thank you Brian Watt.
Fractal lines multi time framePlot lines using last two William's fractals to find trends, it supports different resolutions and alerts

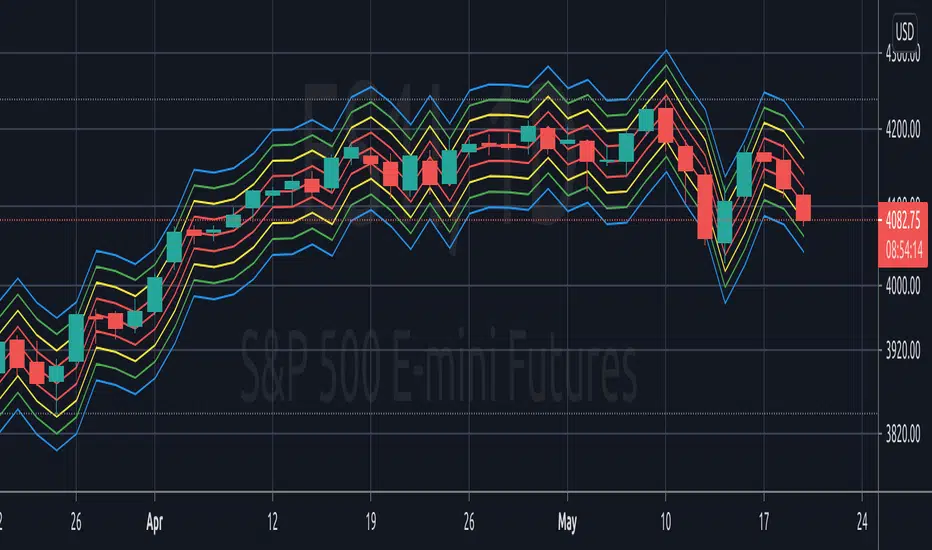
Pivots, Compressions and ExtensionsPivots, Compressions and Extensions
Best used with a monochromatic bar chart, ex. light gray bars that allow signals to stand out.///
Blue = volatility expansion warning, this means volatility has been compressed and is starting a new phase of volatility expansion.
(cont.) Think a ball at the top of a hill with very low positional volatility but high potential energy. Blue bars mark the point
(cont.) where potential energy starts to transition into kinetic energy. This often 'cycles' into a new regime of higher volatility.
Pink & purple bars signify extreme, exponential trend, often the climax of a particular bull or bear cycle. Can help identify tops.
Orange is meant to signal a pocket pivot as described by @RollyTrader among others. This pivot marks the end of consolidation.

'Golden ratio' spiral - 'GoRaS'This script is based on 'Golden Ratio'
It starts from the last pivot high/low, forming a rectangular spiral.
Mainly experimental but I think it could be used as 'support/resistance' and trend interpretation
The (pivot) length can be adjusted ('Leftbars'):
Start of the spiral can be changed ('Start loop'):
End of the spiral can be changed as well ('End loop'):
It can be made more compact, or wider ('Ratio'):
'Extend lines' can be helpful finding S/R area's:
('extend left')
Cheers!

NY Session
Script to highlight the new york session trading hours
-The most volatile hours for us30 & the time in which it's most likely to make a significant high/low