VSA Wyckoff Volume with Bubbles Introducing the "VSA Wyckoff Volume" indicator—a powerful tool for traders who want to visualize and analyze market volume with precision. This indicator leverages Volume Spread Analysis (VSA) and Wyckoff principles to categorize volume into six distinct levels: Ultra High, Very High, High, Normal, Low, and Very Low. Each level is represented by a color-coded bubble on the chart, with bubble sizes adjusted according to the volume intensity. Additionally, the indicator incorporates an ATR-based positioning system, ensuring that each bubble is placed accurately on the chart for easy interpretation. Whether you're an experienced trader or new to the market, this indicator provides clear insights into market activity, helping you make more informed trading decisions.
Volume Spread Analysis (VSA) is a trading methodology that analyzes the relationship between volume, price, and the spread (range) of a price bar. It was developed by Tom Williams, who combined his experience as a trader with principles derived from Richard D. Wyckoff's work on market manipulation.
Key Concepts of VSA:
Volume: The amount of a particular asset traded during a specific time period. In VSA, volume is a key indicator of market activity and is used to understand the strength or weakness behind price movements.
Spread: The range between the high and low of a price bar. The spread, when analyzed in conjunction with volume, can indicate whether the market is being driven by strong or weak hands.
Price: The actual value at which an asset is traded. VSA looks at price in relation to volume and spread to identify the intentions of smart money (large institutional traders).
How VSA Works:
VSA aims to uncover the footprints of smart money by analyzing the volume and price spread. The core idea is that significant price movements accompanied by high volume indicate the involvement of professional traders, while price movements on low volume might suggest that the move lacks conviction or is driven by retail traders.
VSA in Practice:
High Volume, Narrow Spread: This could indicate supply coming into the market as professional traders sell into the buying pressure, leading to potential price weakness.
High Volume, Wide Spread, Price Up: This often suggests strong buying interest, with smart money pushing prices higher.
Low Volume, Wide Spread: A sign of a potential weak market, where price is moving without strong participation, indicating that the move may not be sustainable.
Applications:
VSA is particularly useful for identifying potential turning points in the market, understanding market sentiment, and anticipating future price movements based on the actions of smart money. Traders who use VSA often combine it with other technical analysis tools to build a comprehensive trading strategy.
Your "VSA Wyckoff Volume" indicator, by categorizing volume into distinct levels and visualizing it on the chart, provides an enhanced way to apply VSA principles and understand the underlying market dynamics.
Xu hướng Lượng Giá (PVT)

BX-Volume Trend and OscillatorBX-Volume Trend and Oscillator (VTO)
This is my second indicator. I created this indicator for myself. I was inspired by the indicators created by Bjorgum, Duyck and QuantTherapy and decided to create multiple indicators that either work well combined with their indicators or something new that applies some of their indicator concepts. I decided to share this because I believe in learning and earing together as a community. I will later share the rest of the indicators I have created. If you guys have any questions or suggestions write them.
The BX-Volume Trend and Oscillator (VTO) is a comprehensive trading indicator designed to help traders identify trends, momentum shifts, and potential reversals by analyzing volume and price action through various metrics. This indicator combines relative volume analysis with custom Xtrender oscillators and moving averages to provide valuable insights into market behavior.
Image: BX-Volume Trend and Oscillator (VTO)
Features:
Relative Volume Analysis: Measures the current volume relative to the average volume over a specified period, helping traders understand if the current trading activity is unusually high or low.
Short-Term Xtrender Oscillator: This oscillator analyzes the difference between two short-term Exponential Moving Averages (EMAs) and smooths it with a custom RSI, highlighting short-term trends and potential reversal points.
Long-Term Xtrender Oscillator: Similar to the short-term oscillator but uses longer-term EMAs and RSI for identifying more sustained trends and shifts.
T3 Moving Average: A smoothed version of the Xtrender oscillator that helps in detecting trend changes more clearly.
Volume Trend Plot: Shows the smoothed relative volume to understand how trading activity aligns with the trend.
Visual Indicators: Uses colors and shapes to highlight significant changes and trends, such as circles to mark potential reversal points.
How to Use the Indicator
Analyze Relative Volume:
Relative Volume Plot: The smoothed relative volume is displayed in white, helping you assess if current trading volumes are above or below the historical average.
High Relative Volume: Indicates strong trading interest, which could support or contradict the prevailing trend.
Image above: is set to daily timeframe
Monitor Short-Term Xtrender Oscillator
Short-Term Xtrender: Plotted as a column histogram with colors changing from green to red based on the oscillator's movement and momentum. Green and lime colors indicate bullish trends, while maroon and red suggest bearish conditions.
Smoothed Short-Term Xtrender (T3): Plotted as a line that adjusts color based on the short-term Xtrender's trend. The line changes color to match the histogram's color, providing a clearer view of momentum shifts.
Reversal Markers: Small circles indicate potential short-term trend reversals, where changes in the T3 moving average suggest shifts in momentum.
Assess Long-Term Xtrender Oscillator:
Long-Term Xtrender: Plotted as a histogram, with color changes similar to the short-term Xtrender. It shows longer-term trends and shifts.
Color Indicators: Lime and green colors suggest an uptrend, while red and maroon indicate a downtrend.
Look for Zero Line Crossings:
The zero line serves as a reference point. Crossings above the zero line may indicate bullish trends, while crossings below may signal bearish trends.
Image above: is set to daily timeframe, and it showcases the Short-Term Xtrender (T3) applied.
Image above: is set to 8hr timeframe: Using the lower timeframe you can spot better details of pullbacks and potential reversals.
Example of Use:
Identify Trend and Momentum: Use the combination of the short-term and long-term Xtrender oscillators to gauge the prevailing market trend. For instance, if both oscillators are above zero and showing upward momentum, it suggests a strong bullish trend.
Spot Reversals: Observe the short-term Xtrender and its smoothed T3 version. If the T3 line changes direction and crosses through previous peaks and troughs, it could signal a potential reversal.
Volume Confirmation: Check the relative volume and its smoothed version to confirm the strength of price movements. Significant changes in volume can validate the trends indicated by the Xtrender oscillators.
By combining these elements, the BX-Volume Trend and Oscillator (VTO) provides a holistic view of market dynamics, helping traders make more informed decisions based on trend strength, potential reversals, and volume activity.
Lastly, my Scripts/Indicators/Ideas /Systems that I share are only for educational purposes!

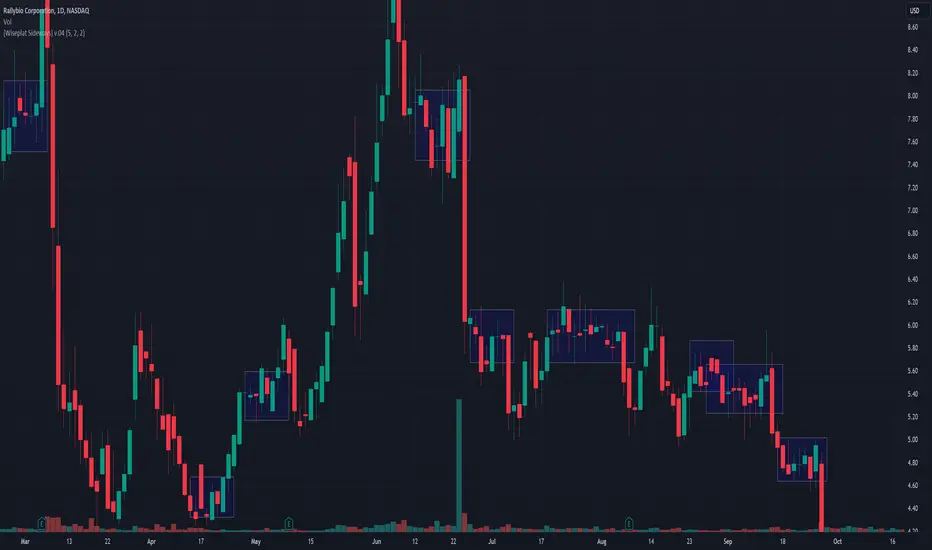
[Wiseplat Sideways] v.04The Sideway indicator for TradingView is a powerful tool designed to identify periods of sideways or ranging price action in the market. With its intuitive interface and customizable parameters, traders can easily spot when an asset is consolidating, providing valuable insights for both trend-following and range-bound strategies.
This indicator utilizes really simple algorithm to analyze price movement and volatility, effectively filtering out noise and false signals. By plotting clear visual cues on the chart.
Traders can adjust the sensitivity parameters to tailor the indicator to their specific trading style and preferences. Whether used in isolation or in conjunction with other technical analysis tools, the Sideway indicator empowers traders to make informed decisions in dynamic market conditions.
Its user-friendly design and simple settings of parameters makes it accessible to traders of all levels, from beginners seeking clarity in choppy markets to seasoned professionals looking for confirmation of their analysis. With the Sideway indicator, traders can confidently navigate sideways price action and stay ahead of the curve in their trading endeavors.
Developer: Oleg Shpagin
High Volume Price Bar ChannelThe "High Volume Price Bar Channel" indicator for TradingView is a tool designed to highlight price bars that experience unusually high trading volume compared to the average volume over a specified lookback period. When the volume of a price bar exceeds a certain multiple of the average volume, a channel is drawn extending from the high to the low of that bar, indicating a potential surge in trading activity.
Key Features:
Customizable Parameters: Users can adjust the color of the channel, the lookback period for calculating the average volume, and the factor by which the current volume should exceed the average volume to trigger the drawing of the channel.
Volume-based Highlighting: The indicator identifies price bars with high volume relative to the average and visually highlights them by drawing a channel.
Flexibility: Traders can tailor the indicator settings to suit their trading strategies and preferences, allowing for adaptability across various market conditions.
Usage:
High volume often indicates increased market activity and potential price volatility. Traders may use this indicator to identify periods of heightened interest or potential trend reversals.
When the channel is drawn, traders may look for confirmation from other technical indicators or price action to make informed trading decisions, such as entering or exiting positions, adjusting stop-loss levels, or assessing the strength of a trend.
The indicator can be applied to various timeframes and financial instruments, providing insights into volume dynamics across different market environments.
Overall, the "Customizable Volume Channel" indicator offers traders a versatile tool to spot significant volume spikes and potential trading opportunities within the context of price movements, aiding in more informed decision-making and risk management strategies.

Forex Multi-Factor IndicatorMoving Averages (MA):
Two moving averages are plotted on the chart: a fast MA (blue line) and a slow MA (red line).
The fast MA is calculated using a shorter period (10 periods by default), while the slow MA is calculated using a longer period (30 periods by default).
Moving averages help identify trends by smoothing out price fluctuations. When the fast MA crosses above the slow MA, it suggests a bullish trend, and when the fast MA crosses below the slow MA, it suggests a bearish trend.
Relative Strength Index (RSI):
The RSI indicator (orange line) is plotted on a separate axis.
RSI measures the speed and change of price movements and oscillates between 0 and 100.
RSI values above 70 are considered overbought, indicating a potential reversal to the downside, while RSI values below 30 are considered oversold, indicating a potential reversal to the upside.
Volume Moving Average (Volume MA):
The volume moving average (purple line) is plotted on the same axis as the volume.
The volume moving average is calculated over a specified period (20 periods by default).
Volume analysis provides insights into the strength of price movements. When the volume increases along with price movements, it suggests strong conviction from traders.
Buy and Sell Signals:
Buy signals (green triangle) are generated when all of the following conditions are met:
The fast MA crosses above the slow MA (indicating a bullish trend).
The RSI is below the oversold level (indicating potential upward momentum).
The current price is above the fast MA, and the volume is higher than the volume MA (indicating positive volume trend).
Sell signals (red triangle) are generated when all of the following conditions are met:
The fast MA crosses below the slow MA (indicating a bearish trend).
The RSI is above the overbought level (indicating potential downward momentum).
The current price is below the fast MA, and the volume is lower than the volume MA (indicating negative volume trend).
Overall, this multi-factor indicator combines moving averages, RSI, and volume analysis to identify potential buying and selling opportunities in the Forex market. Traders can use the signals generated by this indicator as part of their trading strategy, but it's important to consider other factors such as risk management and market conditions before making trading decisions

VSA Volume Spread AnalysisVolume Spread Analysis with Trend Direction is an indicator designed to Identify trend based volume spread.
Volume
Spread
Trend
This is a very simple yet powerful to identify Trend and corresponding volume Breakout. Unlike other Volume Indicators this indicator detects Breakout along with trend direction. One can detect the Early breakout in volume using this indicator. The Buy or Sell Signal is based on zero crossing of the Histogram.
Trend direction is confirmed using the MA of the Histogram which is similar to the Volume MA on volume indicator. One can enter a trade using the indicator when Trend direction and histogram are in same direction. Entry is done when ever histogram crosses the Trend MA line.
Fake entries can be eliminated by changing the indicator to higher Timeframe.
Spread is determined using the difference in open and close of the candle
Volume change is determined using the ratio of change of volume to previous volume
EMA 10 is used to determine the Spread and multiplied by volume change so the
PRICE(ema10), Volume, Spread(close-open) are merged to one indicator.
Direction changes when ever difference of VSA is positive or negative.

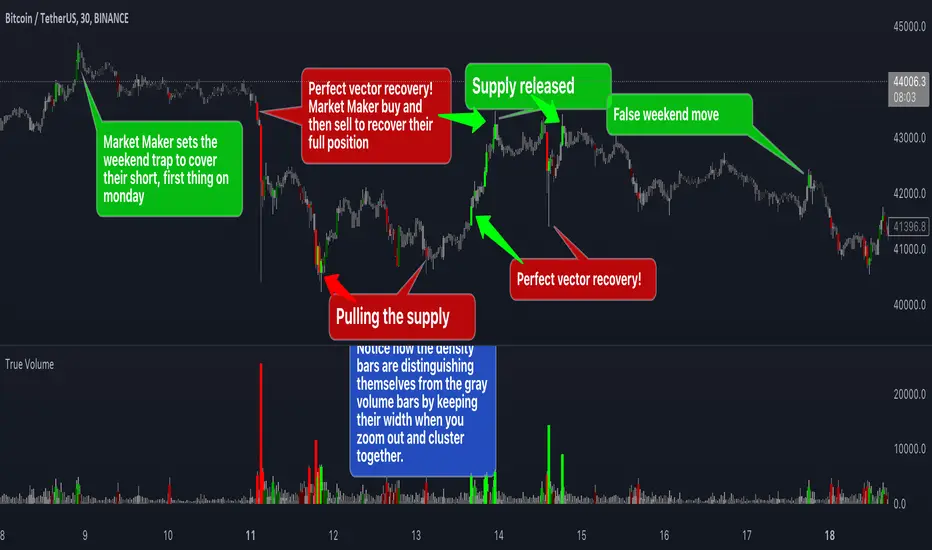
True VolumeThis indicator is designed to provide in-depth analysis of volume data from multiple sources and distinguish highly liquid candles by measuring the density of the volume. By focusing on the density and concentration of volume, rather than just the volume itself, it offers a more nuanced view of the market. This can be particularly beneficial in markets like cryptocurrencies, where understanding the role of market makers versus retail traders is crucial for strategic trading.
This is how it works:
Multiple Asset Integration:
Unlike standard volume indicators, True Volume allows the inclusion of up to four different assets (or the same asset from various exchanges) into its volume calculations. This feature provides a broader and more accurate total volume representation, essential in markets like cryptocurrencies where volume is dispersed across multiple exchanges.
Adjustable Time Anchors:
It offers various time anchor options, allowing traders to analyze volume data over different time periods or a specific amount of lookback candles. This flexibility helps in understanding volume trends over both short and long-term time frames.
Volume Density Analysis:
The core of this indicator is the innovative concept of Volume Density. It's calculated using a sigmoid function that normalizes the volume-to-price movement ratio in a unique way without needing a max cap or having the density column spike off the chart. This method helps in distinguishing between normal volume fluctuations and those that are unusually dense for the given price movement. This distinction is key in identifying potential market maker activities.
The Visuals:
The Volume Density is displayed in a unique way without compromising the original volume bars or cap the density. Infinite density can essentially be represented without having an infinitely large bar or caping out the density data. There's also two different color themes, optional bar color, and an option to flip the density bars up-side down for a different representation. Each of the original volume sources can be displayed separately as well. All colors as customizable as well for your own preference.
Price Volume Trend (PVT):
Included in this indicator is also the Price Volume Trend, which cumulatively measures the density delta, offering insights into the longer-term momentum of the market.
How do I trade it?
This indicator aims to give you insight into 'the other side of the trade', the Market Makers. When you buy, they provide liquidity by selling to you. That drives the Volume Density up.
Consider whether the market maker is currently long or short and might need to cover their position by wicking price back, or "adjust inventory". Especially towards the end of a market session.
Consider dense candles during market gaps or weekends to be market manipulation moves.
The density also goes up when stop losses are hit. If price makes a higher high or lower low, high density could indicate a liquidation event.
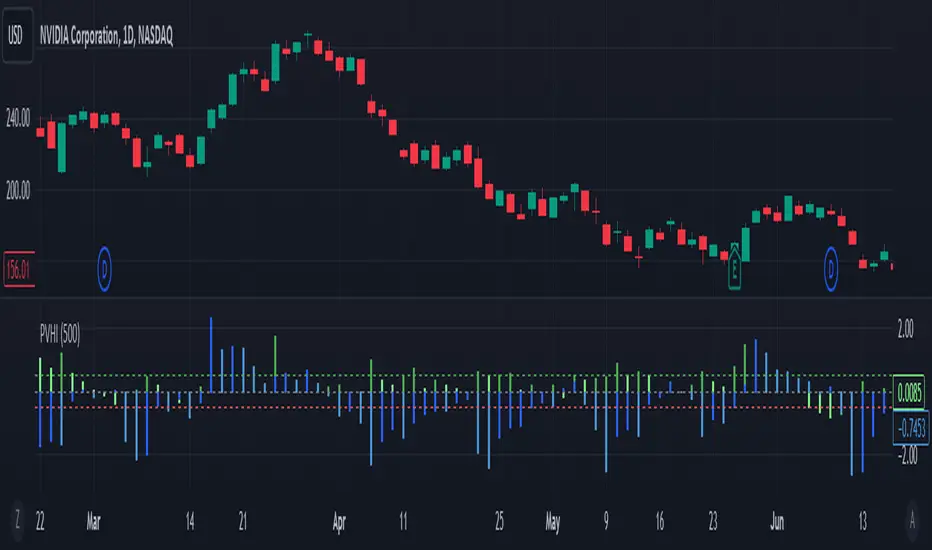
Price Volume Harmony Indicator [Nasan]The indicator "Price Volume Harmony Indicator " (abbreviated as PVHI) combines relative volume intensity (RVI) and relative price change (PC) to identify potential synergy or divergence between price and volume movements. Let's break down the key components and discuss how to interpret the output:
Relative Volume Intensity (RVI):
It calculates the mean volume intensity using simple moving averages (SMA) of different periods (5, 8, 13, and 144).
It then computes point volume intensity based on the current volume compared to the previous bar's volume.
The final RVI is a combination of mean and point volume intensities.
Relative Price Change (PC):
It calculates the median absolute deviation (MAD) and the price change relative to MAD for three different lengths (5, 8, and 13).
The average relative PC is a weighted combination of the three PC values.
Normalization:
RVI and PC are normalized using Z-scores (standard scores) to bring them to the same scale. This enables easier comparison.
Histogram Plotting:
The RVI and PC are plotted as histograms below the main price chart. Green color bars represent RVI, and blue color bars indicate PC. The RVI bars are light green when the RVI values are decreasing compared to previous bar. Similarly, when PC bars are light blue it indicates that the PC values are decreasing compared to previous bars.
There is a zero line +/- 0.5 SD lines movements above and below the SD lines are practically
significant.
Interpretation :
(1) Strong Bullish Movement :
This is when both the green bars (RVI) and blue bars (PC) increases and are on the same side above zero .
(2) Strong Bearish Movement :
This is when the green bars (RVI) increases and blue bars (PC) decreases. The green bars above zero but blue bars below zero.
(3) Weak Bullish Movement :
This is when the green bars (RVI) decreases and are below zero but the blue bars (PC) increases and are above zero .
(2) Weak Bearish Movement :
This is when both the green bars (RVI) and blue bars (PC) decreases. The green bars and blue bars are below zero.
This output is slightly hard to read but with practice can be read easily.
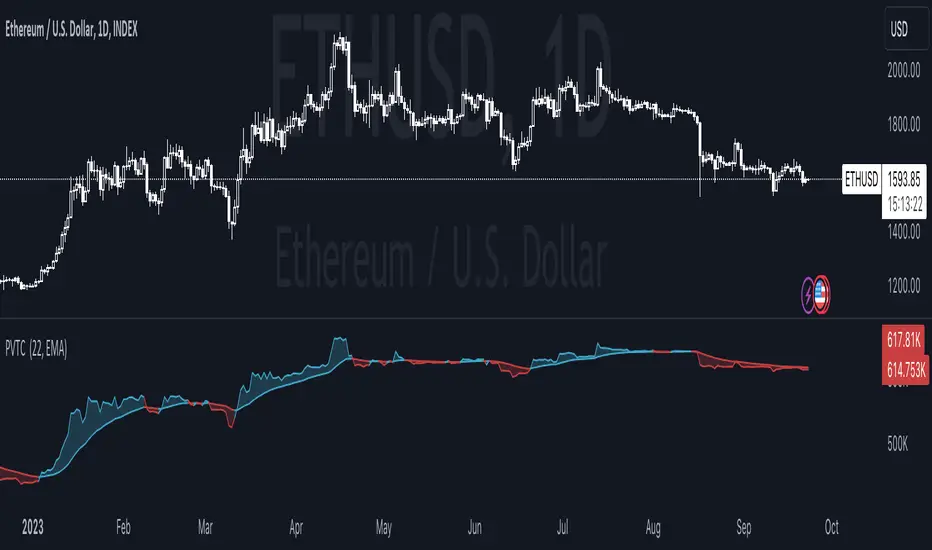
Price Volume Trend Crosses This script is a modified version of the Price Volume Trend ( PVT ) that uses a moving average of the PVT as a signal ( sig ) line.
The length of the signal line can be adjusted as needed by changing the "PVTC Signal Length" value inside the indicator settings menu.
"PVTC Signal Type" allows you to pick between EMA and SMA as the signal line.
Logic behind this script:
If PVT > sig it indicates an bullish environment and gets coloured with the UP color.
If PVT < sig it indicates a bearish environment and get coloured with the DOWN color.
Colors can be modified in the indicator settings menu.
Crosses can be highlighted by ticking the "Highlight Crosses" box in the indicator settings menu.
"Fill Gaps" fills the gap between PVT and sig with the prevailing trends color.
PVTC should not be used on its own but in conjunction with other indicators!
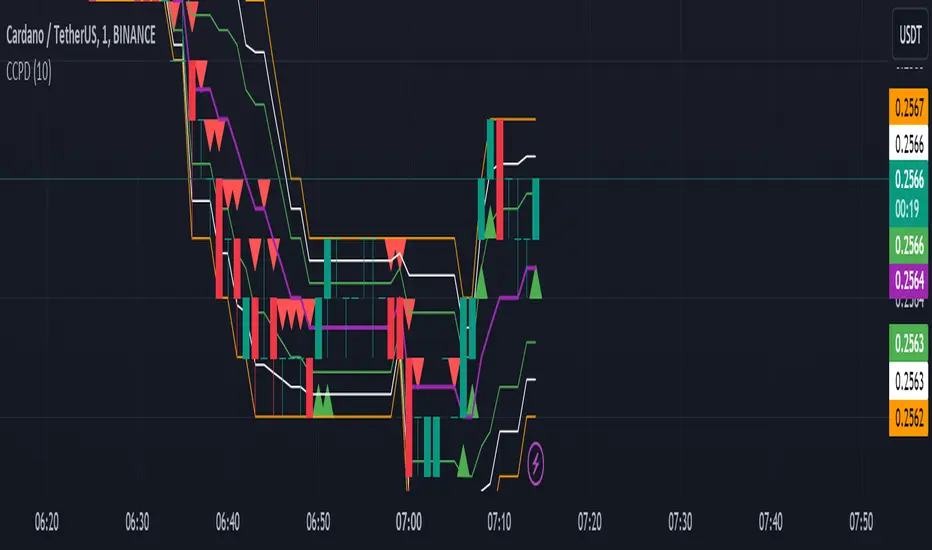
CCPD Candle Color Price DetectorThe "CCPD Candle Color Price Detector" is a custom indicator developed for TradingView, a popular platform for technical analysis and trading. This indicator assists traders in identifying potential trend reversals and assessing market sentiment based on candlestick color changes and key price levels.
This indicator operates as follows:
Color Change Detection: It primarily focuses on the color of candlesticks (green for bullish and red for bearish). When a candlestick closes higher than it opens, it is considered green (bullish), and when it closes lower, it is red (bearish).
High and Low Analysis: The indicator calculates the highest high and lowest low over a user-defined number of bars (specified by the 'Bars for High/Low' input parameter). This helps identify recent price extremes.
Midpoint Calculation: It then computes the midpoint between the highest high and lowest low, effectively determining a central reference point within the specified period.
Signal Generation: Buy and sell signals are generated based on the relationship between the current candlestick's close price, the midpoint, and the candlestick color. Buy signals occur when a green candle closes above the midpoint, suggesting potential bullish momentum. Conversely, sell signals trigger when a red candle closes below the midpoint, indicating possible bearish pressure.
Visualization: The indicator visualizes the highest high, lowest low, midpoint, and additional lines to aid in understanding the price action and potential reversal points.
Alerts: It provides alerts for buy and sell signals, allowing traders to receive notifications when potential trading opportunities arise.
Usage:
Traders can utilize the "CCPD Candle Color Price Detector" in the following ways:
Trend Reversal Identification: This indicator can help traders spot potential trend reversals by signaling when candlestick colors change and close near the midpoint. Buy and sell signals offer entry points for trades based on these reversals.
Confirmation Tool: It can be used in conjunction with other technical analysis tools to confirm trading decisions. For example, a buy signal from this indicator, coupled with a bullish trendline break or a bounce from a key support level, may provide a stronger bullish signal.
Risk Management: By understanding potential reversal points and using stop-loss orders, traders can better manage their risk and protect their capital when entering positions based on the indicator's signals.
Customization: The indicator allows users to adjust the number of bars for high/low calculations, making it adaptable to different trading strategies and timeframes.
In summary, the "CCPD Candle Color Price Detector" is a versatile indicator that can aid traders in spotting potential trend changes, enhancing trading decisions, and managing risk effectively. However, like any trading tool, it should be used in conjunction with other analysis methods and risk management strategies for optimal results.
[TTI] Price confirmation indicator📜 ––––HISTORY & CREDITS––––
The Price Confirmation Indicator is an innovative tool developed by TintinTrading to help his students learn to interpret Price + Volume moves. It is designed to provide traders with a visual cue for price movement confirmation based on both price direction and trading volume. I got the idea from watching Daivd Ryan, how he explains that he looks at volume first before looking at the price of a stock.
🦄 –––UNIQUENESS–––
What sets this indicator apart is its dual analysis approach and easy interpretation: it not only evaluates price movements but also takes trading volume into account. The indicator's color-coded bars are dynamically adjusted based on the volume difference from a 50-day Simple Moving Average (SMA) of the volume. This offers traders an intuitive way to gauge both the market's direction and its strength.
🛠️ ––––WHAT IT DOES––––
The Price Confirmation Indicator performs the following functions:
👉Price Movement: Determines whether each trading day is an 'Up Day' or a 'Down Day' based on the closing price.
👉Volume Analysis: Calculates the 50-day SMA of trading volume and identifies the volume difference in percentage terms.
👉Transparency Adjustment: Dynamically adjusts the transparency of colored bars based on the volume difference.
👉Bar Coloring: Colors the bars blue for 'Up Days' and purple for 'Down Days', with the transparency indicating the strength of the volume.
Transparency Tresholds:
Full color (no transparency 0%) - Volume is greater than 40% compared to the 50DSMA Volume
Strong color (little transparency 20%) - Volume is between 20% and 40% greater than the 50DSMA Volume
Noticable color (moderate transparency 40%) - Volume is between 0% and 20% greater than the 50DSMA Volume
Negligable color (strong transparency 60%) - Volume is light and is less than 50DSMA Volume with less than 20% lower.
Weak color (very strong transparency 80%) - Volume is below 50DSMA, with between 40% and 20% lower.
Very weak color (max transparency 90%) - Volume is below 50DSMA, with between -40% and -80% lower.
Alarming weak color (color is orange) - Volume is noticably light - this generally signals velocity contraction before a breakout.
💡 ––––HOW TO USE IT––––
Installation: Search for " Price Confirmation Indicator" in TradingView’s indicator library and add it to your chart.
Settings:
Price Up Color: Customize the color for 'Up Days'.
Price Down Color: Customize the color for 'Down Days'.
Interpretation:
Blue bars signify 'Up Days', and their transparency indicates the strength of the volume.
Purple bars represent 'Down Days', with transparency again indicating volume strength.
Orange bars signify extremely low volume days.
Volume Transparency: The less transparent the bar, the stronger the volume, aiding in confirming the price direction.
The indicator is a great tool for newer traders to get in the habit of reading Price & Volume together!

Daily Network Value to Transactions Signal (NVTS)
Quote of GlassNode ...
The NVT Signal (NVTS) is a modified version of the original NVT Ratio.
It uses a 90 day moving average of the daily transaction volume in the denominator instead of the raw daily transaction volume.
This moving average improves the ratio to better function as a leading indicator.
The Network Value to Transactions (NVT) Ratio is calculated by dividing the market cap by the transferred on-chain volume measured in USD.
GlassNode says the NVT Ratio was created by Willy Woo.
I have peaked into Glassnode and took their idea.
I also added a few more Moving Averages to select from, and the length can also be changed.
This script does not depend on Glassnode alone, instead I pulls data of several services...
CoinMarketCap
CoinMetrics
GlassNode
IntoTheBlock
Therefor we have more Tokens to select from.
I have also blocked some faulty data of each service.
If you get a study error of any kind then there is no data available,
or you on a wrong timeframe.
Best to use this script in a daily chart.
And keep in mind it pulls data of yesterday.
Therefor the plot is offset by 1 to the left.
The script will check each service if the data for the chart is available.
Market Cap is taken in the following order ...
CainMarketCap
GlassNode
CoinMetrics
Transaction volume as USD is taken in the following order ...
IntoTheBlock
CoinMetrics
GlassNode
Happy Trading!

Price by Volume ColumnsThis indicator allows you to identify how price changes for a given time period are sensitive to the volume. You will identify these changes as bars in the bottom of the chart. You may see the changes in bars for better understanding of price movements, identify trends. Please take trades at your own risk and discretion

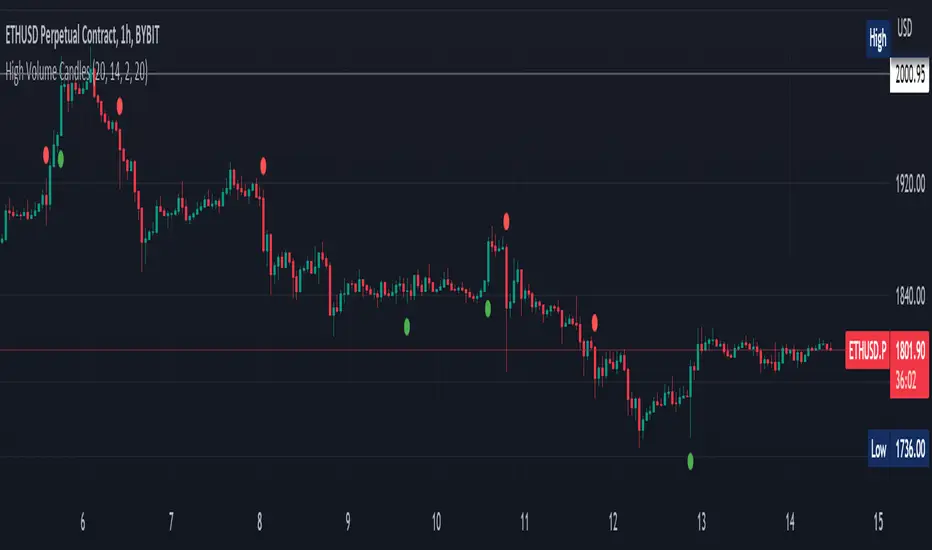
High Volume Candles Detector - Open Source CodeGreetings, fellow traders!
Throughout my trading career, I've been intrigued by the dynamic interplay between candlestick patterns and trading volume. This fascination led me to develop an open-source indicator to help illuminate these patterns for the broader trading community.
Upon researching the Public Library, I found that many indicators relating to candlestick/volume analysis are proprietary and not open-source. This discovery further fueled my commitment to contribute a free, accessible tool that traders of all levels can utilize in their technical analysis.
Thus, I am excited to present to you our High Volume Bars Indicator. A unique tool that I believe fills a gap in the Public Library. I truly hope you find it beneficial in your trading journey and that it empowers you to make more informed decisions.
Description:
The High Volume Bars Detector is designed to help traders identify bars with significantly higher volume than the average. Users can filter in the settings menu:
1) The length of the Simple Moving Average (SMA) for volume, allowing you to define the average volume over a specific number of bars.
2) The Volume Multiplier, a factor that determines how much greater the volume of a bar should be compared to the SMA to qualify as a high-volume bar.
3) The Lookback Period, a specified number of candles used as a comparative benchmark for identifying the highest volume.
4) If the Volume bar is green or red, so if the candle price is --> close > open or open > close
Examples to better understand the logic of the indicator:
1) Length of the Simple Moving Average (SMA) for Volume: This setting allows you to define the average volume over a specific number of bars. For instance, if you set the SMA length to 20, the indicator will calculate the average volume of the past 20 bars and use it as a baseline to identify high volume bars.
2) Volume Multiplier: This is a critical factor that determines the threshold for what constitutes a high-volume bar. If you set the volume multiplier to 2.0, for example, the indicator will flag any bar where the volume is twice the value of the SMA volume as a high-volume bar.
3) Lookback Period: This setting lets you specify the number of candles that the indicator should consider when determining the highest volume. For instance, if the lookback period is set to 14, the indicator will compare the volume of the current bar with the volumes of the previous 14 bars. If the current bar's volume is the highest, it will be flagged.
4) Volume Bar Color: This filter helps you identify whether a high-volume bar is bullish or bearish. If the bar is green (close > open), it suggests buyers were dominant during that period. If the bar is red (open > close), it suggests sellers had the upper hand. By setting this filter, you can choose to focus on high volume bars that are either bullish (green) or bearish (red) or both, depending on your trading strategy.
Remember, these filters offer a level of customization that allows you to tailor the High Volume Bars Detector to your unique trading style and requirements. Always remember to adapt these settings to align with your overall trading plan and risk tolerance.
Keep attention!
It is important to note that no trading indicator or strategy is foolproof, and there is always a risk of losses in trading. While this indicator may provide useful information for making conclusions, it should not be used as the sole basis for making trading decisions. Traders should always use proper risk management techniques and consider multiple factors when making trading decisions.
Support me:)
If you find this new indicator helpful in your trading analysis, I would greatly appreciate your support! Please consider giving it a like, leaving feedback, or sharing it with your trading network. Your engagement will not only help me improve this tool but will also help other traders discover it and benefit from its features. Thank you for your support!
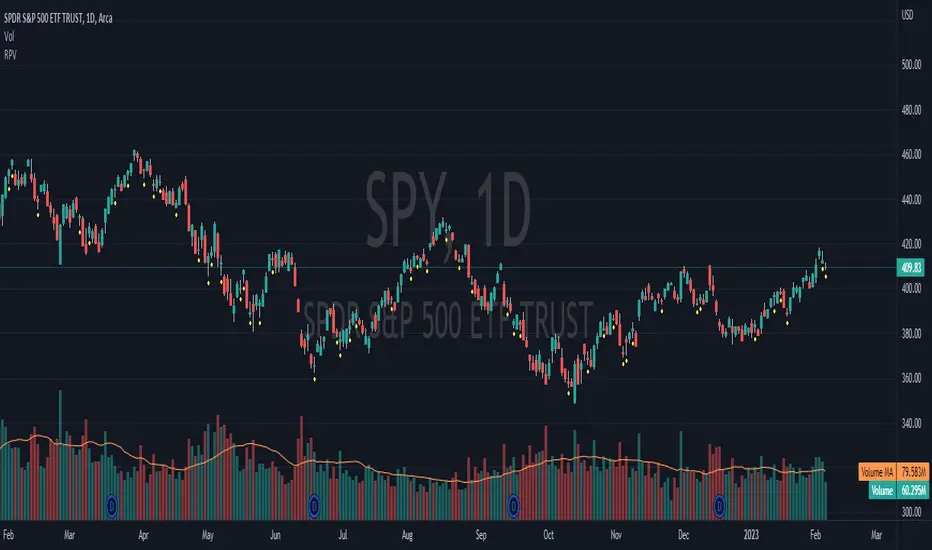
Relative Price Volume
Relative Price Volume is an indicator which shows anomalies between price and volume on a chart over a given period. The goal is to identify potential reversal and/consolidation areas for price as it relates to volume. It is a simple variation of a Volume at Price indicators. It can also be used to mark potential support and resistance lines on the chart as the areas it signals is where the price battles are waged.
Settings:
Period = length for which to calculate average candle body and average volume
Long Factor = relative size multiplier to determine if a candle is larger than average or if volume is higher than average
Short Factor = relative size multiplier to determine if a candle is smaller than average or if volume is lower than average
Anomaly Conditions
1. If a candle is larger than average and volume is lower than average, then this is an anomaly, and we should be on alert for a change in momentum.
2. if a candle is smaller than average and volume is higher than average, then this too is an anomaly and should put us on alert.
The indicator will draw a cross on the chart indicating the candle is that is flashing the warning that the run is done and a potential consolidation and/or reversal is pending. Used in conjunction with support and resistance levels this could signal a time to enter or exit a trade.
The default size factors considers a candle or volume:
1. Larger than average if it is 60% or more (.6) larger than average.
2. Smaller than average if it is 40% or less (.4) smaller than average.
Hope this helps! Happy trading!
ICT - GAPs and Volume Imbalance
GAPs
Gaps are areas on chart where the price have moved sharply up or down, with no trading in between. Gaps often fill, but they don't have to.
Volume Imbalance
Volume imbalance - determined using 2 candles
Bullish Volume Imbalance - area between the close of 1st candle and the open of 2nd candle
Bearish Volume Imbalance - area between the close of 1st candle and the open of 2nd candle
How to use the indicator:-
When you find imbalance in volume or a GAP in the chart, you may expect price to rebalance it before continuation.
Importantly, GAPs/Imbalances do not always fill. Traders should never assume that a gap/imbalance will fill without understanding the reasons for the gap and monitoring trading activity around the gap.
Pair it with your current bias for better results.

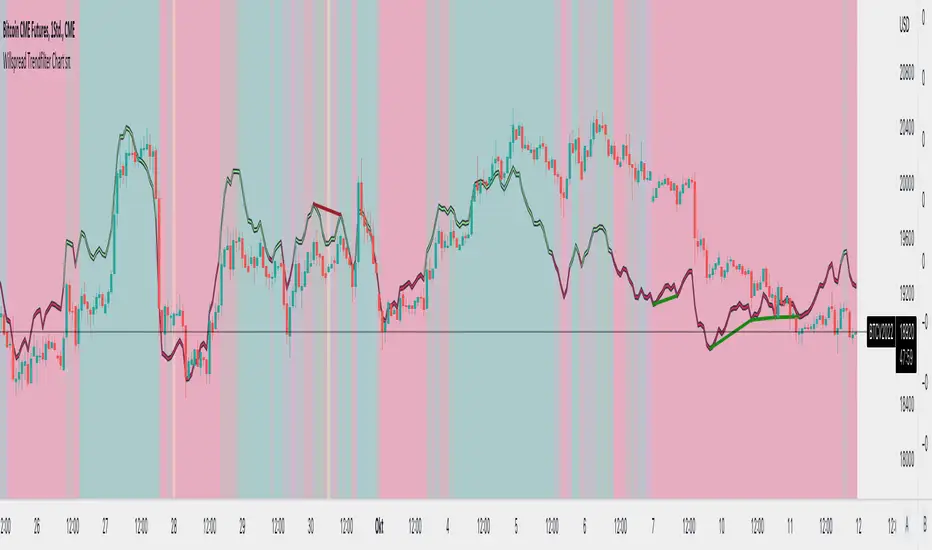
Willspread Chart + POIV & ADVolumen TrendColor sπThe Indicator is a combination of different types of measurements to the Price Action.
1. Spread: The Spread is set to measure your Symbol to another chosen Market like Dollar as Contra . But you can switch also between different markets.
2. Accumulation/Distribution with True Range of High or Low including OpenInterest. This only works with Futures .
--Energies, Metals, Bonds, Softs, Currencies, Livestock, live cattle , feeder cattle, lean hogs , index--
Open Interest for:
ZW, ZC, ZS, ZM, ZL, ZO, ZR, CL, RB, HO, NG, GC, SI, HG, PA, PL, ZN, ZB, ZT, ZF, CC, CT, KC, SB, JO, LB, AUDUSD, GBPUSD, USDCAD, EURUSD, USDJPY, USDCHF, USDMXN, NZDUSD, USDRUB, DX, BTC, ETH, LE, GF, HE, NQ, NDX, ES, SPX, RTY, VIX,
3. Accumulation/Distribution with True Range of High or Low including Volume .
4. The color shows if the Market has positive or negative (Willspread, Volume or Open Interest)
5. The Indicator also shows Divergences to Price and Willspread Movements.
If you want to have more information just give me a message.
Volume+Price Action Alert by Eciujust the update scipt with white text to the markers so it works with dark mode

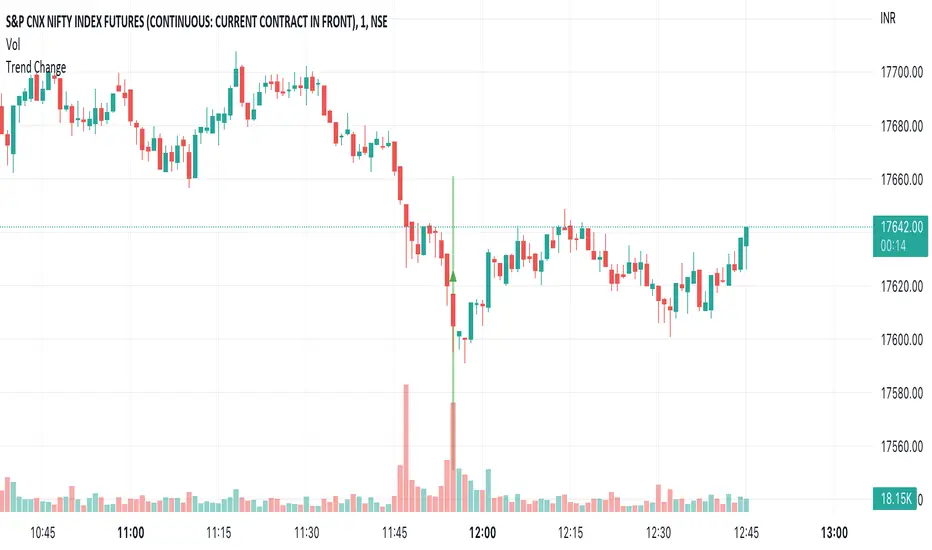
Trend ChangeThis indicator displays a general trend change. It shows an arrow on the candle from where the trend change is expected.
The trend change is calculated based on the previous candle open/close and the corresponding volume.
Point of Control V2 The genesis of this project was to create a POC library that would be available to deliver volume profile information via pine to other scripts of indicators and strategies.
This is a republish of an invite only script to open access
This is the indicator version of the library function.
A few points of significance:
- Allows the choice of reset of the study period, day/week or bars. This is simple enough to expand to other conditions
- Bar count resets starting from the beginning of the data set (bar index =0) vs bars back from the end of the data set
- A 'period' in this context is the time between resets - the start of the POC (eg. start of Day or Week) until it resets (for example at the beginning of a next day or week)
- Automates the determination of the increment level rather than the user specifying ticks or price brackets
- Does not allow for setting the # of rows and then calculating the implied price increment levels
- When a period is complete it is often useful to look back at the POCs of historical periods, or extend them forward.
- This script will find the historical POCs around the current price and display them rather than extend all the historical POC lines to the right
- This script also looks across all the period POCs and identifies the master POC or what I call the Grand POC, and also the next 3 runner up POCs
This indicator is also available as a library.
BINANCE:BTCUSDT NSE:NIFTY OANDA:XAUUSD NASDAQ:AAPL TVC:USOIL

Volume Trend Meter LTFA new take to an already popular indicator of mine, now with lower time frame support for a volume called Volume Trend Meter LTF (VTML).
The VTM LTF indicator measures the volume pressure at a specific part of the candle (Start, Middle, or the end of the candle) and displays it as a histogram.
This indicator sums up all green candle volumes and red candle volumes over the selected part of the candle (Select in settings - start end or middle) and plots their values by subtracting increasing volume and decreasing volume.
Use this indicator to identify increasing volume with the green candles (close bigger than open) and increasing volume of the red candles (close is smaller than open).
Can also work on daily charts and higher.
======= Calculation ==========
For Green Column: The total Volume of green candles is higher than the total red candle volume.
For Red Column: The total Volume of red candles is higher than the total green candle volume.
======= Volume Trend Meter LTF Colors =======
Green: Increasing buying pressure.
Red: Increasing selling pressure.
My original VTM (not the lower time frame version):
Like if you like and Follow me for upcoming indicators/strategies: www.tradingview.com

Magnifying Glass (LTF Candles) by SiddWolf█ OVERVIEW
This indicator displays The Lower TimeFrame Candles in current chart, Like Zooming in on the Candle to see it's Lower TimeFrame Structure. It plots intrabar OHLC data inside a Label along with the volume structure of LTF candle in an eloquent format.
█ QUICK GUIDE
Just apply it to the chart, Hover the mouse on the Label and ta-da you have a Lower Timeframe OHLC candles on your screen. Move the indicator to the top and shrink it all the way up, because all the useful data is inside the label.
Inside the label: The OHLC ltf candles are pretty straightforward. Volume strength of ltf candles is shown at bottom and Volume Profile on the left. Read the Details below for more information.
In the settings, you will find the option to change the UI and can play around with Lower TimeFrame Settings.
█ DETAILS
First of all, I would like to thank the @TradingView team for providing the function to get access to the lower timeframe data. It is because of them that this magical indicator came into existence.
Magnifying Glass indicator displays a Candle's Lower TimeFrame data in Higher timeframe chart. It displays the LTF candles inside a label. It also shows the Volume structure of the lower timeframe candles. Range percentage shown at the bottom is the percentage change between high and low of the current timeframe candle. LTF candle's timeframe is also shown at the bottom on the label.
This indicator is gonna be most useful to the price action traders, which is like every profitable trader.
How this indicator works:
I didn't find any better way to display ltf candles other than labels. Labels are not build for such a complex behaviour, it's a workaround to display this important information.
It gets the lower timeframe information of the candle and uses emojis to display information. The area that is shown, is the range of the current timeframe candle. Range is a difference between high and low of the candle. Range percentage is also shown at the bottom in the label.
I've divided the range area into 20 parts because there are limitation to display data in the labels. Then the code checks out, in what area does the ltf candle body or wick lies, then displays the information using emojis.
The code uses matrix elements for each block and relies heavily on string manipulation. But what I've found most difficult, is managing to fit everything correctly and beautifully so that the view doesn't break.
Volume Structure:
Strength of the Lower TimeFrame Candles is shown at the bottom inside the label. The Higher Volume is shown with the dark shade color and Lower Volume is shown with the light shade. The volume of candles are also ranked, with 1 being the highest volume, so you can see which candle have the maximum to minimum volume. This is pretty important to make a price action analysis of the lower timeframe candles.
Inside the label on the left side you will see the volume profile. As the volume on the bottom shows the strength of each ltf candles, Volume profile on the left shows strength in a particular zone. The Darker the color, the higher the volume in the zone. The Highest volume on the left represents Point of Control (Volume Profile POC) of the candle.
Lower TimeFrame Settings:
There is a limitation for the lowest timeframe you can show for a chart, because there is only so much data you can fit inside a label. A label can show upto 20 blocks of emojis (candle blocks) per row. Magnifying Glass utilizes this behaviour of labels. 16 blocks are used to display ltf candles, 1 for volume profile and two for Open and Close Highlighter.
So for any chart timeframe, ltf candles can be 16th part of htf candle. So 4 hours chart can show as low as 15 minutes of ltf data. I didn't provide the open settings for changing the lower timeframe, as it would give errors in a lot of ways. You can change the timeframe for each chart time from the settings provided.
Limitations:
Like I mentioned earlier, this indicator is a workaround to display ltf candles inside a label. This indicator does not work well on smaller screens. So if you are not able to see the label, zoom out on your browser a bit. Move the indicator to either top or bottom of all indicators and shrink it's space because all details are inside the label.
█ How I use MAGNIFYING GLASS:
This indicator provides you an edge, on top of your existing trading strategy. How you use Magnifying Glass is entirely dependent on your strategy.
I use this indicator to get a broad picture, before getting into a trade. For example I see a Doji or Engulfing or any other famous candlestick pattern on important levels, I hover the mouse on Magnifying Glass, to look for the price action the ltf candles have been through, to make that pattern. I also use it with my "Wick Pressure" indicator, to check price action at wick zones. Whenever I see price touching important supply and demand zones, I check last few candles to read chart like a beautiful price action story.
Also volume is pretty important too. This is what makes Magnifying Glass even better than actual lower timeframe candles. The increasing volume along with up/down trend price shows upward/downward momentum. The sudden burst (peak) in the volume suggests volume climax.
Volume profile on the left can be interpreted as the strength/weakness zones inside a candle. The low volume in a price zone suggests weakness and High volume suggests strength. The Highest volume on the left act as POC for that candle.
Before making any trade, I read the structure of last three or four candles to get the complete price action picture.
█ Conclusion
Magnifying Glass is a well crafted indicator that can be used to track lower timeframe price action. This indicator gives you an edge with the Multi Timeframe Analysis, which I believe is the most important aspect of profitable trading.
~ @SiddWolf

Volume Risk Avoidance IndicatorPrice Pattern Analysis is the core of trading. But price patterns often fails.
VRAI (Volume Risk Avoidance Indicator) shows Volume Pressure, so that you can avoid volume-based risks.
For example, never short when you see green (buying pressure). Never long when you see red (selling pressure).
You still need to pick good price patterns, because the crossover of volume pressure is not reliable.
Enjoy!
