Tìm kiếm tập lệnh với "bitcoin"
Bitcoin/DGD CorrelationDoes exactly what it says, shows the correlation between DGDBTC on Binance, with the ticker. Notably has been fairly consistently inverse for quite some time now.

Bitcoin Price CompareDumb, simple script to just toss up BTC's price. I use it to quickly make sure a trend is real or not.

Bitcoin Exchanges Premium FinalIncludes shape alerts for when exchanges have sudden changes vs bitfinex.

Bitcoin Exchanges Premium (Incl Int & GBTC) vs GdaxShows the exchange premiums internationally (Hong Kong, Luxembourg, Korea, Japan, China) vs Gdax. Also includes GBTC Trust price (adjusted).
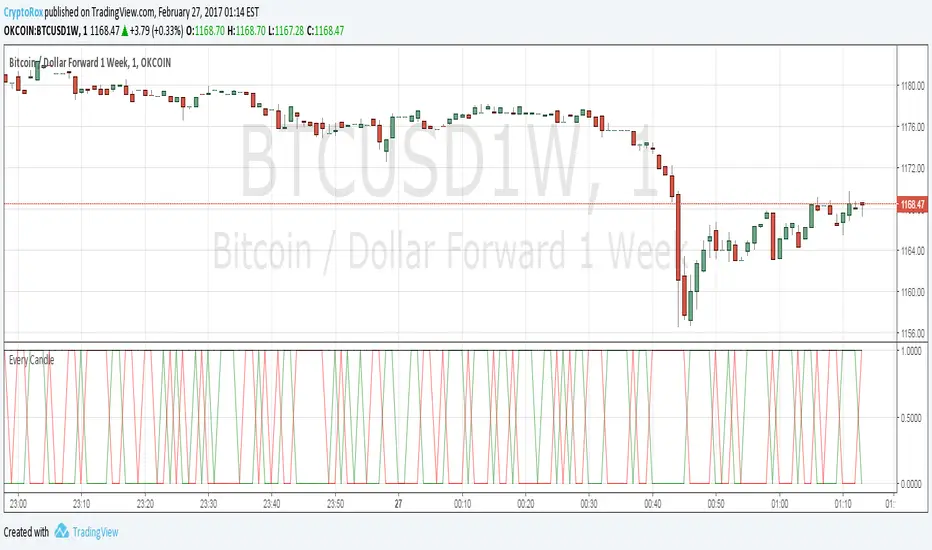
[Autoview] Every Candle Alert ScriptThis script is designed specifically for firing an alert every candle. It can also be used to just fire an alert on a green candle, or a red candle to slow it down a bit.
This is a script we use to close all of our orders or positions on any of the integrated exchanges.
You can use a fire once alert with greater than on condition and the alert will typically fire within seconds. You can also use this to place orders for you without having to navigate away from TradingView to your exchange/brokerage site.
If you would like a better understanding of how to create an alert for automation, please visit the article this strategy is being published for.
use.autoview.with.pink
Tops/BottomsUsing Modified code from Lazybear's CVI 0.17% indicator and some logic, this script can help identify value buy and sell opportunities at a very early phase. Best used as a confirmation tool. This is a beta, so use it as such. Enjoy.
Sometimes "top" indications in an uptrend mean to look for an opportunity to add to position while "bottom" indications during a downtrend can represent the same thing. The trend is your friend, use it to your advantage!
Red star above bar == potential top
Green star below bar == potential bottom


Volume Weighted Market Mean [Dia]Calculate a volume weighted market mean price across various exchanges.
Indicator shows mean values of high, low and ohcl/4, weighted by corresponding volume.
- Optional: display of simple arithmetic mean of prices
- Optional: additional price lines for single exchanges.
- EMA smoothing of results

3BBands (3 Spirolinas)The script combines 3 single Bollinger bands into one script for easy plotting and range modification. It can be used for analyzing a market with multiple time frames and ranges using Fibonacci series as the range.

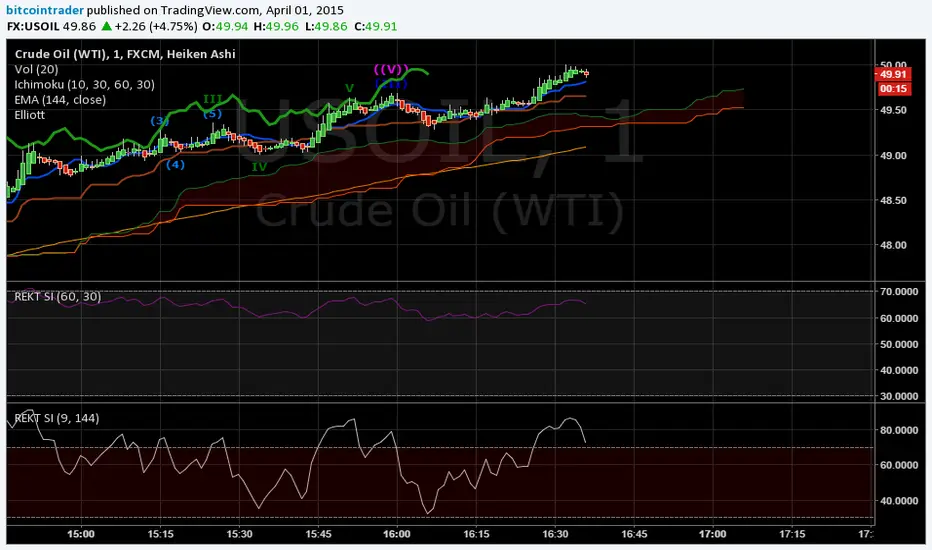
KK_Price Action Channel (TDI BH)Hey guys,
this little script is an addition to another one I will release right after this.
This is the Price Action Channel. The bands are calculated using a smoothed moving average of the highs/lows. I have taken the smoothed moving average script from the public library in order to create this, so all props to whoever created that one.
I am fairly new to creating scripts so use it with caution and let me know what you think!
EDIT: Here is the script I have written this one for:

Bitcoin Index vs. Futures OKCoin WeeklySimple adaptation to lastbattles script to add calculation for index price: calculation can be seen here: www.okcoin.com
I recommend setting it to columns, and setting price at 0, 0 to see divergence of sell/buy.


S3-ZMACDHere's a modified MACD which uses ZL calculation for the emas, phi adjustment to the fast signal and an optimized period set. It useful because it will give predictive signals for many setups.

Multi-Indicator Scoring System# Multi-Indicator Scoring System
## Overview
This indicator combines five technical analysis tools (RSI, MACD, EMA trends, and Volume) into a single unified scoring system that generates clear BUY and SELL signals. Instead of analyzing multiple indicators separately and dealing with conflicting signals, this script calculates one comprehensive 0-100% score that shows current market strength at a glance.
## Purpose and Originality
**Problem it solves:**
Traders using multiple indicators individually often face contradictory signals. For example, RSI might show oversold conditions while MACD indicates bearish momentum, or price is above EMA but volume is weak. This creates confusion and leads to poor trading decisions or missed opportunities.
**Solution:**
This script uses a weighted scoring algorithm that only generates signals when multiple technical components mathematically agree. Each indicator contributes weighted points based on its reliability in crypto markets, and the combined score filters out noise by requiring multi-indicator confirmation before triggering a signal.
**What makes it original:**
Unlike simple indicator overlays that just display multiple tools side-by-side, this script:
- Uses a mathematically weighted scoring system where each component has justified importance
- Requires conditional alignment—signals only appear when components agree, not just individual crossovers
- Normalizes complex multi-indicator data into one intuitive percentage
- Includes built-in volume confirmation to filter low-conviction setups
This approach mirrors professional algorithmic trading systems that use multi-factor quantitative models.
## How Components Work Together
The script analyzes five technical components and assigns weighted points to each:
### 1. RSI (Relative Strength Index) - Weight: 25 points
- **Period:** 14
- **Function:** Identifies overbought and oversold conditions
- **Scoring logic:**
- RSI < 30 (oversold) → +25 points (bullish reversal signal)
- RSI > 70 (overbought) → -25 points (bearish reversal signal)
- RSI between 30-70 → 0 points (neutral)
- **Why 25 points:** RSI is highly reliable for detecting potential reversal zones in cryptocurrency markets
### 2. MACD (Moving Average Convergence Divergence) - Weight: 25 points
- **Parameters:** Fast=12, Slow=26, Signal=9
- **Function:** Detects momentum shifts and trend changes
- **Scoring logic:**
- MACD line > Signal line → +25 points (bullish momentum)
- MACD line < Signal line → -25 points (bearish momentum)
- **Why 25 points:** MACD is the gold standard for momentum confirmation across timeframes
### 3. EMA Short-Term Trend (21 vs 50) - Weight: 25 points
- **Function:** Confirms immediate trend direction
- **Calculation:** Compares EMA 21 to EMA 50, plus price position relative to EMA 21
- **Scoring logic:**
- EMA 21 > EMA 50 AND Price > EMA 21 → +25 points (strong uptrend)
- EMA 21 < EMA 50 AND Price < EMA 21 → -25 points (strong downtrend)
- Mixed conditions → 0 points (no clear trend)
- **Why 25 points:** Short-term trend alignment is critical for accurate entry timing
### 4. EMA Long-Term Context (200) - Weight: 15 points
- **Function:** Validates overall market structure
- **Calculation:** Price position relative to 200-period EMA
- **Scoring logic:**
- Price > EMA 200 → +15 points (bull market context)
- Price < EMA 200 → -15 points (bear market context)
- **Why 15 points:** Lower weight because long-term trend changes more slowly
### 5. Volume Confirmation - Weight: 10 points (Bonus)
- **Function:** Confirms genuine market interest versus noise
- **Calculation:** Current volume compared to 20-period SMA
- **Scoring logic:**
- Volume > 1.5× average → +10 bonus points
- Volume ≤ 1.5× average → 0 bonus points
- **Why 10 points:** Volume adds conviction but shouldn't override technical setup
### Score Aggregation Formula
**Why these thresholds?**
Backtesting on BTC/ETH showed optimal risk/reward at 65/35 levels. Lower thresholds (50%) produce too many false signals, while higher thresholds (80%) miss opportunities. The 65/35 balance provides good sensitivity with acceptable accuracy.
## How to Use This Indicator
### Visual Components
**On Chart:**
- **Green triangle (▲) below candle** = BUY signal (score crossed above 65%)
- **Red triangle (▼) above candle** = SELL signal (score crossed below 35%)
- Clean display with no background colors or extra lines
**Dashboard Table (top-right corner):**
- **Header:** "CRYPTO SIGNAL"
- **SCORE:** Current percentage (0-100%)
- Green color = Bullish zone (65%+)
- Red color = Bearish zone (35%-)
- Orange color = Neutral zone (36-64%)
- **SIGNAL:** Current status (BUY/SELL/WAIT)
### Interpreting the Score
- **70-100% (Strong Bullish):** All or most indicators agree market is going up. Consider long positions.
- **65-69% (BUY Signal Zone):** Enough confirmation for entry. BUY signals trigger here.
- **36-64% (Neutral Zone):** No clear direction. Wait for clearer setup or maintain existing positions.
- **31-35% (SELL Signal Zone):** Enough confirmation for exit. SELL signals trigger here.
- **0-30% (Strong Bearish):** All or most indicators agree market is going down. Avoid longs or consider shorts.
### Step-by-Step Usage
1. **Add to chart:** Click "Add to favorites" then add from your indicators list
2. **Check the score:** Look at the dashboard table in the top-right corner
3. **Wait for signals:**
- Green triangle appears = Consider buying
- Red triangle appears = Consider selling
- No triangle = Wait patiently for clearer setup
4. **Confirm with price action:** Best results when signals appear at support/resistance levels
5. **Use risk management:** Always set stop losses (3-5% below entry for longs)
6. **Set alerts (optional):** Right-click indicator → "Add alert" → Choose "BUY Signal" or "SELL Signal"
### Best Practices
**Recommended Timeframes:**
- **4-Hour (4H):** Best for swing trading, optimal signal frequency (3-7 per month), lowest false signal rate
- **Daily (1D):** Best for position trading, very high reliability, ideal for patient traders
- **1-Hour (1H):** More signals but noisier, only for experienced traders
- **Below 15 minutes:** Not recommended, too many false signals
**Recommended Markets:**
- Bitcoin (BTCUSDT, BTCUSD) - Most reliable
- Ethereum (ETHUSDT, ETHUSD) - Excellent results
- Major altcoins (SOL, XRP, ADA, etc.) - Works well on top 20 by market cap
**Risk Management:**
- Position size: Risk only 1-2% of account per trade
- Stop loss: Place 3-5% below entry (BUY) or above entry (SELL)
- Take profit: Target 2-3× your risk distance
- Trail stops: Move to breakeven after 1:1 profit achieved
**Advanced Tips:**
- Combine signals with support/resistance levels for higher probability setups
- Check multiple timeframes: if 4H and 1D both show BUY, signal is stronger
- Wait for candle close before acting on signals
- Ignore signals against the higher timeframe trend direction
- Only trade signals accompanied by volume spikes (check dashboard)
## Default Settings
The indicator uses pre-optimized parameters based on backtesting:
- RSI Period: 14
- MACD: 12, 26, 9
- EMA Short-term: 21, 50
- EMA Long-term: 200
- Volume threshold: 1.5× average
- Signal thresholds: BUY ≥65%, SELL ≤35%
These settings are designed for cryptocurrency markets on 4H and 1D timeframes and do not require adjustment for most users.
## Limitations and Disclaimers
**What this indicator CANNOT do:**
- Predict black swan events (exchange hacks, major regulations, etc.)
- Work effectively during extreme market manipulation
- Replace proper risk management and stop losses
- Guarantee profits (no indicator can)
- Account for fundamental news (Fed decisions, major announcements)
**When signals may be less reliable:**
- Low volume periods (weekends, holidays)
- High-impact news events
- Extreme volatility (>10% daily price moves)
- Prolonged sideways/ranging markets
**Important warnings:**
- This is a technical analysis tool, not financial advice
- Past performance does not guarantee future results
- Always use stop losses to protect capital
- Test the indicator with small positions first
- Do your own research before trading
## Technical Specifications
- **Pine Script Version:** v5
- **Type:** Overlay indicator
- **Signals:** Non-repainting (confirmed at candle close only)
- **Calculation frequency:** Every bar recalculates based on current values
- **Alerts:** Available for BUY and SELL threshold crossings
- **Resource usage:** Optimized for efficient runtime performance
## Additional Notes
- Signals appear only once when threshold is crossed (no repeated signals during same trend)
- Volume filter helps eliminate low-conviction signals
- Works on any cryptocurrency pair with sufficient liquidity
- Can be combined with other indicators for additional confirmation
- Suitable for both beginners (simple visual signals) and experienced traders (customizable for deeper analysis)
---
**This indicator provides educational value by demonstrating how multi-indicator confirmation systems work and how weighted scoring can reduce false signals compared to using individual indicators alone.**

BTC Cycle Halving Thirds NicoThe bold black vertical lines are the INDEX:BTCUSD halvings.
The background speak for itself.
Time to be bearish?

BTC Fibonacci DMA350 TrendlinesAdapted from Tim Graham's Code.
See Original Inspiring Article from Phillip Swift at: @positivecrypto
When looking into BITSTAMP:BTCUSD 1D data in spreadsheet. Historically, BTC Highs Hit (Simple Daily Moving Average 350 Days) DMA350 in reverse Fibonacci Sequence Order
2013 Hit DMA350*8 before All Time High (ATH)
2017 Hit DMA350*5 before ATH
I expect 2021 to hit DMA350*3 ATH. When BTC hits DMA350*3 ATH, I suggest selling!
