Nasdaq or US Composite Total VolumeBecause no NASDAQ composite index or NYSE composite index provide data volume, this script intends to use the NASDAQ Composite total volume index, index ticker : TVOLQ, or the NYSE Composite total volume index, index ticker : TVOL, as a classical volume indicator on chart.
How tu use : in the input tab choose youe prefered SMA lenght and the volume' index ticker you want to display. TVOLQ for the NASDAQ Composite total volume or TVOL for the NYSE Composite total volume.
On chart, choose to display the indicator in a new pane.
Tìm kiếm tập lệnh với "index"

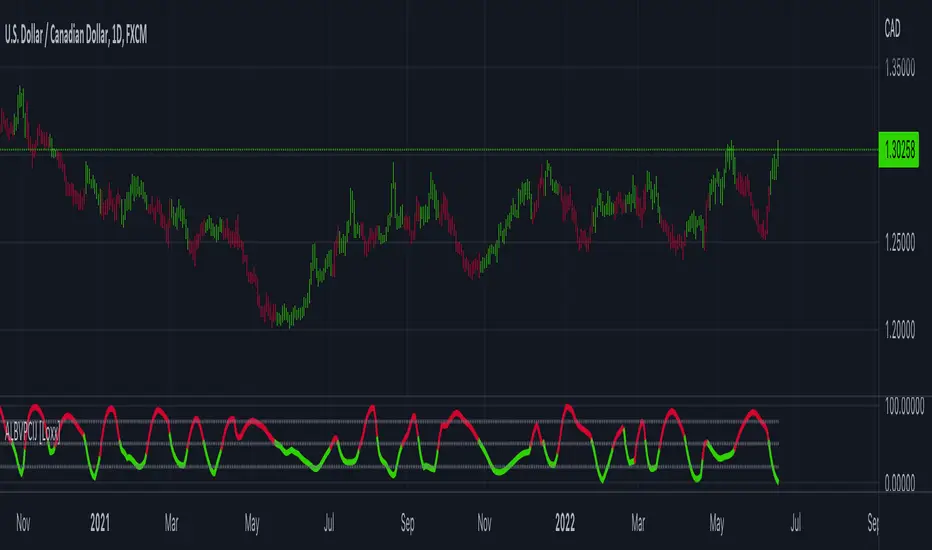
Adaptive Look-back/Volatility Phase Change Index on Jurik [Loxx]Adaptive Look-back, Adaptive Volatility Phase Change Index on Jurik is a Phase Change Index but with adaptive length and volatility inputs to reduce phase change noise and better identify trends. This is an invese indicator which means that small values on the oscillator indicate bullish sentiment and higher values on the oscillator indicate bearish sentiment
What is the Phase Change Index?
Based on the M.H. Pee's TASC article "Phase Change Index".
Prices at any time can be up, down, or unchanged. A period where market prices remain relatively unchanged is referred to as a consolidation. A period that witnesses relatively higher prices is referred to as an uptrend, while a period of relatively lower prices is called a downtrend.
The Phase Change Index (PCI) is an indicator designed specifically to detect changes in market phases.
This indicator is made as he describes it with one deviation: if we follow his formula to the letter then the "trend" is inverted to the actual market trend. Because of that an option to display inverted (and more logical) values is added.
What is the Jurik Moving Average?
Have you noticed how moving averages add some lag (delay) to your signals? ... especially when price gaps up or down in a big move, and you are waiting for your moving average to catch up? Wait no more! JMA eliminates this problem forever and gives you the best of both worlds: low lag and smooth lines.
Ideally, you would like a filtered signal to be both smooth and lag-free. Lag causes delays in your trades, and increasing lag in your indicators typically result in lower profits. In other words, late comers get what's left on the table after the feast has already begun.
That's why investors, banks and institutions worldwide ask for the Jurik Research Moving Average ( JMA ). You may apply it just as you would any other popular moving average. However, JMA's improved timing and smoothness will astound you.
What is adaptive Jurik volatility
One of the lesser known qualities of Juirk smoothing is that the Jurik smoothing process is adaptive. "Jurik Volty" (a sort of market volatility ) is what makes Jurik smoothing adaptive. The Jurik Volty calculation can be used as both a standalone indicator and to smooth other indicators that you wish to make adaptive.
What is an adaptive cycle, and what is Ehlers Autocorrelation Periodogram Algorithm?
From his Ehlers' book Cycle Analytics for Traders Advanced Technical Trading Concepts by John F. Ehlers, 2013, page 135:
"Adaptive filters can have several different meanings. For example, Perry Kaufman’s adaptive moving average (KAMA) and Tushar Chande’s variable index dynamic average (VIDYA) adapt to changes in volatility. By definition, these filters are reactive to price changes, and therefore they close the barn door after the horse is gone.The adaptive filters discussed in this chapter are the familiar Stochastic, relative strength index (RSI), commodity channel index (CCI), and band-pass filter.The key parameter in each case is the look-back period used to calculate the indicator. This look-back period is commonly a fixed value. However, since the measured cycle period is changing, it makes sense to adapt these indicators to the measured cycle period. When tradable market cycles are observed, they tend to persist for a short while.Therefore, by tuning the indicators to the measure cycle period they are optimized for current conditions and can even have predictive characteristics.
The dominant cycle period is measured using the Autocorrelation Periodogram Algorithm. That dominant cycle dynamically sets the look-back period for the indicators. I employ my own streamlined computation for the indicators that provide smoother and easier to interpret outputs than traditional methods. Further, the indicator codes have been modified to remove the effects of spectral dilation.This basically creates a whole new set of indicators for your trading arsenal."
Included
-Your choice of length input calculation, either fixed or adaptive cycle
-Invert the signal to match the trend
-Bar coloring to paint the trend
Happy trading!
Fractal Dimension Index The Fractal Dimension Index is a technical indicator that gauges the amount of volatility currently present in the market.
The theory behind this indicator is that a value of 1.5 suggests the market is acting in a completely random fashion. As the market deviates from 1.5, the opportunity for earning profits is increased in proportion to the amount of deviation.
Keep in mind that the indicator does not show the direction of trends ! Although you can try to test it as a trend-following indicator that gives trend-following signals, that isn't the intended use of the indicator.
The Fractal Dimension Index is red when the market is in a trend. And it is blue when there is high volatility. When the Fractal Dimension Index changes its color from red to blue , it means that a trend is finishing. The market becomes erratic and high in volatility when the Fractal Dimension Index is blue . Usually, these "blue periods" do not go on for a long time, they come before a new trend.
So, look for trend-following signals while the Fractal Dimension Index is blue since this indicates high volatility before a potential trend, and avoid trend-following signals when the Fractal Dimension Index is red since this indicates a ranging/non-trending market or a trend that started long ago.

VolatilityDivergenceRedGreen by STTAName: VolatilityDivergenceRedGreen by STTA
- Underlying and implied volatiliy normally show negative correlated behavior (price rises, vola falls and vice versa)
- This study shows symbols in on candles in chart where Undelying and corresponding vola index show same bahvior for 1,2 or 3 consecutive bars. (price rises and vola rises and vice versa)
- This situation is called Vola Divergence. Red, when prices and vola fall; green, when price and vola rise
- This information can be used to detect possible end of Up/Down-Swings.
- User can configure if rising or falling or both price movements shall be displayed.
- This study can be used with root symbols, which provide corresponding volatility indices.
- supported Root Symbols: SPX, NDQ, DJI, RUT, CL, XLE, GC, SI, EUR, HSI, FXI, EWZ, AMZN, AAPL, GS, GOOG, IBM, DEU40
- in all other symbols, no symbols are displayed.
Inputs
- underlying displayed in chart
Settings/Parameter
- each Divergence can be switched off/on separately
- output of each displayed symbol can be configured
Outputs
- RedDiv1: first bar with rising price and rising volatility index
- GreenDiv1: first bar with falling price and falling volatility index
- RedDiv2: second bar in a row with rising price and rising volatility index
- GreenDiv2: second bar with falling price and falling volatility index
- RedDiv3: third bar in a row with rising price and rising volatility index
- GreenDiv3: third bar in a row with falling price and falling volatility index

Bank Nifty ParticipantsBankNifty Index is calculated based on the movements of its participants. Every time you think of why is Index going up/down, who is actively dragging the index either ways, this Indicator gives you the answer for the same in realtime!
For example : You see HDFCBank and Kotak Bank significantly up while all other banks going down but index reacting in a bullish mode, the answer lies in which Bank is contributing how much to the index! This will help you in pre-planning your trades based on the movements shown by different banks in Index calculation. Or on the other hand, you see HDFCBank on verge of breakout and you have target of 10 points, this indicator will help you in identifying how much the index will react to the 10 points movement shown by HDFC Bank which is the leading participant in Bank Nifty.
RSI column is an add-on to the participation table which will help you in getting RSI values of different banks at a glance. You will see values getting updated in realtime in live market. Checkout for customisations in indicator settings.
Note : Participants present in this indicator and their participation percentage is taken from the official NSE website.
Feel free to contribute/comment changes if any!
- Published by Soham Dixit

Alpha Dynamic Momentum Index Pine@v=4- What Is Dynamic Momentum Index?
- The dynamic momentum index is a technical indicator used to determine if an asset is overbought or oversold. It can be used to generate trade signals in trending and ranging markets.
- The dynamic momentum index was developed by Tushar Chande and Stanley Kroll and is similar to the relative strength index (RSI). The main difference between the two is that the RSI uses a fixed number of time periods (usually 14) in its calculation, while the dynamic momentum index uses different time periods as volatility changes, typically between five and 30.
- The number of time periods used in the dynamic momentum index decreases as volatility in the underlying security increases, making this indicator more responsive to changing prices than the RSI. This is particularly useful when an asset's price moves quickly as it approaches key support or resistance levels. Because the indicator is more sensitive, traders can potentially find earlier entry and exit points than with the RSI, but it could also be more prone to whipsaws and false signals.

RedK Bar Strength Inspector / Bar Strength Index (BSI)Summary
=========
The Bar Strength Inspector / Bar Strength Index (BSI) is an indicator that evaluates each price bar against a user-selectable set of "strength categories" - BSI then calculates a combined score from these categories and provides an index - plotted as a centered oscillator - roughly similar to the way Relative Strength Index (RSI) works, which can be used to evaluate the strength of price move and the possibilities of trend continuation or reversal.
Background
=============
BSI is like a Swiss-army knife with many components - so apologies upfront if this guide gets long - and i know i will still miss few pieces that needs explaining. please alert me if something is not clear.
BSI is an advanced / re-built version of my Ultimate Trader Oscillator (UTO)
I continue to believe that one of the best trading tools that i can use, is a tool that can automate the visual inspection of the price chart - a tool that simulates (and quantifies in numbers/score) the way we visually look at a certain price bar, and make a judgement that "this is a strong bar, so I expect the trend down to possibly reverse" - BSI is a an attempt to achieve that. An attempt to answer a simple question (in a quantifiable manner):
how strong / weak is this price bar - how does it compare to previous bars ? what is the average of that strength (or weakness) for the last few bars ?(based on the trader's preferred timeframe)
How does BSI work
====================
* BSI will inspect and evaluate each bar against various (selectable) strength categories.
* BSI will give a -100/+100 score against each "strength category", then combine these scores into an index and create an average of that index
* the average index (also called BSI) will be calculated for both a short and long lengths
* the short length represents "local / short-term" strength - plotted as a blue/orange line (with an additional signal line to make easier to "read")
* the long-term reflects the broader bias (sentiment) - plotted as green/red area (or mountain)
How is BSI different from UTO
=============================
- I wrote BSI from the ground up to validate each scoring calculation and the resulting outcomes - so i would consider BSI to be more accurate than UTO
- i wrote BSI in a way to make it a lot more flexible. BSI allows me to choose which category to include in the "inspection"
- the strength categories are streamlined to reflect single bar strength, strength from bar-to-bar, and relative strength (range and volume) - they have also been chosen in a way that map to commonly used Technical Analysis concepts, to increase the value of BSI and the ability to compare with other common indicators (for example, BoP, Stochastic, Relative Volume and RSI)
- added the table view - which i use mainly to track the action within the current bar - and to learn more about how to evaluate strength vs weakness with various chart patterns
- UTO still represents the foundation of this work - but i will not update UTO any longer so all changes will be applied to the BSI- i have been using both UTO and BSI to guide my trading for the past few months.
- couple of other features in BSI:
- support for instruments with no volume data (even if the user chooses volume) - number of inspection categories will show as "7" in that case
- ability to plot the individual category scores, and the total weighted score (for the selected categories) - these plots are hidden by default
- ability to see the total score for all 8 (or 7 in case no volume data) categories regardless of how many are active - but only in the table view
- ability to be used as both a lower (independent) and a top indicator (on the price chart) -- see below examples.
Structure of the BSI Strength Categories
=====================================
The first 3 inspected strength categories focus on "single bar strength", they evaluate how the bar closes compared to the low, the Balance of Power (BoP) and the relative BoP
The next 3 categories focus on evaluating the bar-to-bar strength: how the bar closes compared to the low of the 2-bar range, how the bar closes compared to prior close - and the relative "shift"
The last 2 "strength" categories evaluate the relative range of bar compared to recent average range and the relative volume.
Understanding the bar inspection & scoring approach
==================================
During inspection for each category, a score is calculated with a value between 0 to 100, then it will be made "directional" - which means that +100 represents highest possible strength score and a value of -100 is the highest possible "weakness" score
Note that a 0 score doesn't mean "weak" - but rather "neutral" - this can be a bit confusing until we get used to the way BSI scoring works.
Example: in relative volume, a bar associated with the lowest volume observed during the lookback length, will have a 0 relative volume score -- while a bar associated with the highest volume observed will have either a +100 or a -100 score (depending on whether it's an up or down bar) - same thing for relative range.. and so on
Here are the 8 strength categories evaluated by the BSI
1 Bar closing score
2 Body : Spread (BoP) ratio
3 Relative BoP
4 2-bar Closing Score
5 2-bar Shift Ratio (Shift : 2R)
6 Relative Shift
7 Relative Range
8 Relative Volume
Specific meaning of keywords / concepts (within BSI context):
======================================================
Relative : compared to recently observed values (= within Lookback # bars)
Shift : the change in closing value vs prior bar
Bar Spread : high - low
Range : True Range ..... as in the tr() Pine function, so not to be confused with "spread"
More detailed notes about scoring and calculations for each strength category are included within the code
BSI Settings:
=============
Here is a chart showing the main sections in the BSI Settings box and how to configure it to your preference
Using the BSI:
================
- I use BSI for 2 main scenarios
(1) Guiding my Day-to-day trading: the usage here is roughly similar to a volume-weighted dual-period RSI .. with a lot more options - picking and choosing between the 8 strength categories in BSI allows for 255 variations of "strength evaluations" - a trader can choose to focus only on "single bar strength" score categories, so only picks the top 3 in the settings - another trader wants to track only the strength reflected by the relative range and relative volume, so picks the lower 2 categories. another trader wants to use BSI as a volume weighted Balance of Power.. and so on. Many combinations are possible.
i have added couple of charts that explain some of the "signals" we can expect from BSI (below chart) - note that i use the "Green/Red mountain plot" as the "prevailing sentiment" - as it confirms the longer term strength (or weakness). the BSI line plot reflects the short term strength and not necessarily tied directly to how the price is moving (see example in the chart - and also compare to how RSI works)
- 2 important points here if you plan to use BSI in trading: set BSI up on a 1-min or 5-min chart and watch how it works to learn how it evaluates each bar - and always use BSI in combination with other indicators that you are familiar with to validate and confirm any signals
(Important note: do not react to the values in the table as they change in real time - i found that to be very tempting - rather look at the broader context and the flow of the BSI / sentiment) - you can also test BSI with Paper Trading in TV - it's like a new car that you need some time to get used to :)
(2) Use BSI to help learn chart / pattern analysis - watch BSI print scores against the various categories in real time to hone your chart (pattern) reading skills and how to evaluate strength of various bar shapes - for example, a bar that closes at the high but does not reach the mid point of the prior bar - strong or weak ? how about a doji or a hammer ? ...etc
Chart showing main usage scenarios
Example BSI in real time:
======================
I hope this work helps few fellow traders hone their trading skills, or help inspire other ideas - please let me know if you have feedback or suggestions.

Reverse Stochastic Momentum Index On ChartIntroducing the Reverse Stochastic Momentum Index "On Chart" version
According to Investopedia :
“The Stochastic Momentum Index (SMI) is a more refined version of the stochastic oscillator, employing a wider range of values and having a higher sensitivity to closing prices.”
The SMI is considered a refinement of the stochastic oscillator developed by William Blau and introduced in 1993 in an attempt to provide a more reliable indicator, less subject to false swings.
It calculates the distance of the current closing price as it relates to the median of the high/low range of price.
The SMI has a normal range of values between +100 and -100.
When the present closing price is higher than the median, or midpoint value of the high/low range, the resulting value is positive.
When the current closing price is lower than that of the midpoint of the high/low range, the SMI has a negative value.
Here I have reverse engineered the SMI formula to derive 2 functions.
One function calculates the chart price at which the SMI will reach a particular SMI scale value.
The second function calculates the chart price at which the SMI will crossover its signal line.
I have employed those functions here to give the "crossover" price levels for :
Upper alert level ( default 40, color : aqua blue )
Mid-Line ( default value 0, color : white )
Lower alert level ( default -40, color : purple )
Signal line ( default 13, colors : bright red & lime green )
And also to give the SMI eq price ( colors : red & green )
The midline, upper and lower alert levels return the closing price which would make SMI equal to their respective values
The user can infer from this that.....
Closing above these prices will cause the Stochastic Momentum Index to cross above the associated levels
Closing below these prices will cause the Stochastic Momentum Index to cross below the associated levels
Signal line returns the closing price where Stochastic Momentum Index is equal to its signal line
The user can infer from this that.....
Closing above this price will cause the Stochastic Momentum Index to cross above the signal line
Closing below this price will cause the Stochastic Momentum Index to cross below the signal line
SMI eq price returns the closing price which would make the SMI equal to its previous value
The user can infer from this that.....
Closing above this price will cause the Stochastic Momentum Index to increase
Closing below this price will cause the Stochastic Momentum Index to decrease
Note : all returned prices have a returned value filter to replace any values below zero with zero to help prevent auto focus issues.
These levels are displayed as plotted lines on the chart and also as an optional infobox with choice of displayed info.
This allows the user to see directly on the chart the interplay between the various crossover levels and price action and to precisely plan entries, exits and stops for their SMI based trades.
Traditionally traders and analysts will consider:
Positives values above 40 indicate a bullish trend
Negative values below -40 indicate a bearish trend .
Common traditional ways to derive signals from the SMI :
When the SMI crosses below -40 and then moves back above it, a buy signal is generated.
When the SMI crosses above +40 and then moves back below it, a sell signal is generated.
When the SMI line crosses above the signal line. A signal to buy is generated
When the SMI line crosses below the signal line signal to sell is generated.
When the SMI crosses above the zeroline, signal line and the SMI eq level many interpret that as a full bullish bias signal and take trades only in that direction, vice versa for bearish bias.
Traders also look for divergences between the SMI and price action.
The SMI is often used in conjunction with the Chande Momentum Oscillator or R squared indicator to determine overall market trendiness where the SMI is used to determine the direction of the trend, and also with volume indicators to show if the momentum carries significant selling or buying pressure.

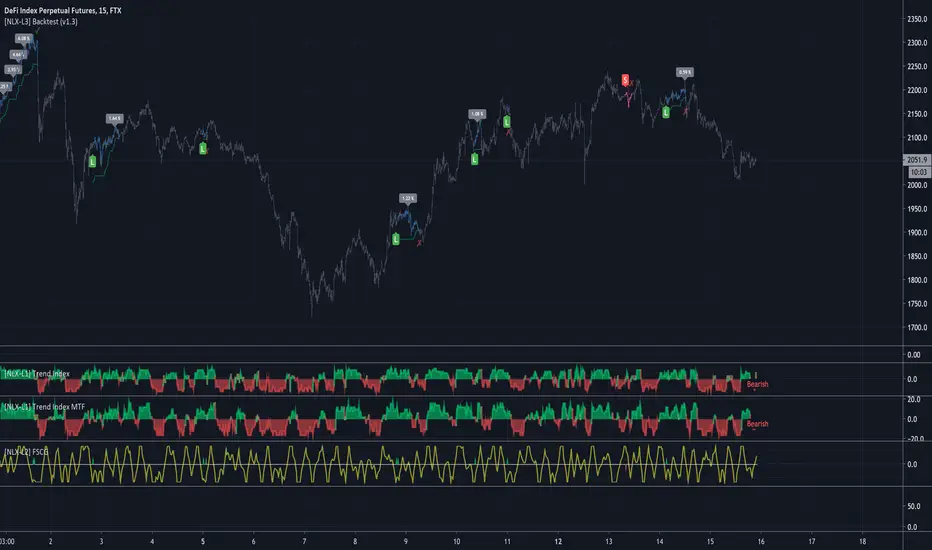
[NLX-L1] Trend Index- NLX Modular Trading Framework -
This module is build upon the Trend Index by Mango2Juice (thanks for your permission to use the source!)
It includes all the common indicators and creates a positive or negative score, which can be used with my Modular Trading Framework and linked to an entry/exit indicator.
SuperTrend
VWAP Bands
Relative Strength Index ( RSI )
Commodity Channel Index ( CCI )
William Percent Range (WPR)
Directional Movement Index (DMI)
Elder Force Index ( EFI )
Momentum
Demarker
Parabolic SAR
... and more
- Getting Started -
1. Add this Trend Index to your Chart
2. Add one of my Indicator Modules to your Chart, such as the QQE++ Indicator
3. In the QQE Indicator Settings combine it with the Trend Index (and choose L1 Type)
4. Optional: Add the Noise Filter , and in the Noise Filter Settings you select the QQE Indicator as combination (and choose L2 for Type)
5. Add the Backtest Module to your Chart
6. Select the Noise Filter in the Backtest Settings
Indicator modules can be combined in many different ways in my framework - have fun!
- Alerts for Automated Trading -
The alerts module is coming soon and you will be able to create alerts to automated your trades.
See my signature below for more information.
Force Index// 2020.7.30 version
// This indicator is for the second filter in Triple Screen Trading System
// force index will combine volume and price together to decide the power of price change
// force index = volume * (Change of Price)
// try to smooth the series of force index by ema force index
// Method to use this index
// This indicator is for the second filter in Triple Screen Trading System
// if Trend is bull, long when force index is below 0
// if Trend is bear, short when force index is above 0
// As for how to decide bullish market or bearish market, please check it according to the first filter of Triple Screen Trading System

Force IndexWhat is the force index ?
The force index is an oscillator used to confirm price breakout strengths and identify potential trends.
It was popularized by A. Elder.
How the force index is computed ?
Knowing that volume is the fuel of a price movement, reliable breakouts and trend continuation are more likely to occur on high volume breakouts. This is why the force index is computed with the intensity of the price movement, and it's volume , using the formula ema13((close(n) - close(n-1)) * volume ) .
How to use the force index
An important change in the force index indicate a strong momentum in the price action.
You can read more about the force index interpretation on Investopedia
Customization
You can display the indicator as an histogram, or as a line chart.
You can change EMA length, although it's recommended to keep it at default value.

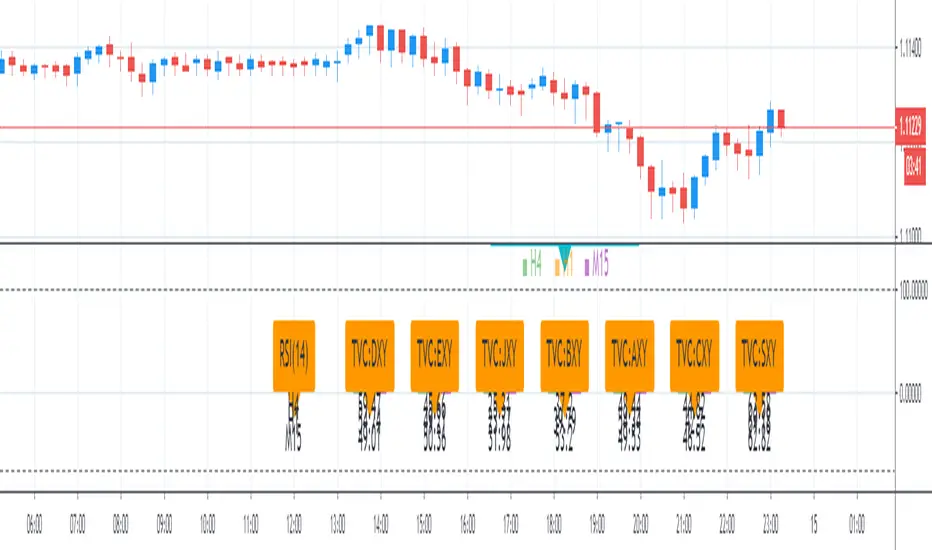
Currency Relative Strength IndexCurrency Relative Strength Index
This scripts show current RSI value and histogram of 7 Currency index on 3 time frame: 4H, 1H, 15M
//=== RSI Function ===\\
rsi_period=input(14)
M15_RSI( sym ) =>
M15_RSI = security( sym , "15", rsi (close,rsi_period))
H1_RSI( sym ) =>
H1_RSI = security( sym , "60", rsi (close,rsi_period))
H4_RSI( sym ) =>
H4_RSI = security( sym , "240", rsi (close,rsi_period))
//=== Currency Index ===\\
1. DXY - USD Index - U.S. Dollar Index
2. EXY - EUR Index - Euro Currency Index
3. JXY - JPY Index - Japanese Yen Index
4. BXY - GBP Index - British Pound Index
5. AXY - AUD index - Australian Dollar Index
6. CXY - CAD Index - Canadian Dollar Index
7. SXY - CHF Index - Swiss Franc Currency Index
Open Interest Money Flow Index (OIMFI)CAUTION : This system was inspired from seiglerj' s "Money Flow Index " script. Open Interests are used instead of volume.
What is the Money Flow Index ( MFI )?
The Money Flow Index ( MFI ) is a technical oscillator that uses price and volume for identifying overbought or oversold conditions in an asset. It can also be used to spot divergences which warn of a trend change in price. The oscillator moves between 0 and 100.
Unlike conventional oscillators such as the Relative Strength Index ( RSI ), the Money Flow Index incorporates both price and volume data, as opposed to just price. For this reason, some analysts call MFI the volume-weighted RSI .
What Does the Money Flow Index ( MFI ) Tell You?
One of the primary ways to use the Money Flow Index is when there is a divergence. A divergence is when the oscillator is moving in the opposite direction of price. This is a signal of a potential reversal in the prevailing price trend.
For example, a very high Money Flow Index that begins to fall below a reading of 80 while the underlying security continues to climb is a price reversal signal to the downside. Conversely, a very low MFI reading that climbs above a reading of 20 while the underlying security continues to sell off is a price reversal signal to the upside.
Traders also watch for larger divergences using multiple waves in the price and MFI . For example, a stock peaks at $10, pulls back to $8, and then rallies to $12. The price has made two successive highs, at $10 and $12. If MFI makes a lower higher when the price reaches $12, the indicator is not confirming the new high. This could foreshadow a decline in price.
The overbought and oversold levels are also used to signal possible trading opportunities. Moves below 10 and above 90 are rare. Traders watch for the MFI to move back above 10 to signal a long trade, and to drop below 90 to signal a short trade.
Other moves out of overbought or oversold territory can also be useful. For example, when an asset is in an uptrend, a drop below 20 (or even 30) and then a rally back above it could indicate a pullback is over and the price uptrend is resuming. The same goes for a downtrend. A short-term rally could push the MFI up to 70 or 80, but when it drops back below that could be the time to enter a short trade in preparation for another drop .
Reference : www.investopedia.com
WARNING :
** Since each instrument in the list has its own unique contract data, you must first enter its name to display it. I recommend you to select OANDA from the markets. Finally, when the COT reports are issued, it may repaints. However, this repaint is usually close to closing or after close .(When COT reports are so sharp ) So use this script only 1W ( 1 week ) or 1 M ( 1 month ) timeframe.
** This data is taken to Tradingview with the help of Quandl. This is a very low possibility, but the system will not work if there is a malfunction.
FEATURES :
*** Working with all futures (Including : Bitcoin )
*** If you dont work with "Futures" , you can select "Others" from switchable menu and use volume for all instruments.
*** New generation elegant design used : Adaptive coloring Overbought - Oversold Levels according to the closing price.
NOTE : This code is open source under the MIT License. If you have any improvements or corrections to suggest, please send me a pull request via the github repository github.com
Stay tuned. Best wishes !

Herrick Payoff IndexThe Herrick Payoff Index is designed to show the amount of money flowing into or out of a futures contract. The Index uses open interest during its calculations, therefore, the security being analyzed must contain open interest.
The Herrick Payoff Index was developed by John Herrick.When the Herrick Payoff Index is above zero, it shows that money is flowing into the futures contract (which is bullish). When the Index is below zero, it shows that money is flowing out of the futures contract (which is bearish).
The interpretation of the Herrick Payoff Index involves looking for divergences between the Index and prices.

Smart Index Levels — GSK-VIZAG-AP-INDIA📌 Smart Index Levels — GSK-VIZAG-AP-INDIA
Smart Index Levels is a versatile support and resistance plotting tool designed for intraday, weekly, and monthly analysis.
It automatically generates key price zones based on user-defined step sizes, helping traders visualize important market levels more clearly.
🔹 Features
Daily / Weekly / Monthly Modes
Switch easily between daily, weekly, or monthly reference levels.
Customizable Level Steps
Choose step intervals of 50 or 100 points for cleaner index-based zones.
Support & Resistance Zones
Auto-draws multiple support and resistance levels around the opening base price.
Mid-Level Marking
Highlights the nearest “mid” price level for balance reference.
Weekly High/Low Tracking (Optional)
Plots dynamic weekly high & low levels with dotted lines.
Monthly High/Low Tracking (Optional)
Displays monthly high & low levels for broader market context.
Custom Market Session Timing
Define your own market open and close times.
Line Style & Colors
Fully customizable line styles (solid, dashed, dotted) and colors.
⚙️ How It Works
At the start of the selected session (daily, weekly, or monthly), the script identifies the opening reference price.
From this base, it calculates and draws support and resistance levels at fixed step intervals.
Optionally, it overlays weekly and monthly high/low levels for additional perspective.
This provides a structured price map that helps you quickly spot potential reaction zones, without cluttering the chart.
🖥️ Best Use Cases
Intraday index traders who want quick reference levels (Nifty, BankNifty, etc.)
Swing traders who prefer weekly and monthly zones for context.
Anyone looking for clean, rule-based support/resistance plotting.
⚠️ Disclaimer
This indicator is for educational and informational purposes only.
It does not provide financial advice or trading signals. Always use in combination with your own analysis and risk management.

Trend Strength Index Long Strategy📈 Trend Strength Index Long Strategy
This strategy combines the Trend Strength Index (TSI) with a Volume-Weighted Moving Average (VWMA) to identify high-probability long entries based on trend momentum and price confirmation.
📊 TSI Calculation : Measures correlation between price and time (bar index) over a user-defined period. Strong TSI values indicate trend momentum.
📏 VWMA Filter : Confirms bullish bias when price is above the VWMA.
🚀 Entry Condition : Long position is triggered when TSI crosses above -0.65 and price is above VWMA.
🔒 Exit Condition : Position is closed when TSI crosses above 0.65.
🎨 Visuals : Gradient fills highlight bullish and bearish zones. VWMA is plotted for trend context.
🧮 TSI Length: Adjustable (default 14)
📐 VWMA Length: Adjustable (default 55)
💸 Commission: 0.1% per trade
📊 Position Size: 75% of equity
⚙️ Slippage: 10 ticks
✅ Best used in trending markets with steady momentum.
⚠️ Avoid in choppy or range-bound conditions.

Momentum Index [BigBeluga]The Momentum Index is an innovative indicator designed to measure the momentum of price action by analyzing the distribution of positive and negative momentum values over a defined period. By incorporating delta-based calculations and smoothing techniques, it provides traders with a clear and actionable representation of market momentum dynamics.
🔵 Key Features:
Delta-Based Momentum Analysis:
Calculates the momentum of price by comparing its current state to its value from a defined number of bars back.
Inside a loop, it evaluates whether momentum values are above or below zero, producing a delta value that reflects the net momentum direction and intensity.
Double EMA Smoothing:
Smooths the raw delta-based momentum values with a double EMA filter, reducing noise and providing a clearer trend signal.
tmi(len) =>
sum = 0.0
sum1 = 0.0
above = 0.0
below = 0.0
src_ = src - src
for i = 0 to len
sum := sum + (src_ > nz(src_ ) ? 1 : -1)
sum1 := sum1 + (sum > 0 ? 1 : -1)
sum1 := emaEma(sum1, 10)
for i = 1 to len
above := above + (sum1 > 0 ? 1 : 0)
below := below + (sum1 > 0 ? 0 : 1)
Directional Momentum Signals:
Generates momentum shift signals and displays them on both the oscillator and the main chart:
- △ Aqua Triangles: Represent upward momentum shifts.
- ▽ Red Triangles: Represent downward momentum shifts.
Dynamic Gradient Display:
Highlights momentum zones with gradient fills:
- Aqua shades for positive momentum (above zero).
- Red shades for negative momentum (below zero).
Dashboard Display:
A dashboard summarizing the count of momentum values above and below zero for the defined period (Sentiment Length e.g. 100), helping traders assess market sentiment at a glance.
🔵 How It Works:
The indicator takes price momentum as its source and evaluates the number of momentum values above and below zero within a defined period.
The delta calculation aggregates this information, providing a net representation of the prevailing market momentum.
A double EMA filter is applied to the delta values, smoothing the momentum line and enhancing signal clarity.
Momentum shifts are highlighted with visual signals on the oscillator and price chart, while the gradient display provides a visual representation of intensity.
🔵 Use Cases:
Momentum Tracking: Identify whether market momentum is predominantly bullish or bearish.
Signal Confirmation: Use chart-based signals to confirm potential trend reversals or continuation.
Analyze Market Strength: Leverage the dashboard to quickly assess the distribution of momentum over the chosen period.
Overbought/Oversold Conditions: Utilize gradient zones to detect areas of momentum extremes and possible price exhaustion.
Momentum Index offers a refined approach to analyzing momentum dynamics, combining delta-based calculations with smoothing techniques and intuitive visuals, making it an essential tool for traders looking to anticipate market movements effectively.

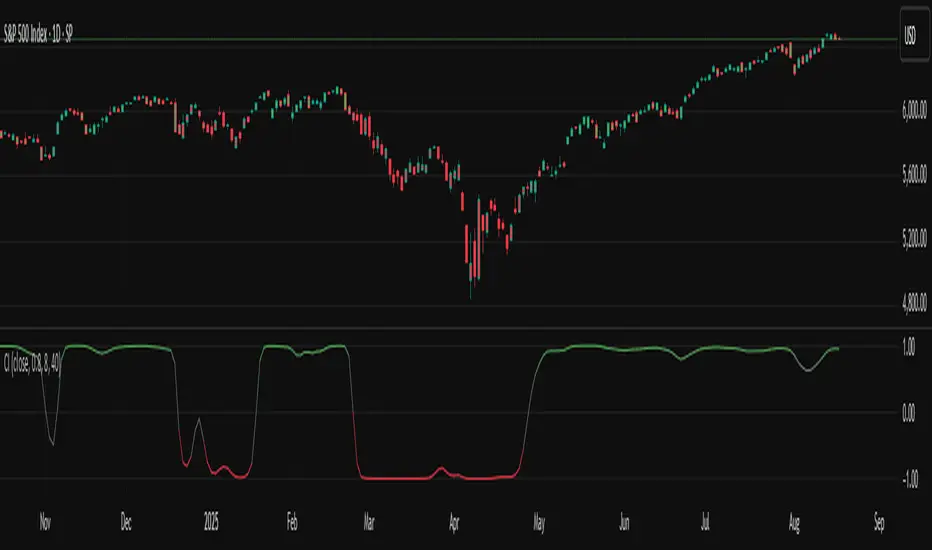
TASC 2025.09 The Continuation Index
█ OVERVIEW
This script implements the "Continuation Index" as described by John F. Ehlers in the September 2025 edition of TASC's Trader's Tips . The Continuation Index uses Laguerre filters (featured in the July 2025 edition) to provide an early indication of trend direction, continuation, and exhaustion.
█ CONCEPTS
The idea for the Continuation Index was formed from an observation about Laguerre filters. In his article, Ehlers notes that when price is in trend, it tends to stay to one side of the filter. When considering smoothing, the UltimateSmoother was an obvious choice to reduce lag. With that in mind, The Continuation Index normalizes the difference between UltimateSmoother and the Laguerre filter to produce a two-state oscillator.
To minimize lag, the UltimateSmoother length in this indicator is fixed to half the length of the Laguerre filter.
█ USAGE
The Continuation Index consists of two primary states.
+1 suggests that the trader should position on the long side.
-1 suggests that the user should position on the short side.
Other readings can imply other opportunities, such as:
High Value Fluctuation could be used as a "buy the dip" opportunity.
Low Value Fluctuation could be used as a "sell the pop" opportunity.
█ INPUTS
By understanding the inputs and adjusting them as needed, each trader can benefit more from this indicator:
Gamma : Controls the Laguerre filter's response. This can be set anywhere between 0 and 1. If set to 0, the filter’s value will be the same as the UltimateSmoother.
Order : Controls the lag of the Laguerre filter, which is important when considering the timing of the system for spotting reversals. This can be set from 1 to 10, with lower values typically producing faster timing.
Length : Affects the smoothing of the display. Ehlers recommends starting with this value set to the intended amount of time you plan to hold a position. Consider your chart timeframe when setting this input. For example, on a daily chart, if you intend to hold a position for one month, set a value of 20.
Dynamic Threshold Money Flow Indexi thought this script was a clever idea, but the more i tried to improve it, the worse it seemed to get.
the idea behind this script was to build a context around a Money Flow Index that changes based on market conditions.
the width of the channel is controlled by a combination of the choppiness index and an inverted, normalized, absolute value of the ROC. when the market begins trending, the channel narrows, making the MFI more likely to break out of the channel in the direction of the emerging trend. as the market becomes more choppy and the trend diminishes, the channel widens, recapturing the MFI.
my initial hopes for this script was that the context-based thresholds would spare the user from choppy markets, but perhaps i need to make the channel non-linear.

[c3s] CWS - M2 Global Liquidity Index & BTC Correlation CWS - M2 Global Liquidity Index with Offset BTC Correlation
This custom indicator visualizes and analyzes the relationship between the global M2 money supply and Bitcoin (BTC) price movements. It calculates the correlation between these two variables to provide insights into how changes in global liquidity may impact Bitcoin’s price over time.
Key Features:
Global M2 Liquidity Index Calculation:
Fetches M2 money supply data from multiple economies (China, US, EU, Japan, UK) and normalizes using currency exchange rates (e.g., CNY/USD, EUR/USD).
Combines all M2 data points and normalizes by dividing by 1 trillion (1e12) for easier visualization.
Offset for M2 Data:
The offset parameter allows users to shift the M2 data by a specified number of days, helping track the influence of past global liquidity on Bitcoin.
BTC Price Correlation:
Computes the correlation between shifted global M2 liquidity and Bitcoin (BTC) price, using a 52-day lookback period by default.
Correlation Quality Display:
Categorizes correlation quality as:
Excellent : Correlation >= 0.8
Good : Correlation >= 0.6 and < 0.8
Weak : Correlation >= 0.4 and < 0.6
Very Weak : Correlation < 0.4
Displays correlation quality as a label on the chart for easy assessment.
Visual Enhancements:
Labels : Displays dynamic labels on the chart with metrics like M2 value and correlation.
Plot Shapes : Uses shapes to indicate data availability for global M2 and correlation.
Data Table : Optionally shows a data table in the top-right corner summarizing:
Global M2 value (in trillions)
The correlation between global M2 and BTC
The correlation quality
Optional Debugging:
Debug plots help identify when data is missing for M2 or correlation, ensuring transparency and accurate functionality.
Inputs:
Offset: Shift the M2 data (in days) to see past liquidity effects on Bitcoin.
Lookback Period: Number of periods (default 52) used to calculate the correlation.
Show Labels: Toggle to show or hide labels for M2 and correlation values.
Show Table: Toggle to show or hide the data table in the top-right corner.
Usage:
Ideal for traders and analysts seeking to understand the relationship between global liquidity and Bitcoin price. The offset and lookback period can be adjusted to explore different timeframes and correlation strengths, aiding more informed trading decisions.

Trend Strength Index - ZTFThis is a modification of TradingView's default Trend Strength Index indicator.
The Trend Strength Index measures the tendency of a symbol to either trend steadily or to revert to its mean. The core idea behind TSI is that the more momentum a symbol has relative to its volatility, the more likely it is to follow a trend and less likely to revert to its mean.
This indicator analyzes price momentum using the Pearson correlation coefficient, a normalized measure of the linear relationship between time series. Its output shows the correlation between the chart's closing prices and bar index values over a defined number of bars.
A value near +1 shows that prices experienced relatively steady increases across successive bars, indicating high upward trend strength
A value near -1 shows that prices experienced relatively steady decreases across successive bars, indicating high downward trend strength
A value near 0 suggests a lack of trend strength, because prices did not demonstrate a steady positive or negative relationship with the bar index
ZTF Modification: Added a green background highlight that appears when TSI reaches 0.90 or above, providing a visual alert for extremely strong bullish trend conditions.
Credit: Based on TradingView's default Trend Strength Index indicator.

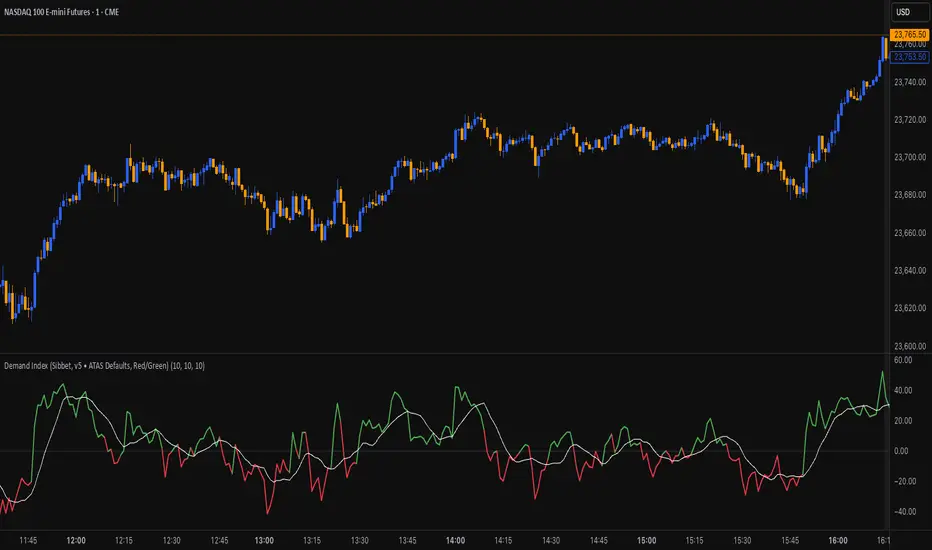
Demand Index (James Sibbet)This indicator is a faithful implementation of James Sibbet’s Demand Index — a leading volume-price oscillator designed to anticipate trend reversals, confirm momentum, and highlight divergences between price and volume pressure.
Key Features
• Original Sibbet Formula with H + L + 2C price input and 0.375 exponential factor.
• Buy/Sell Power Calculation with EMA smoothing (ATAS default settings).
• Demand Index SMA for trend confirmation.
• Zero-Line Centering for quick bullish/bearish identification.
• Red/Green Coloring for immediate sentiment visualization.
How to Use
1. Above Zero → Bullish pressure dominates (green).
2. Below Zero → Bearish pressure dominates (red).
3. Divergences → Price making new highs/lows without confirmation in DI often precedes reversals.
4. Use DI SMA for signal smoothing and better trend filtering.
Smart Money Proxy IndexOverview
The Smart Money Proxy Index (SMPI) is an educational tool that attempts to identify potential institutional-style behavior patterns using publicly available market data. This comprehensive tool combines multiple institutional analysis techniques into a single, easy-to-read 0-100 oscillator.
Important Disclaimer
This is an educational proxy indicator that analyzes volume and price patterns. It cannot identify actual institutional trading activity and should not be interpreted as tracking real "smart money." Use for educational purposes and combine with other analysis methods.
Inspiration & Methodology
This indicator is inspired by MAPsignals' Big Money Index (BMI) methodology but uses publicly available price and volume data with original calculations. This is an independent educational interpretation designed to teach smart money concepts to retail traders.
What It Analyzes
SMPI tracks potential "smart money" activity by combining:
Block Trading Detection - Identifies unusual volume surges with significant price impact
Money Flow Analysis - Volume-weighted price pressure using Money Flow Index
Accumulation/Distribution Patterns - Modified On-Balance Volume signals
Institutional Control Proxy - End-of-day positioning and control analysis
Key Features
– Multi-Component Analysis - Combines 4 different institutional detection methods
– BMI-Style 0-100 Scale - Familiar oscillator range with clear extreme levels
– Professional Visualization - Dynamic colors, gradient fills, and clean data table
– Comprehensive Alerts - Buy/sell signals plus divergence detection
– Fully Customizable - Adjust all parameters, colors, and display options
– Non-Repainting Signals - All alerts use confirmed data for reliability
– Educational Focus - Designed to teach institutional flow concepts
How to Interpret
Above 80: Potential smart money distribution phase (bearish pressure)
Below 20: Potential smart money accumulation phase (bullish opportunity)
Signal Generation: Buy signals when crossing above 20, sell signals when crossing below 80
Divergences: Price vs SMPI divergences can signal potential trend changes
Volume Confirmation: Higher volume ratios strengthen signal reliability
Best Practices
Timeframes: Works best on higher timeframes for institutional behavior analysis
Confirmation: Combine with other technical analysis tools and market context
Volume: Pay attention to volume confirmation in the data table
Context: Consider overall market conditions and fundamental factors
Risk Management: Not recommended as standalone trading system
Customizable Parameters
Block Volume Threshold: Sensitivity for unusual volume detection (default: 2.5x average)
SMPI Smoothing Period: Index calculation smoothing (default: 25 bars)
Extreme Levels: Overbought/oversold thresholds (default: 80/20)
Money Flow Length: MFI calculation period (default: 14)
Visual Options: Colors, signals, and display preferences
Available Alerts
Buy Signal: SMPI crosses above oversold level (20)
Sell Signal: SMPI crosses below overbought level (80)
Extreme Levels: Alerts when reaching overbought/oversold zones
Divergence Detection: Bullish and bearish price vs SMPI divergences
Educational Purpose & Limitations
This indicator is designed as an educational proxy for understanding institutional flow concepts. It analyzes publicly available price and volume data to identify potential smart money behavior patterns.
Cannot access actual institutional transaction data
Signals may be slower than day-trading indicators (intentionally designed for institutional timeframes)
Should be used in conjunction with other analysis methods
Past performance does not guarantee future results
What Makes This Different
Unlike simple volume or momentum indicators, SMPI combines multiple institutional analysis techniques into one comprehensive tool. The multi-component approach provides a more robust view of potential smart money activity.
