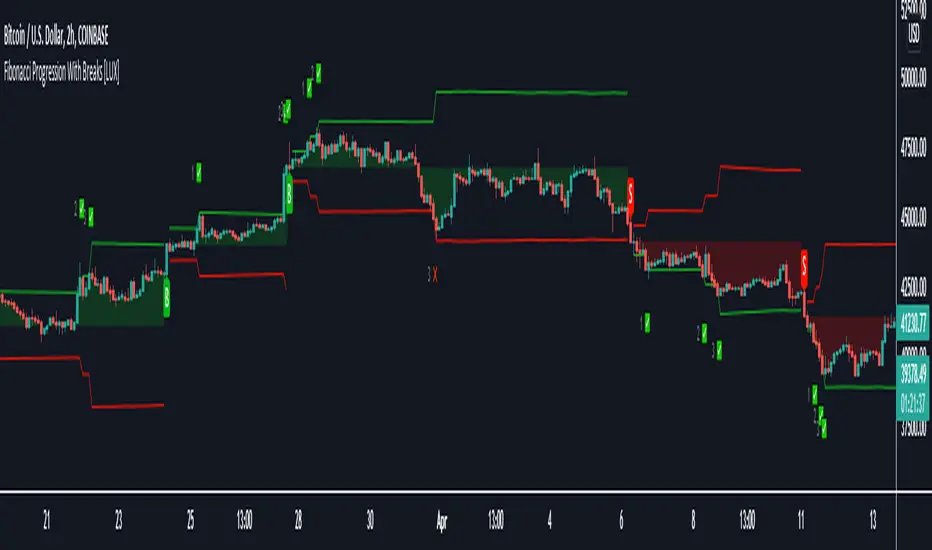
Fibonacci Progression with Breaks [LuxAlgo]This indicator highlights points where price significantly deviates from a central level. This deviation distance is determined by a user-set value or using a multiple of a period 200 Atr and is multiplied by successive values of the Fibonacci sequence.
Settings
Method: Distance method, options include "Manual" or "Atr"
Size: Distance in points if the selected method is "Manual" or Atr multiplier if the selected method is "Atr"
Sequence Length: Determines the maximum number of significant deviations allowed.
Usage
The indicator allows highlighting potential reversal points, but it can also determine trends using the central level, with an uptrend detected if the central level is higher than its previous value and vice versa for a downtrend.
When an uptrend is detected, and the price deviates significantly upward from it a first checkmark will be highlighted alongside the Fibonacci sequence used as a multiplier, if the price deviates downward, a cross will be shown instead, then the distance threshold will be multiplied by the next value in the Fibonacci sequence.
If the price deviates from the central level such that the length of the sequence is greater than the user set Sequence Length , a break label will be shown alongside a new central level with a value determined by the current closing price, while the Fibonacci multiplier will be reset to 1.
Upper and lower extremities made from the central level and threshold distance are highlighted and can be used as support and resistances.
Signal
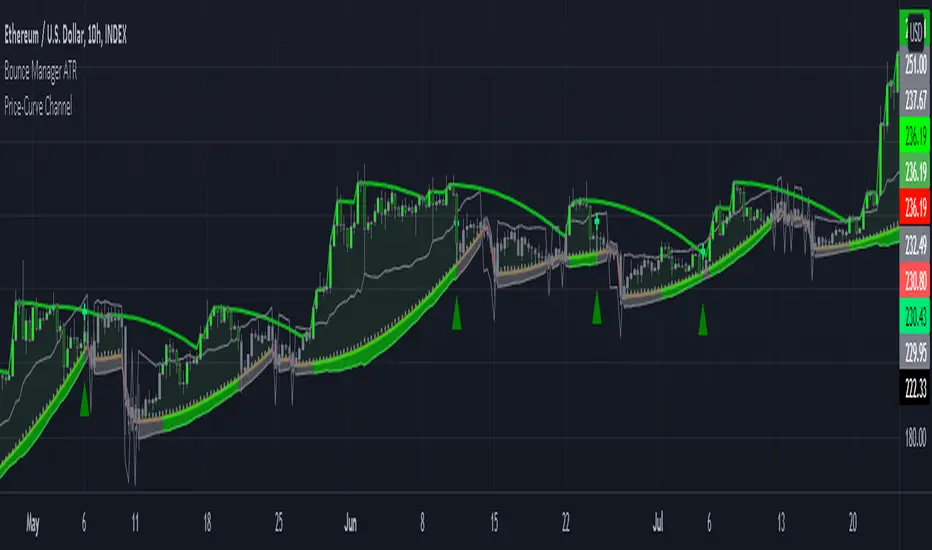
Bounce Manager ATRThis is a tool to turn any line or indicator into a signaller from bounces from the source line.
The ATR version is build to specify what would be considered a worthy entry from the line using ATR multiplier values as inputs.
COMPONENTS:
- Max violation: When price moves past this the script will no longer look for entry until a new trend has been established. The line can also be used as a stop loss.
- Confirmation line: When price touches the line during a trend it
will wait to cross over this line to confirm a reaction from the line.
- Min past distance: A trend filtering system, this is a distance from
the line price has to break to confirm trend direction.
- Stop loss: This can be set to a percentage distance from the low after
bounce. Or it can be set to the max violation line
- Take profit: This can be a fixed take profit target or a risk to reward
based take profit. With risk to reward it will multiply the stop loss
distance by the input and use that to create target (green cross)
- ATR based or % based: there are 2 versions of the script, one for strict
percentage based logic and another one based on ATR values
In bounce manager v1 these stop loss and take profit targets are there only for plotting and visual backtesting purposes. Right now it can only send long and short signals.
Part of the Honest Algo service.
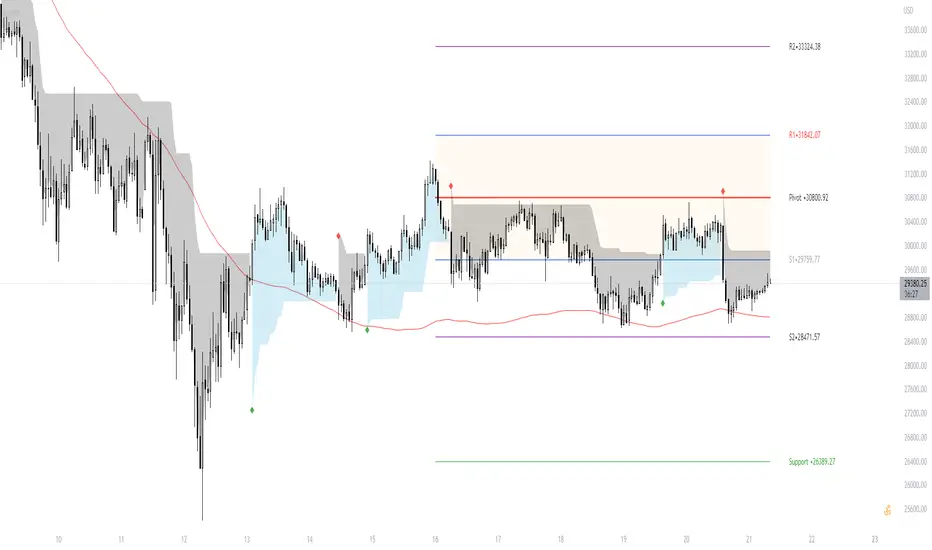
[TT] Daily Levels
These pivots are based on calculations that i have been using for quite some time. I'm sure There is no need to explain on how to use pivots.
Labels are given to understand and you can Msg me here or comment if u need any explanation.
I have given few examples below.. check i t out
XAUUSD
BTCUSD
Nifty
Banknifty
customConfluenceSimplifiedThis indicator is intended to automatically search for confluence on a variety of indicators and conditions, highly customizable parameters, including Take profits, stop losses and classic indicator adjustments.
Best results in BTCUSDT 15m and 1H, but feel free to optimize it on any pair and timeframe. I don't recommend using it in non crypto assets.
Alerts are fully customizable too. You can put any alert() (buy/sell) to any pair.
I intended to maximize quality of signals over quantity. But anyway you can customize a lot of parameters to make it more frequent.
DM me for access.
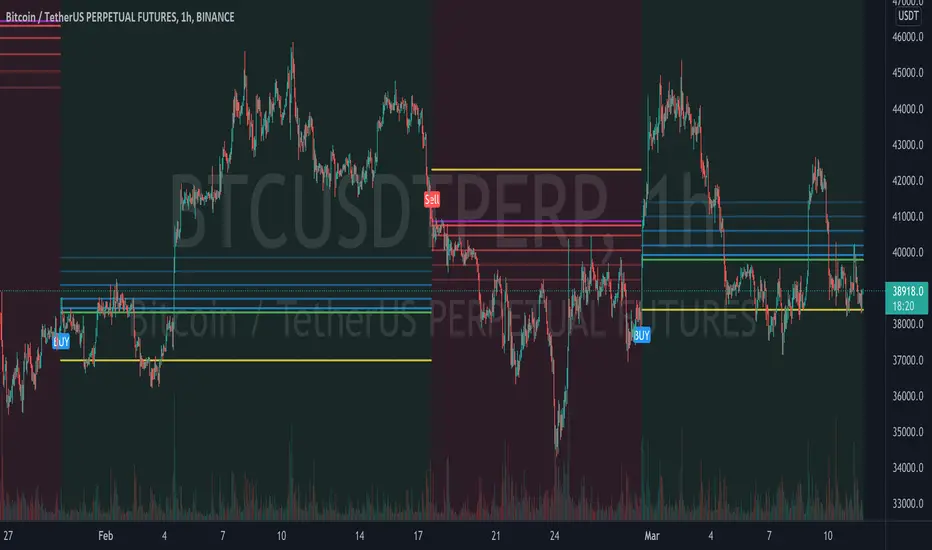
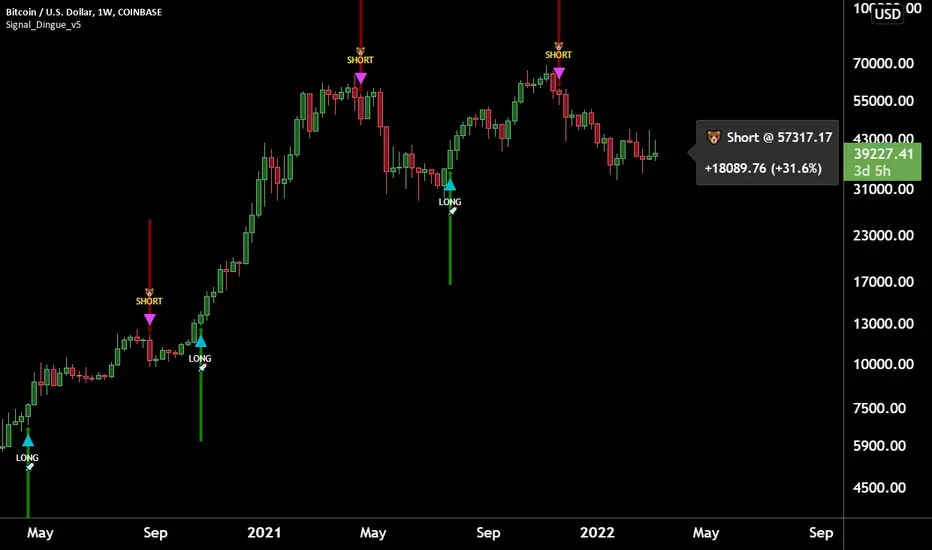
Trading Assistant DiNGUETrading Assistant DiNGUE This indicator is like a trading assistant for your charts.
It helps set your biases and emotions aside and lets you focus on managing trades in an easy visual way.
Get various types of signals to enter your trades (either Long or Short). Then use take profits, stops, or the opposite signal to exit trades.
The signals are created from various indicators and sensibility options you can customize any way you want. Works on every timeframe.
You can customize every setting or used the preset ones. Preset settings adjust automatically based on the timeframe you are using on the chart.
The 12 Indicators are Volume - RSI - Stochastic - MacD - Moving Averages (MA) - Rate of Change (ROC) - ADX DMI Directional Movement Index - On Balance Volume (OBV) - Bollinger Bands - VWAP - ATR - Parabolic SAR.
Every indicator can be turned On or Off.
You can adjust the way it creates signals by selecting either 'rise-fall', 'crosses' or by combining both.
You can select the sensitivity of the signal from Normal - Safe - Safer.
You can adjust lengths or use the preset ones.
There are also additional options for each indicator, you can filter weak levels for ADX, filter for tight bands, have ROC above 0…
You can also plot several of those indicators on the screen. 2x Moving Averages, 2x VWAP, 2x ATR, 2x SAR for even easier visualization of the trend.
You can also plot fractals to facilitate once again on trend visualization. Higher high, lower low, higher low, lower high.
Trade with the Trend and Safe Trades:
If you want to have a higher chance of success, you can trade with the trend. First, select the trend timeframe you would like to use. Let's say the “Weekly” trend. Meaning it will generate a signal on the weekly timeframe and based on the result (Long or Short) it will only take trades in that direction. So the trend is LONG on the Weekly and you get a “Long” signal, it will take it. “Short” signals on the other hand will be treated as “stops” and won’t want to go against the trend by going ‘short’.
Safe Trend works in the same manner, but instead of using the signal on a bigger timeframe, it uses an indicator as to the deciding factor. Let's say you select the 200SMA as the “Safe signal”. The indicator will only go “Long” when above the 200SMA and “Short” under the 200SMA. Otherwise, it will put a stop instead of going against the trend.
Stop Loss:
There are 4 different types of stop-loss that you can use at the same time.
- Indicator Stop
- Fib stop
- Fix % stop
- Trailing stop
You can plot the stops directly on the chart AND OR add them to the panel for an easy visualization once again.
With the ‘indicator stop’, you can select one of the two: MA ATR SAR VWAP as a stop.
Fib stop, it uses fib numbers to calculate a stopping point.
Fix %, you can select your max loss in percent. Could be 2%, 5%
A trailing stop is like a fixed stop but that will trail as the price moves in the right direction.
Take Profit:
There are 4 different types of take profit that you can use simultaneously.
- Fix % Take Profit
- ATR multiple Take Profit
- Fib multiple Take Profit
- Bollinger Band Take Profit
Fix % just let you set a fix take profit target in percent.
ATR multiple lets you select a target based on a multiple of the average true range.
Fib multiple lets you select a target based on a fib multiple
Bolling Band lets you take profit based on the Bollinger band settings you select.
Visual Panel:
The visual panel lets you see exactly how is the last trade progressing. It will give you the entry price, profit, stop, and target. You can turn it on or off, as is for the stop and target.
You can also decide to plot 1 position or more, you can even show all the possible signals, add backgrounds with colors. You can also plot the bigger Trend and Safe Signals explained above.
If you have any questions, suggestions, or comments, feel free to do so!
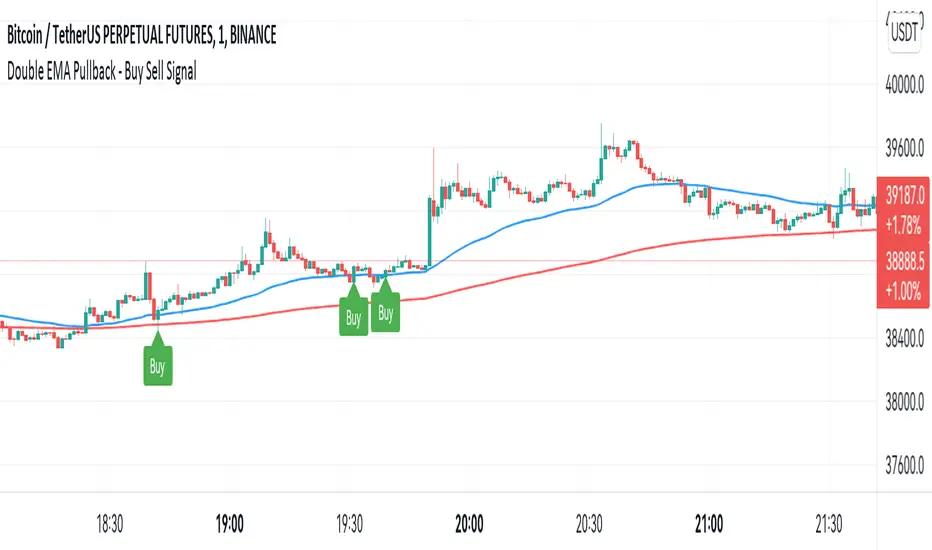
Double EMA WIth Pullback Buy Sell Signal - Smarter AlgoBuilt with love "Double EMA With Pullback Buy Sell Signal "
This indiator will help you to find a Double EMA Pullback Signal
You can combine with your own strategy, or use this purely
DISCLAIMER :
Measure the risk first before use it in real market
Backtest The Strategy was very important, so you know the probability
Fundamentally Logical :
Pullback (Some Previous candle is Red for Bull Pullback vice versa)
the Entry candle must be a Candlestick Pattern
Features :
1. Double EMA
2. Pullback Signal
How to use it :
1. Adjust the Pullback Backstep
2. Adjust the EMA Period
3. Adjust the Style to your preferences
Regards,
Hanabil
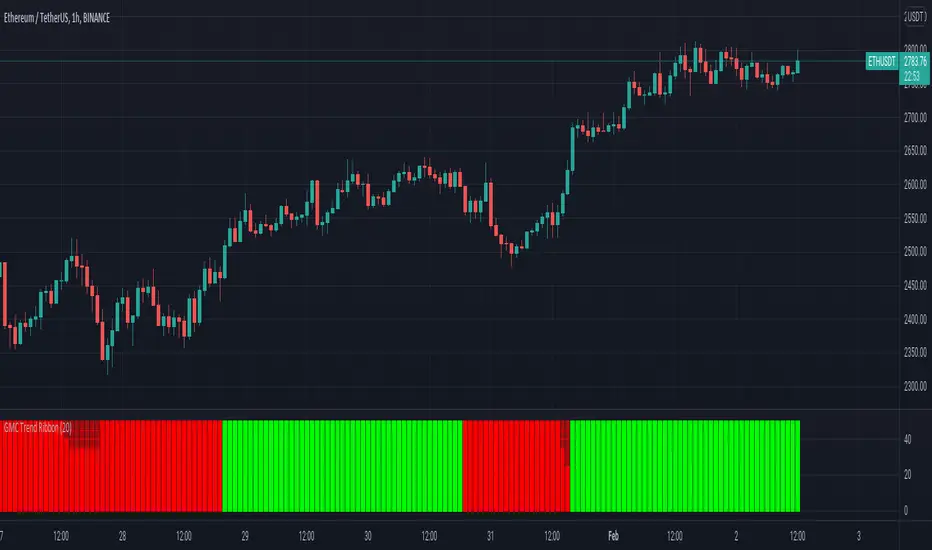
GMC Trend FilterAvoid Fake Signals, and identify the trend.
How it works ?
- it calculates main trend direction by using the length that is user-defined. so you can change it as you wish
- then it calculates trend direction for each 9 lower lengths. if you set the length = 20 then the lengths are 19, 18,...11
- and it checks if the trend directions that came from lower lengths is same or not with main trend direction.
- it changes the trend color of the ribbon.
P-Signal GravityP-Signal Gravity will help you choose a trading strategy, taking into account volatility and exchange commissions. The white circles indicate the probabilistic position of the virtual center of gravity. The reliability parameter determines the probability of finding such a center of gravity. The table shows the latest price and the expected P/L, taking into account the exchange commission, which is also a parameter. Due to the overlay type of indicator, the table also contains p-signal values and its increment.

NazhoThis is a simple scalping strategy that works for all time frames... I have only tested it on FOREX
It works by checking if the price is currently in an uptrend and if it crosses the 20 EMA .
If it crosses the 20 EMA and its in and uptrend it will post a BUY SIGNAL.
If it crosses the 20 EMA and its in and down it will post a SELL SIGNAL.
The red line is the highest close of the previous 8 bars --- This is resistance
The green line is the lowest close of the previous 8 bars -- This is support
+SuperTrend

Trendlines with Breaks [LuxAlgo]The trendlines with breaks indicator return pivot point based trendlines with highlighted breakouts. Users can control the steepness of the trendlines as well as their slope calculation method.
Trendline breakouts occur in real-time and are not subject to backpainting. Trendlines can however be subject to repainting unless turned off from the user settings.
The indicator includes integrated alerts for trendline breakouts.
🔶 USAGE
Any valid trendlines methodology can be used with the indicator, users can identify breakouts in order to infer future price movements.
The calculation method of the slope greatly affects the trendline's behaviors. By default, an average true range is used, returning a more constant slope amongst trendlines. Other methods might return trendlines with significantly different slopes.
Stdev makes use of the standard deviation for the slope calculation, while Linreg makes use of the slope of a linear regression.
The above chart shows the indicator using "Stdev" as a slope calculation method. The chart below makes use of the "Linreg" method.
By default trendlines are subject to backpainting, and as such are offset by length bars in the past. Disabling backpainting will not offset the trendlines.
🔶 SETTINGS
Length: Pivot points period
Slope: Slope steepness, values greater than 1 return a steeper slope. Using a slope of 0 would be equivalent to obtaining levels.
Slope Calculation Method: Determines how the slope is calculated.
Backpaint: Determine whether trendlines are backpainted, that is offset to past.

SMART4TRADER - BREAKOUTThis indicator shows the breakthrough of extremes for the selected period. The default period is set = 3
The indicator checks on the current bar whether the maximum or minimum prices for the selected period are broken
----------------
Данный индикатор показывает прорыв экстремумов за выбранный период. По-умолчанию выставлен период = 3
Индикатор проверяет на текущем баре пробиты ли максимальные или минимальные значения цен за выбранный период

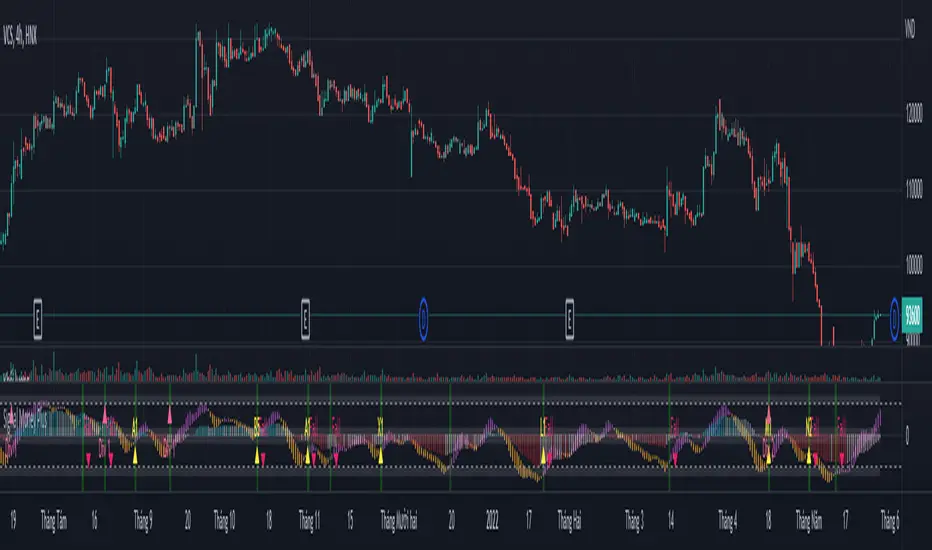
Signal Money PlusSignal Money Plus is a trend analysis indicator including Signal Money and Signal Money Plus.
Signal Money:
- Signal Money enters the overbought or oversold area and the price fluctuates around the strong support or resistance area, giving a reliable signal.
- Signal Money creates a divergence, and the price fluctuates around a strong support or resistance area, giving a reliable signal.
- The price fluctuates in a narrow range but the Signal Money correcting according to the elliott wave pattern gives a reliable signal.
Signal Money Plus:
- Money Plus > 0 for positive cash flow trend. Money Plus < 0 for negative cash flow trend. Money Plus fluctuates around -20 to 20, showing an accumulation trend waiting for a confirmation signal.
- Money Plus creates divergence for reliable signal
Use combination Signal Money Plus:
AJ Scalp Reversal Tops and Bottoms IndicatorReuploaded after TV took it down.
A free scalping reversal, top and bottom indicator. It prints signals in real time, and should be used for scalping.
Following candle will usually always follow the signal but from there closer management is required.
This script uses RSI, Volume, OBV, Pivots and a few more indicators to calculate the signals.
Use alongside other indicators and price action analysis for best results.
Only use on time frames above 1H, otherwise the signals fire too frequently.
*These signals are different compared to other scripts created by me

Bollinger Band Layer Entry (BBLE) The Bollinger Band Layer Entry Indicator uses plenty of Bollinger Bands to create an onion-looking layered indicator to help with layered entries. It is similar to a Ribbon but better. This indicator is best used with any volume-related indicator so you can recede from entering into any position with too much momentum to rebound off of any line. Note that this indicator is best used with another strategy like pair trading. It is not recommended to trade based on this indicator only. Please stay aware of any news about the stock you are trading because some events may have a big impact and force the market to go bullish/bearish by a lot. This indicator can be used with all chart types and works well with many other indicators. It allows for complete customization and offers easy-to-understand settings which can be designated to a certain individual. You can modify every single factor of the BBs which allows for an even more personalized and adapted Indicator that reflects your trading/ investing needs. You also have the option to choose which type of MAs will be used to create the Bollinger Bands , a few of which include: EMA, SMA, WMA, HMA, RMA, DMA, LSMA, VAMA, TMA, MF.
Bollinger Bands are a way to measure and visualize volatility. As volatility increases, the wider the bands become, and the more they deviate from the basis. Vice versa, when volatility decreases, the gap between the bands and basis decreases. Yet a big advantage for not only this but many other indicators is created due to the ample count of different settings that are widely used, it is difficult to view the market through the eyes of all types of investors/traders. This indicator manages to counter exactly this issue, you will be able to see all of these settings on one chart and at one time and enter/exit positions accordingly.
Using this indicator will allow you to visualize entries with ease and make order layering (buying/selling in layers) much more simple. You can choose a certain amount of Bollinger Bands you would like displayed and customize all technical and style-related settings related to each of the BBs separately.
A few of the technical settings you can change for each Bollinger Band are:
Bollinger Band count (Select how many BBs you want to be displayed.)
MA type used to make the Bollinger Bands (EMA, SMA, WMA, etc.)
Source (close, open, high, low.)
BB length (The length of each Bollinger Band, its lookback. How many previous candles should it be based on? Choose each Bollinger Band's lookback length.)
BB deviator (The standard Deviator applied for the BB for both the upper and lower line.)
Offset
A few of the style settings you can change for each Bollinger Band are:
Upper, Lower, Basis line opacity % (separate for each)
Upper, Lower, Basis line color (separate for each)
Fill (the color used to fill from the upper to the lower band) (separate for each)
Fill opacity % (the opacity used when filling the upper line to the lower line) (separate for each)
This indicator is unique because it can be used for all strategies and all trading styles, for example, day trading or long-term investing, really anything if used correctly. The reason it can be used in so many instances is a result of the detailed and in-depth settings tab that allows complete customization of each separate Bollinger Band. This allows the indicator to be used and to be useful in various situations and allows you to dominate the market. Integrated alerts also enhance your efficiency while using this indicator because you can choose to be notified at the crossing of any of the Bollinger Bands.
The technical part of this indicator plots the selected amount of Bollinger Bands using custom-built specified Bollinger Bands accordingly. Then it uses the style settings and styles it as you selected.

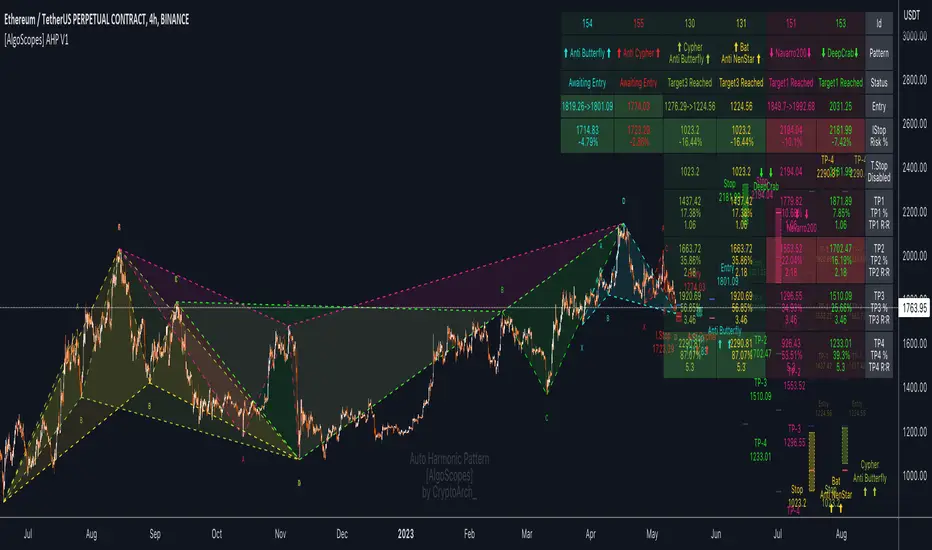
Auto Harmonic Pattern - PRO [AlgoScopes] V1Harmonic Patterns is a powerful tool for identifying potential reversal areas in the financial markets. Auto Harmonic Pattern Pro it is based on the work of Scott Carney, a renowned trader and author who developed the concept of harmonic patterns.
Scott Carney's extensive research and contributions have greatly enhanced our understanding of market patterns and their application in trading. Auto Harmonic Pattern Pro is adapted from Scott Carney's original work on harmonic patterns, as well as other sources that have contributed to the recognition and understanding of harmonic patterns beyond Carney's initial research.
Auto Harmonic Pattern Pro offers traders a valuable tool for identifying potential reversal zones in the markets. We would like to express our gratitude to Scott Carney for his pioneering work in developing harmonic patterns, as well as to the various contributors and sources that have expanded our knowledge and understanding of harmonic patterns beyond Carney's original research.
Remember to always practice proper risk management and combine the indicator's signals with other technical analysis tools for a comprehensive trading approach.
For more information about Scott Carney and his work on harmonic patterns, you can find additional resources on his official website.
💠 ABOUT THE SCRIPT
💎 DISPLAY
⚬ The following things are displayed by default on the chart
🔸 Live patterns in trade with XABCD labels. (filled major triangle)
🔸 Entry, Stop and Target levels on chart for all live patterns. Target level are dimmed along with reducing size when they become irrelevant
🔸 Open Trades Stat table - Show patterns ID, patterns name, status for patterns, size&age, Entry, I.Stop, T.Stop and Targets (TP1 - TP4).
⚬ Highlighted present stop (and/or trailing stop if is enabled) and next target
⚬ When there are multiple patterns on chart, Entry, Stop, and Target labels & lines & PRZ* boxes are created with specific distance from each other to provide clarity to the users
*(potential reversal zone)
⬜ SETTINGS
⚬ Let's talk about some of the settings. Almost all of these settings have already been optimized and tested over time, but for some tickers it might be better to do a new test.
💎 ZIGZAG
🔸 Length - Default is set to 8. User can change settings but it is a good idea to keep with fibonacci (5, 13, 21, 34, 55 etc)
🔸 Depth - This setting is for how many pivots indicator scan to find harmonic pattern. By default it is set as 200
🔸 Recursive Algorithm - Enabled will use recursive instead standard zigzag
💎 HARMONIC PATTERN SETTINGS
🔸 Trade Direction - Default is set to show all (bearish and bullish) harmonic patterns. Can be filtered to bullish or bearish direction.
🔸 Error Percent - Default is 8. That is error percent tolerance from perfect pattern ratio.
🔸 Maximum patterns - Maximum patterns allowed on chart at any time
⚬ When it reaches the maximum patterns and the indicator finds a new one, the old patterns will be removed
- (important for algo traders because alerts for those removed patterns will no longer be a trigger)
🔸 Pattern size
⚬ Without filter will show all patterns (regardless of size)
⚬ Show only patterns for user preference size (no more two patterns because is smaller of 280 bars)
🔸 External Filter - It can be used to filter harmonic patterns. You can build your own custom trend based scripts and use it with AHP to filter trades.
⚬ The structure of the external script must be
1 for Long/Bullish patterns
-1 for Short/Bearish patterns
2 for all (Long and Short patterns)
0 Trade is not allowed
🔸 Filter Pattern Starts
⚬ When Filter starts is enabled pattern will start for logical pivot (see example)
⚬ Disabled filter will show more patterns (still can be very profitable)
💎 STOP & ENTRY & TRAILING STOP
🔸 Trail Entry Price - If Entry is still not reached and the price is still in PRZ zone, at the new high/low will adjust Entry.
⚬ Open Stats table will show the first Entry (when patterns were found) as well as the last corrected Entry (when patterns reached Entry level).
⚬ Disable this option Entry will remain at the level when patterns are found.
🔸 Enable Targets (awaiting entry) - enabled will show potential Targets for "awaiting entry" patterns (not active patterns because they have not yet reached Entry).
⚬ The Open stats table will show all other information, risk %, R:R etc).
⚬ Risky trade but with very good R:R (not recommended for inexperienced traders, very high risk of trading hitting Stop before reaching a Target)
🔸 Stop Distance - By default is set to 5. That is percent from the last low/high when the pattern reaches Entry. Stop trail from price till pattern reached Entry level.
🔸 Entry Distance - By default is set to 16. Same for SL that is percent distance from live price. You can increase/decrease percent but remember you have to give space between live price and the entry.
⚬ If entry is close to price, trade will become active too quickly
⚬ Remember if you change Stop Distance as well as Entry Distance to check Risk : Reward (recommended R:R for the first target is about 1:1)
🔸 Trailing Type - Options for trailing type, Continuous, Stepped, Breakeven and Disabled.
⚬ Continuous - When the price reaches "Trailing Active" (initial level for activating the trailing stop), T.Stop will start from Entry or Initial Stop (based on "Trailing Starts") and follow the price by Distance or Percent (based on "Trailing by").
- example one (trailing starts from Initial Stop when TP1 reached by distance/price on picture 1 and by percent on picture 2)
- example two (trailing starts from Entry when TP1 reached by distance/price on picture 1 and by percent on picture 2)
⚬ Stepped - when price reaches Trailing Active (initial level for activating the trailing stop), T.Stop will move to the previous level
- (If "Trailing Active" is set to Target2, then T.Stop will move to Target1 when price reached TP2)
⚬ Breakeven - when price reaches Trailing Active (initial level for activating the trailing stop), T.Stop will move to Entry and stay there the entire time for that harmonic trade
- (till reached all targets or reached T.Stop)
🔸 Trailing Active - When will the Trailing Stop be activated ("Trailing Type" must be enabled)
🔸 Trailing by - Distance or Percent
⚬ Distance - T.Stop will follow live price by initial distance
⚬ Percent - T.Stop will follow live price by initial percent
🔸 Trailing Starts - Entry or Initial Stop
⚬ Entry - T.Stop will start trailing from Entry level
⚬ I.Stop - T.Stop will start trailing from initial Stop level
- (Check Continuous picture for information)
💎 TARGET
🔸 Base - The level from which the calculation for Targets is made.
🔸 Target 1/Target 4 dropdown - Targets are set by default and set in the dropdown most often used for those targets.
🔸 Target 1/Target 4 custom - If the desired ratio is not in the dropdown, then it is possible to manually enter the desired ratio.
⚬ (If you want to change some of the targets, maybe to confluence with support/resistance)
💎 PATTERNS
🔸 Harmonic Patterns Type
⚬ Enable/Disable harmonic patterns by Type of patterns (for Classic and Anti patterns)
⚬ By default all patterns are enabled (for standard patterns). Users can control and select/deselect all Classic, Anti or Non Standard patterns but also disable individual patterns.
⚬ For some patterns (like Shark and Navarro 200) we change PRZ or place in different Type groups. That is just cosmetic things.
🔸 Classic - This includes all and most popular Harmonic Patterns.
⚬ Gartley (Type I)
⚬ Bat (Type I)
⚬ Butterfly (Type II)
⚬ Crab (Type II)
⚬ Deep Crab (Type II)
⚬ Cypher (Type II)
⚬ Shark (Type III)
⚬ Nenstar (Type IV)
🔸 Anti Patterns
⚬ Anti Nenstar (Type I)
⚬ Anti Shark (Type II)
⚬ Anti Cypher (Type II)
⚬ Anti Crab (Type II)
⚬ Anti Butterfly (Type III)
⚬ Anti Bat (Type IV)
⚬ Anti Gartley (Type IV)
⚬ Navarro 200 (Type IV)
🔸 Non Standard -
⚬ White Swan
⚬ Black Swan
⚬ 3 Drive
⚬ Anti 3 Drive
⚬ Wolfe
⚬ Snorm
⚬ 121 Pattern
⚬ 5-0 Pattern
⚬ Sea Pony
⚬ Leonardo
💎 PATTERN DISPLAY OPTION
🔸 Pattern Lines Size - thickness for harmonic patterns
🔸 Pattern Lines Type - type for harmonic pattern lines (solid, dotted, dashed)
🔸 Fill XAB/BCD - major harmonic triangle
🔸 Fill ABC/XBD - minor harmonic triangle
🔸 Enable XABCD Label - labels for harmonic pattern
🔸 XABCD Label Size - size for harmonic xabcd labels
🔸 Enable Ratio Label & Line - lines and labels that connect harmonic patterns levels and that show the patterns ratio
🔸 Ratio Label Size - ratio labels size
⚬ Lines for pattern ratio are set by default dashed and can’t be changed.
💎 PRZ & ENTRY | STOP | TARGET SETTINGS
🔸 Entry & Stop & Target Labels - by default is set to small (opt small & normal)
🔸 Entry & Stop & Target Lines - by default is set to show lines & labels & price (opt lines & labels & price or lines & labels or disable all)
🔸 PRZ Box size - size in bars for PRZ box
⚬ Added option when it is not readable on chart pattern names or entry/stop/targets offset
⚬ Maximum (last pattern) can be drawn up to 500 bars in future or you will get error for script (use this option only when you need)
🔸 PRZ Box Type of Spacing - distance between PRZ boxes. "Auto" will make the maximum distance when there are more than 3 patterns on the chart for better visibility
- (the maximum can be projected up to 500 bars in the future)
🔸 PRZ Box Manual Spacing - manual distance between PRZ boxes if is “PRZ Box Type of Spacing” set to manual
💎 STATS AND DISPLAY
⚬ These settings can be used to manage display of open and close statistic tables
🔸 Open Trades - By default is enabled and set to the top right position.
🔸 Closed Trades - By default is disabled and set to bottom left position.
⚬ The size of the table can be changed (by default it is set to small)
🔸 Enable Tool Tip for Table - can be enabled/disabled. Shows important information for each section related to Open or Closed tables.
⚬ Recommended enabled until everything related to tables is understood, and later disabled (it starts to get annoying when you accidentally cross the tables with the mouse and tooltip box pop up)
💎 OPEN STATS
🔸 Percentage - show percentage for Targets and Stops
🔸 Risk/Reward - show patterns risk to reward for each Targets
🔸 Size/Age - show patterns size (from X to D in bars) and patterns age (distance in bars when patterns “In Trade”)
🔸 Live % & R:R - enabled will show live % and R:R if you take trade in that moment
💎 CLOSED STATS
🔸 Percentage - show stats by percent instead of numbers
🔸 Display Mode - Closed trade table have three display option, Compact, Detailed and Selective
⚬ Compact - show stats for Long/Bullish and Short/Bearish patterns
⚬ Selective - show stats just for active patterns
⚬ Detailed - show stats for each enabled patterns
- All stats is for “Backtest Bars” if enabled.
- I removed some things from the previous indicator (R:R as well as trailing R:R and win rate) because I think they are not relevant in Closed Table for trade or for statistics (Open Table have that)
💎 PATTERN | CHART COLOR THEME
⚬ By default it is set to Light color theme. Color theme will affect pattern lines, XABCD labels, ratio lines and label, entry/sl/targets labels and text in the open statistics table.
🔸 Dark Theme / Light Theme - Users can change any default individual color for dark or light theme (transparency too).
⚬ Light/Dark Theme suits dark or light chart background or user can change all color to preferred trade style.
⚬ Users have extra control to change all color to preferred trade style.
💎 ALERTS
⚬ Alerts - These settings help users to choose the type of alerts they want to receive.
🔸 New - New Harmonic Pattern is identified
🔸 Entry - Harmonic Pattern reached Entry level
🔸 Target 1/Target4 - Alert when patterns reached on of Target levels
🔸 Closure - Harmonic Pattern trade is closed. Reached all Targets or Stop or Trailing Stop (if is enabled)
🔸 Long & Short placeholders - Enabled will change for alerts Bullish/Bearish text for Long/Short text
⚬ example of custom alerts with some placeholders
💎 BACKTEST WINDOW
🔸 Backtest bars - Enabled will scan patterns for that bar range (default is set to 5000)
🔷 TOOL TIP
⚬ In setting you have help from tooltip to give you almost all this information for easy understanding. Hover mouse above tool tip and windows with info will appear.
⚬ On the chart, tool tip is added for each individual Harmonic pattern to show extra information (pattern ratio, type of harmonic and where often that pattern appears in Elliott wave fractal)
⚬ Tooltip for tables will also provide all the information related to Open and Closed tables. Disabled tooltip for tables will hide all information, but the tooltip for patterns will still remain.
🔴 Possible Errors
⚬ If a mistake is made in the settings and, for example, TP2 is set to 0.618 ratio and TP3 is changed to 0.5 ratio
- (the larger target is set to a smaller ratio than the smaller target), a red text will appear over most charts to indicate the error.
⚬ If Trailing Type is enabled and "Trailing Active" and "Trailing Starts" are set to the same level (Entry), a red text will appear on the charts to indicate an error
- (change "Trailing Active" to a higher level, TP1, or lower "Trailing Starts " to "I.Start")
IDEAL BB with MA (With Alerts)It gives well combination of Moving average and Bollinger bands with signals

Roberts Pi Cycle Top and Bottom Indicator BTCIndicator Overview
The Pi Cycle Top Indicator has historically been effective in picking out the timing of market cycle highs to within 3 days.
It uses the 111 day moving average (111DMA) and a newly created multiple of the 350 day moving average, the 350DMA x 2.
This updated indicator is based on the original x2 Daily Simple Moving Average Pi Cycle Top Indicator for BTCUSD but with the addition of a 3rd 350 SMA
Standard Pi Cycle SMA = 350*2 SMA + 111 SMA
Updated Pi Cycle SMA = 350*2 SMA + 111 SMA + 350 SMA
How It Can Be Used / How to Read:
Chart should be used on BTCUSD only
Chart should be set to Daily Timeframe only
Buy signal RED SMA crosses up over WHITE SMA
Sell Signal RED SMA crosses up over GREEN SMA (a vetical yellow line will indicate the cycle top)

Multiple Stoch.+RSI+Stoch. RSI A.Multiple TA, it is a combination of RSI, Stochastic RSI and Stochastic indicators with many setting options. An additional RSI can be displayed showing the RSI values of the previous candle. This has an impact on the buy and sell signal.
It offers an alert condition for the buy signal that is available in the Create Alert dialog box. Please note that the indicator does NOT create an alarm, it only offers additional options in the "Create alarm" dialog box.
This is not a purchase advice tool or does not ask for any other guarantee, so use this indicator only at your own risk.
German:
Multiple TA, es handelt sich um eine Kombination der RSI, Stochastik RSI und Stochastik Indikatoren mit viele Einstellungsmöglichkeiten. Es kann eine zusätzliche RSI angezeigt werden, der die RSI Werte von vorherige Candle anzeigt. Diese hat ein Einfluss auf den Kauf und Verkauf Signal.
Es bietet eine Alarmbedingung für die Kaufsignal an, die im Dialogfeld "Alarm erstellen" verfügbar ist. Bitte beachten Sie, dass der Indikator KEINEN Alarm erstellt, sondern nur weitere Optionen im Dialogfeld "Alarm erstellen" bietet.
Das ist keine Kaufberatungstools oder bittet keine sonstige Garantie, daher nutzen Sie diesen Indikator nur auf eigene Gefahr.

[pp] Signal GeneratorResearch and Development Tool.
For anyone who is familiar with working with digital signals (audio/electrical engineers) you might appreciate this Signal Generator.
You can select and vary 4 different types of signals.
Logistic Map
If you're not familiar with the logistic map, then go watch a youtube video. By default the equation is meant to represent chaos and is a good alternative for random number generation.
Random
This uses the built-in random number generator. I'm not sure if it's better to use this or the logmap default settings. Either way, you have a choice.
Unit Impulse
Good for creating a transient impulse.
Step Impulse
Similar to the unit impulse. Except constant and not a transient.
Synthesizer
It comes with 4 wave functions (Sine, Triangle, Square, Saw) that can be combined for additive synthesis. Each wave function contains its own respective phase and amplitude control.
Credits
Many of these functions were taken from www.pinecoders.com with the exception of the logistic map. I simply aggregated them all into this toolkit for ease of use.
How to use
This is not a trading indicator. This is meant to be used for research and development. You could use it to test strategies, by generating white noise with the logmap and creating trading signals. Or you could use it for teaching and learning. Using the constant data as a dependable, repeatable resource.

ATR Start & Stop BotThis script is using Average True Range (ATR) and works very well on the Bitcoin 4 hour timeframe to determine when to stop and start your bots.
It has a very similar visual to the EMA RSI Indicator found here:
This 'ATR Start & Stop Bot' is better because it has less confusion during sideways market movement.
As an example - You are using 3commas and have a Composite bot setup with several alt coins, you can use this indicator with the ' Stop bot ' alert to disable your composite bot from taking trades at times when the market is on a trend that looks in the red.
Alternatively you can use the ' Start bot ' alert to turn your bot back on during the green uptrends.
Using this indicator with these alerts on the Bitcoin 4-Hour chart add a great layer of automation to your already existing bots.
Credits:
Original 'ATR Stops' indicator belong to the user failathon and that script is found here:
Also credits to Dradian for the alert additions.

vol_signalNote: This description is copied from the script comments. Please refer to the comments and release notes for updated information, as I am unable to edit and update this description.
----------
USAGE
This script gives signals based on a volatility forecast, e.g. for a stop
loss. It is a simplified version of my other script "trend_vol_forecast", which incorporates a trend following system and measures performance. The "X" labels indicate when the price touches (exceeds) a forecast. The signal occurs when price crosses "fcst_up" or "fcst_down".
There are only three parameters:
- volatility window: this is the number of periods (bars) used in the
historical volatility calculation. smaller number = reacts more
quickly to changes, but is a "noisier" signal.
- forecast periods: the number of periods for projecting a volatility
forecast. for example, "21" on a daily chart means the plots will
show the forecast from 21 days ago.
- forecast stdev: the number of standard deviations in the forecast.
for example, "2" means that price is expected to remain within
the forecast plot ~95% of the time. A higher number produces a
wider forecast.
The output table shows:
- realized vol: the volatility over the previous N periods, where N =
"volatility window".
- forecast vol: the realized volatility from N periods ago, where N =
"forecast periods"
- up/down fcst (level): the price level of the forecast for the next
N bars, where N = "forecast periods".
- up/down fcst (%): the difference between the current and forecast
price, expressed as a whole number percentage.
The plots show:
- blue/red plot: the upper/lower forecast from "forecast periods" ago.
- blue/red line: the upper/lower forecast for the next
"forecast periods".
- red/blue labels: an "X" where the price touched the forecast from
"forecast periods" ago.
+ NOTE: pinescript only draws a limited number of labels.
They will not appear very far into the past.

KV Box v1.0 - Buy / Sell signalKV BOX is a trading indicator. It combines Darvas box theory (developed by Nicolas Darvas), breakout strategy, multi-timeframe trading and ALMA (Arnaud Legoux Moving Averages). This indicator helps identify BUY signals when the price is in the entry zone and SELL when the price breaks out of the uptrend.
---
How to use?
KV BOX can be used in both SPOT and FUTURE (Long/Short) trading
BUY (LONG):
• Entry: When the BUY signal appears.
• Stop loss: LOWER than LOW of first and second candlestick IN THE BOX WHERE BUY SIGNAL APPEARS of 1H, 4H, 1D timeframe.
• Take profit: When the SELL signal appears.
SELL (SHORT):
• Entry: When the SELL signal appears.
• Stop loss: HIGHER than the HIGH of first and second candlestick IN THE BOX WHERE SELL SIGNAL APPEARS of 1H, 4H, 1D timeframe.
• Take profit: When a BUY signal appears.
---
Attention:
KV BOX is only displayed on 1H, 4H and 1D timeframe. 1H for short-term trades (a few days), 4H for mid-term trades (a few weeks), 1D for long-term trades (weeks to months).
---
Options setting:
- Kelvin box on: KV BOX activates
- ALMA mode on: KV BOX activation according to Arnaud Legoux Moving Average (ALMA) method
- Pinbar indicator: activate the indicator when the pinbar candlestick appears
- Supertrend: trend continuation or reversal indicator
============================
KV BOX là 1 chỉ báo mua / bán kết hợp giữa nguyên lý hộp Darvas, phương pháp phá vỡ (break out), giao dịch đa khung thời gian và đường trung bình ALMA (Arnaud Legoux Moving Averages). Chỉ báo này giúp xác định tín hiệu mua khi giá ở vùng entry và bán khi giá phá vỡ khỏi trend tăng (up trend).
---
Cách sử dụng:
KV box có thể dùng trong giao dịch SPOT và FUTURE (Long/Short).
Mua khi có tín hiệu BUY, bán khi có tín hiệu SELL.
MUA:
• Entry: Khi có tín hiệu BUY.
• Cắt lỗ: thấp hơn giá thấp nhất cùa 2 nến đầu tiên trong hộp xuất hiện tín hiệu BUY của khung 1H, 4H, 1D.
• Chốt lời: Khi có tín hiệu SELL xuất hiện.
BÁN:
• Entry: Khi có tín hiệu SELL.
• Cắt lỗ: cao hơn giá cao nhất của 2 nến đầu tiên trong hộp xuất hiện tín hiệu SELL cùa khung 1H, 4H, 1D.
• Chốt lời: Khi có tín hiệu BUY xuất hiện.
---
Chú ý:
KV BOX chỉ hiển thị trên khung 1H, 4H và 1D. 1H cho giao dịch ngắn hạn (vài ngày), 4H cho giao dịch trung hạn (vài tuần), 1D cho giao dịch dài hạn (vài tuần đến vài tháng).
---
Tùy chọn setting:
- Kelvin box on: kích hoạt KV BOX
- ALMA method on: kích hoạt KV box theo phương pháp Arnaud Legoux Moving Averages (ALMA)
- Pinbar indicator: kích hoạt chỉ báo khi xuất hiện nến pinbar đảo chiều
- Supertrend: chỉ báo xu hướng tiếp diễn hoặc đảo chiều

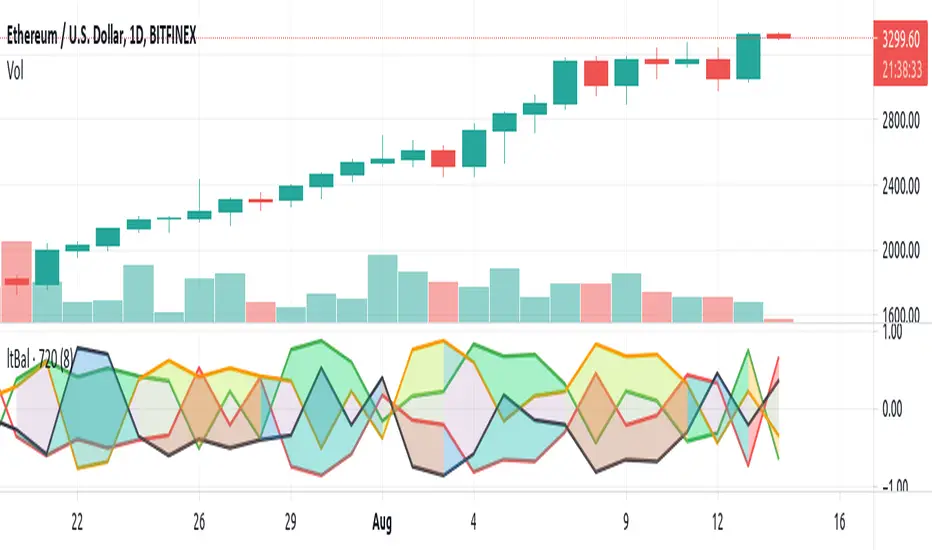
Light BalanceThe script is simple, going for a color scheme logic which tenderly avoids rigorous signals processing.
For the script to remain simple, logical derivatives are also out; as such, there are no secondary relations built off of primary ones. And it also ignores (unless you do this yourself) the logic in a varying order of lines.
Coloring has been done according to a limited set of relations between the four (4) plotted lines.
Quite a bit of information is capture, as you'll see when looking at line order, crossings, and transparency transitions and their patterns.
The approach makes the relations ones which can be learned over time; you become the algorithm to sort out signals. Ha ha. I know that sounds like a cop out doesn't it. Did I mention it's a simple script?
One thing you might want to play with right away are fills having red and green, and lime and fuchsia. It would be cool to reduce it all down to two (2) colors, but all the boolean relations might have to be listed, and it also may not be possible to cumulatively combine transparency overlays of the same value. Visually, that approach may not result to awaken a useful feature anyway. Also, fill() has its limitations in that it cannot be in a local scope; this includes function wrapped calls to fill(), or calls made using branching logic statements if/elseif, iff(), and var = (cond) ? t_val/exp : f_val/exp. So, to my knowledge, a fill() can not be made to be logically on/off.
Please, enjoy getting some use out of it.