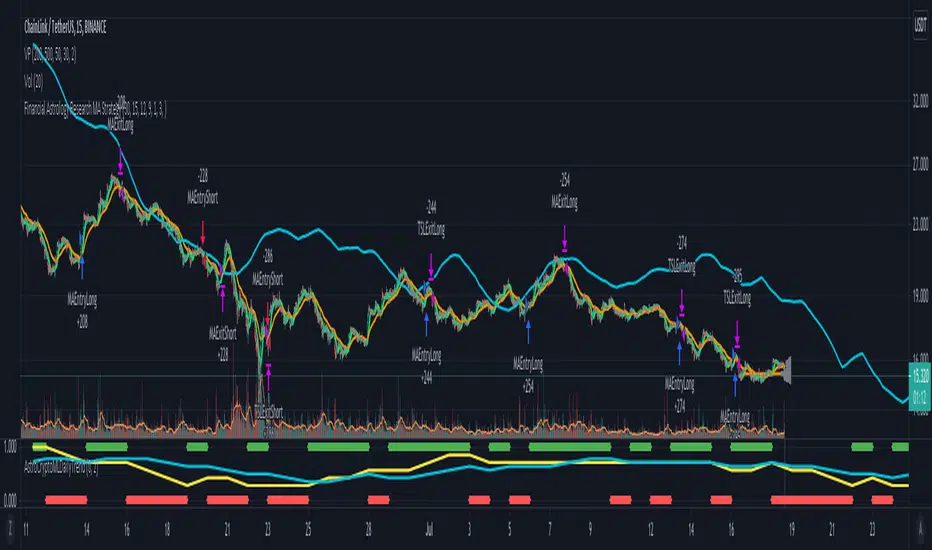
Morun Astro Trend MAs cross StrategyAstrology machine learning cycles indicator signals with technical MAs indicators strategy, based on signals index of Github project github.com
Đường Trung bình trượt Đơn giản (SMA)
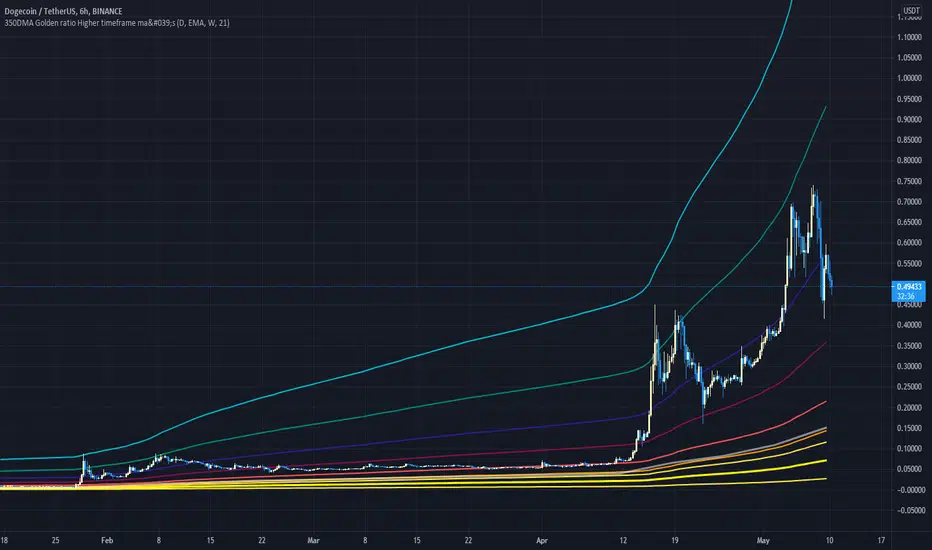
350DMA Golden ratio Higher timeframe ma'sThis Script take a 350 day moving average (bright yellow line) and multiplies it by the golden ratio 1.6... and by the Fibonacci sequence (0, 1, 2, 3, 5)
It is a great tool for finding tops and critical supports on higher timeframes.
The script also includes and higher timeframe ma (gray line) that can be set to your liking (default is 21 week).
Universal MA BandThis universal Moving Averages Band allows you to configure 2 independent MA with a tinted band between them. It is unique in that it allows you to configure each one separately: separate Resolution, Period and Type (SMA or EMA). Recommended bands for BTC:
50D SMA/EMA
100D SMA/EMA
20W SMA / 21W EMA

Fibodex TrapFibodex Trap indicator
this indicator designed by the Fibodex team
you will receive dump and bump singles buy using this indicator
also, you will receive buy and sell signals
indeed by using our indicator you won't need many technical analyses
The accuracy of the indicator with the correct settings is estimated to be more than 70%
also, we are trying to improve it to make it more accurate
notice that this indicator should be used as a secondary tool
By using this indicator, you also accept the risk of using it.
--------------------------------------------------------------------------------------------------------------------------------------------------------------------------------------------------------------------------------------------------------------------------------------------------------
اندیکاتور تله توسط مجموعه فیبودکس ایده پردازی و کد نویسی شده است.
شما با این اندیکاتور قادر خواهید بود تا سیگنال های پامپ و دامپ و همچنین خرید و فروش را دریافت نمایید.
دقت اندیکاتور با تنظیمات صحیح بیش از 70 درصد تخمین زده شده است که مجموعه فیبودکس در جهت بهبود و افزایش دقت آن تلاش خواهد کرد.
به یاد داشته باشید که از این اندیکاتور به عنوان کمکی و دریافت تاییده کمک بگیرید .
شما با استفاده از این اندیکاتور ریسک استفاده از آن را هم می پذیرید

Average Trading Range Percentage
Average high/low trading range for the current timeframe.
Daily high/low trading range.

Moving Average BandsUse this script to find buy and sell zones for BTC based on momentum of the move relative to the average asset price over a given period. The script plots a series of offset bands above and below the Simple Moving Average. When price crosses another band further from the SMA, the background is rendered brighter. The brighter the background, the stronger the buy and sell signal is, as the expectation is that price wants to return to the SMA. Settings are adjustable to fine tune to various time frames and assets. Good settings for BTC Daily are length 30, layers at 10, 20, 30, and 40.
On 1H BTC/USD I use length 200, layers at 5, 10, 15, 20 to find decent swing trading opportunities.
On BTC/USD 1D chart, combine with Bitcoin Logarithmic Growth Curve from @mabonyi (original by @quantadelic )for confluence of very reliable signals.

Bot go_up strategyHello. This strategy is based on go_up alerts.
Our task is to find the local minimum. The trade is entered on the basis of RSI and SMA according to a specific formula, which is embedded in the code. When the RSI crosses the SMA upside down, a long position is entered. You can change the length of the RSI . The longer the length, the less frequent, but more accurate the entrance, and vice versa. You can use a different time frame.
The settings have:
1) RSI length, the lower the length, the more often the entry.
2) Testing results for any period of time
3) Take profit for any percentage
4) Stop order for any percentage
5) If there is a check mark ✅, then purchases will always be made, and if not, then purchases will be made, BUT, if the next payback is lower than the previous one, it does not matter by what percentage.
6) If there is a check mark ✅, then each trace of the purchase will be made provided that it is lower by the percentage specified, even if the conditions of the purchase are triggered.
7) The filled area is made for visual display of consolidation zones
Default settings:
RSI length 15, step 1.5, take profit 15, stop order 30.
Also in the settings there is a pyramid of the order, keep this in mind. Enter a deal for a small part of the deposit, and not for all the money at once! You can remove pyramiding and see the results with one entry.
For a more visual understanding, overlay the go_up script.
You can choose a strategy for yourself based on history! If you need examples of strategies, then write to me, my contacts are in the column: instructions from the author.
Successful trades, dear friends, I am glad that you trust me!

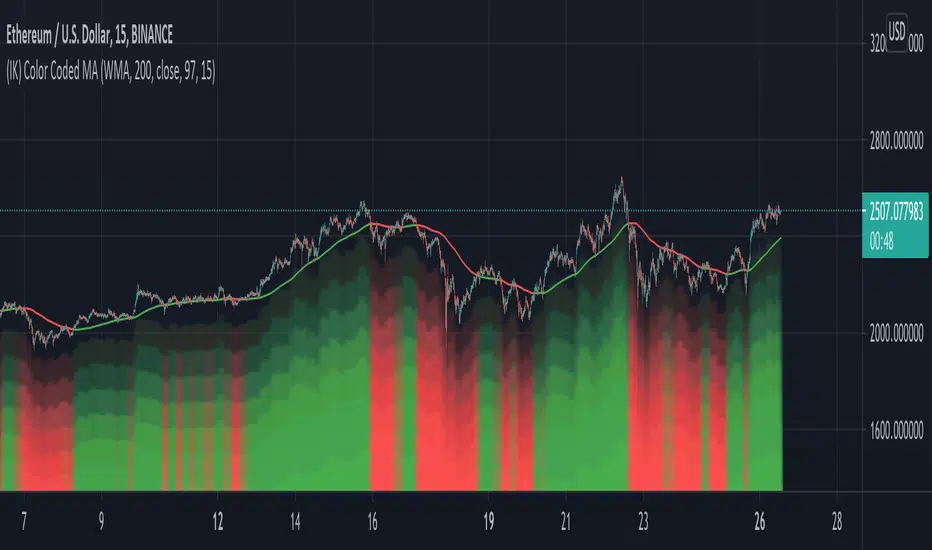
(IK) Color Coded MAJust a simple Moving Average indicator. Choose between SMA, EMA, and WMA, set the length and the source. There are 3 color indicators that represent whether price is above or below the moving average:
- the moving average line itself
- the background of the chart (optional)
- the 'underglow' of price action (optional - set 'underglow strength' to 0 to turn off)
You can customize the colors
I wasn't planning on publishing this, because, again, it doesn't really do anything special, but I've been using it for a little bit now in place of regular MAs, and I really dig the visual effect of the underglow, so I thought I'd share.
Feel free to steal/modify this.
Candle Percent Volatility by AllenlkThis indicator gives you the percentage movement of each candle. Measurements are taken between the candle High point and Low point, and also between the Open and Close and calculated in percent %. From there it smooths out the data with a moving average. This gives you an idea of how much volatility is within each candle given the time resolution of the chart.
I like to use this information as a way to turn off a strategy, or select a proper time resolution for a strategy. If each candle has less than 2.5% Volatility most strategies will typically buy and sell rapidly at prices that are too close together, potentially losing money. During those times it seems best to either temporarily turn off the strategy, change the time resolution or switch to another strategy.

CCI45/SMA50 indy for 30 min SP500SPCFD:SPX
The script determines entry points using 45 period CCI and 50 period SMA.
Long condition: When CCI crosses up 150 treshold while price above 50 period SMA
Short condition: When CCI crosses down -150 treshold while price below 50 period SMA
Trades are executed above/below 1 point of high/low for long/short positions. Stops are just 1 point below/above of SMA. After 4 points of profit stops should be tightened. If you do not plan to hold the position for a long time, it can produce quick profit within 5-6 bars namely 2.5-3 hour. Otherwise you can manage the trade using SMA as trailing stop. This can be treated as a strategy of scalping which turns out a trend trading eventually if conditions good.
Have a nice trading

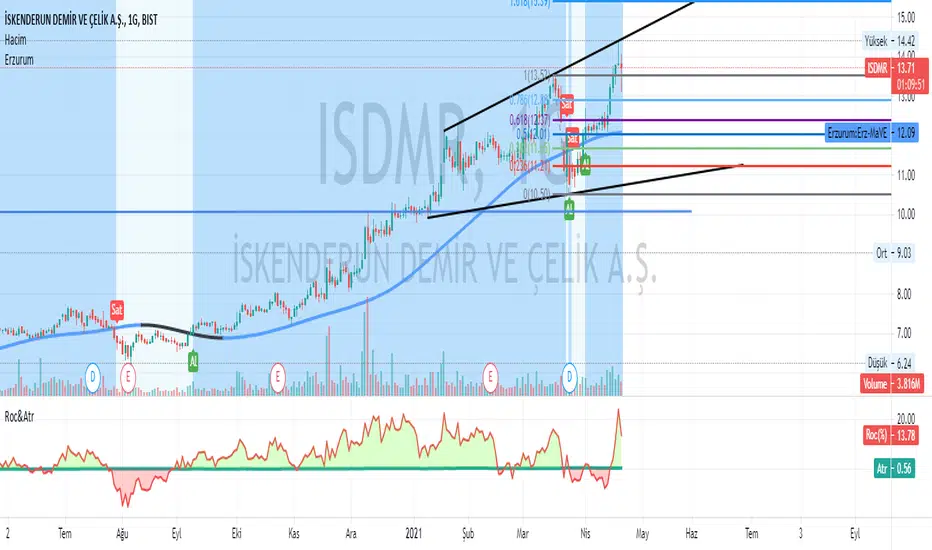
Erzurum Indicators (By DadashKadir)Erzurum Indicators (By DadashKadir)
An indicator in which you will keep track of the buying and selling movements by adding the movements of the three moving averages together. The parameters were determined as Moving Average (SMA), Exponential Moving Average (EMA), Weighted Moving Average (WMA) and Volume Weighted Moving Average (VWMA). Its constant value was taken as WMA. It is used to calculate the averages of 3 - 5 and 7. You can include the standard deviation (STDEV) in these moving averages.
The name of the indicator is taken from our city of Erzurum, the pearl of Eastern Anatolia.
3min Scalp N.roiIndicator for 3 min time frame scalping.
Fast ema + slow Sma for entrance signal
Modified Sar for TP/SL
SIgnals for entry in both Short and Long direction!
Built by
NOEL ROI

Ultimate Buy/Sell IndicatorAn Indicator based on the William Alligator, helping to find suitable entry and exit points.

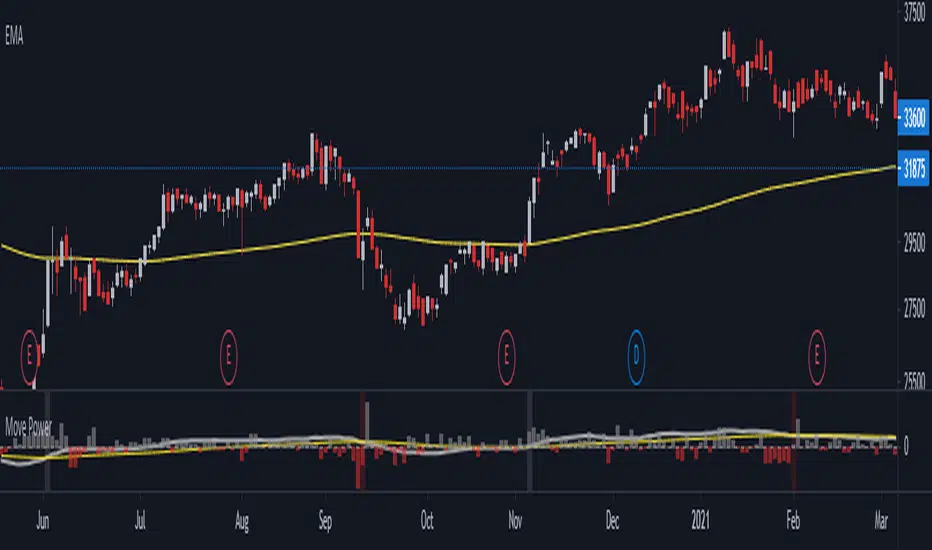
Excitement - Crypto Surfer v1For those of us who need more excitement in our crypto journey besides just HODL, here’s a simple crypto robot that trades on the hourly (1H) candles. I call it the Crypto Surfer because it uses the 20 and 40 EMAs (Exponential Moving Averages) to decide when to enter and exit; price tends to “surf” above these EMAs when it is bullish, and “sink” below these EMAs when it is bearish. An additional 160 SMA (Simple Moving Average) with slope-angle detection, was added as a bull / bear filter to reduce the sting of drawdowns, by filtering-out long trades in a prolonged bear market.
USER NOTES:
- This script will buy $10,000 USD worth of crypto-currency per trade.
- It will only open one trade at a time.
- It has been backtested on all the high market cap coins such as Bitcoin, Ethereum, Binance Coin, Polkadot, Cardano.
- It should be run on the Hourly (H1) chart.
- In general, this moving average strategy *should be* profitable for 80% to 90% of the coins out there
- The 160 SMA filter with slope angle detection is designed to stop you from going long in a bear market.
- It is recommended you copy this script and modify it to suit your preferred coin during backtesting, before running live.
- Trading is inherently risky (exciting), and I shall not be liable for any losses you incur, even if these losses are due to sampling bias.

Moving Averages For All Timeframes [LevelUp]Manage moving averages, for every timeframe, from within one indicator.
Features:
■ Intraday - Up to 3 moving averages
■ Daily - Up to 4 moving averages
■ Weekly - Up to 2 moving averages
■ Monthly - Up to 2 moving averages
■ Choose between simple, exponential or volume weighted moving averages (SMA, EMA or VWMA)

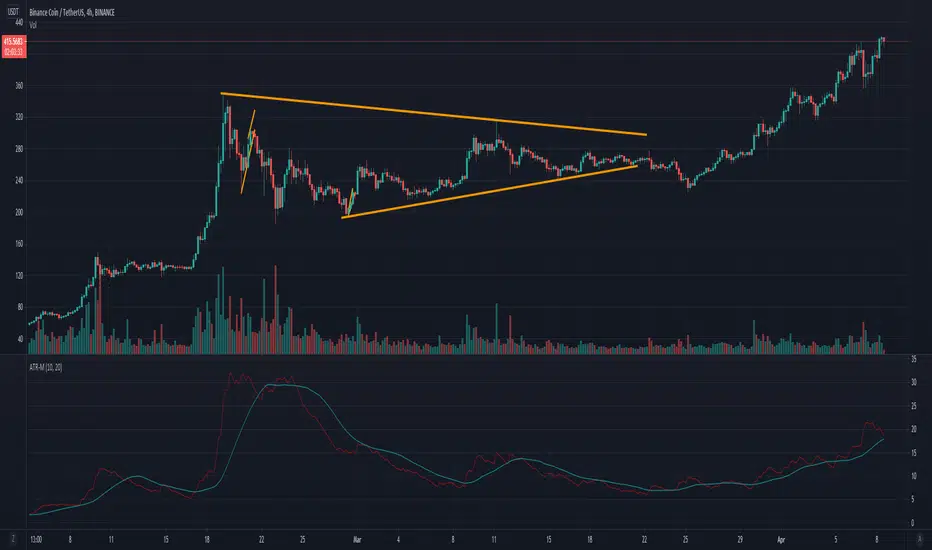
ATR-MSimple ATR with a moving average signal line. Play with the inputs, I suggest making the MA longer than the ATR length for a more reactive outcome. This is a great tool for trend trading!
There are two main uses for this indicator:
1. Filtering out losing trades
- Take trades when the ATR is above the signal line.
2. Identifying trends and slow downs to trends
- Ride trending markets.
- Be weary of the ATR crossing below the signal line, a reversal or pause in the trend is coming.
I'm sure something like this exists on TV but I haven't seen it yet. I'm new to making indicators and trading in general yet this tool looks to eliminate a lot of losing trades my entry indicator took during noisy/dead markets.
I hope this helps somebody out!
Lower Time Frame ScalperThis indicator is meant to identify lower timeframe momentum shifts in Forex pairs by using simple moving averages and the Kijun Sen indicator around key psychological levels.
Alert functionality for buy and sell conditions have also been built in to allow the trader time away from charts.

RSKYVNThis indicator is a combination of ema and sma which is good for trend analysis.
I put buy and sell signal in this indicator for an easy entry and exit.
How to use it?
First check our ma100. Ma100 shows trend analysis whether we are (uptrend and downtrend).
Second just wait for our biuy and sell signal.
This is profitable when ma100 is under our sma and ema region. So always wait that ma100 dive under ema and ma regions to enter a trade.
Disclaimer: This indicator is only good when there is a trend. The only flaw of this is when market is consolidating if that the case just switch to a support and resistance or fibonacci for entry and exit.
Always remember manage your own risk

3SMA + Ichimoku 2leadlineThis indicator simultaneously displays two lines, which are the leading spans of the Ichimoku Kinko Hyo, and three simple moving averages.
To make it easier to distinguish between the simple moving average line and the line of the Ichimoku Kinko Hyo, the simple moving average line is set to level 2 thickness by default.
Also, the color of Reading Span 1 in the Ichimoku Kinko Hyo has been changed from green to lime to improve color visibility.
I (author of this indicator) use this indicator especially as a simple perspective on the cryptocurrency BTC / USD(USDT).
If this indicator is a problem, moderators don't know about tradingview beginners.
" Visibility " should be a high-priority item not only for indicators but also for graph requirements.
Visibility is one of the most important factors for investors who have to make instant decisions in one minute and one second.
The purpose of this indicator is to display two leading spans that are easily noticed in the Ichimoku cloud and three simple moving averages whose set values can be changed.
This is because chart analysis often uses a combination of a simple moving average of three periods and two lead spans of the Ichimoku cloud.
Also, in chart analysis, green is often displayed with the same thickness on both the moving average line and the Ichimoku cloud.
Therefore, if the moving average line and the Ichimoku cloud often use the same green color, the visibility will drop. Therefore, the green color of Ichimoku cloud was changed to lime color by default.
Tradingview beginners often refer only to the two lines of the leading span of Ichimoku Cloud. Therefore, we decided not to draw lines that are difficult to use.
Many Tradingview beginners don't know that you can change the thickness of the indicator .
Therefore, this indicator shows by DEFAULT the three commonly used simple moving averages that are thickened by one step at the same time.
Also, since the same green color is often used for the Ichimoku cloud and the moving average line, the green color of the preceding span of the Ichimoku cloud is changed to lime color by default.
The originality of this indicator is that it enhances " visibility " so that novice tradingview users will not be confused on the chart screen.
The lines other than the preceding span of the Ichimoku cloud are not displayed, and the moving average line is level 2 thick so that the user can easily see it.
This indicator not only combines a simple moving average and Ichimoku cloud, but also improves "visibility" by not incorporating lines that are difficult to see from the beginning and making it only the minimum display, making it easy for beginners to understand. The purpose is to do.
If any of the other TradingView indicators already meet the following, acknowledge that this indicator is not original.
・Display 3 simple moving averages at the same time
・For visibility, the thickness of the simple moving average line is set to level 2 from the beginning.
・A setting that does not dare to draw lines other than the lead span of Ichimoku cloud.
・Make the moving average line and the Ichimoku cloud line different colors and thicknesses from the beginning.

CT Moving Average Crossover IndicatorMoving Average Crossover Indicator
Here I present a moving average indicator with 9 user definable moving averages from which up to 5 pairs can be selected to show what prices would need to be closed at on the current bar to cross each individual pair.
I have put much emphasis here on simplicity of setting the parameters of the moving averages, selecting the crossover pairs and on the clarity of the displayed information in the optional “Moving Average Crossover Level” Information Box.
What Is a Moving Average (MA)?
According to Investopedia - “In statistics, a moving average is a calculation used to analyze data points by creating a series of averages of different subsets of the full data set.
In finance, a moving average (MA) is a stock indicator that is commonly used in technical analysis. The reason for calculating the moving average of a stock is to help smooth out the price data by creating a constantly updated average price.
By calculating the moving average, the impacts of random, short-term fluctuations on the price of a stock over a specified time-frame are mitigated.”
The user can set the color, type (SMA/EMA) and length of each of the 9 moving averages.
Then the user may choose 5 pairs of moving averages from the set of 9.
The script will then calculate the price needed to be crossed by the close of the current bar in order to crossover each of the user defined pairs and outputs the results as optional lineplots and/or an Infobox which shows the relevant information in a very clear way.
The user may switch the moving averages, crossover lineplots and infobox on and off easily with one click boxes in the settings menu.
The number of decimal places shown in the Infobox can be altered in the settings menu.
If the price required to cross a pair of moving averages is zero or less, the crossover level will display “Impossible” and the plots will plot at zero. (this helps ameliorate chart auto-focus issues)
Quoting a variety of online resources …….
Understanding Moving Averages (MA)
Moving averages are a simple, technical analysis tool. Moving averages are usually calculated to identify the trend direction of a stock or to determine its support and resistance levels. It is a trend-following—or lagging—indicator because it is based on past prices.
The longer the time period for the moving average, the greater the lag. So, a 200-day moving average will have a much greater degree of lag than a 20-day MA because it contains prices for the past 200 days. The 50-day and 200-day moving average figures for stocks are widely followed by investors and traders and are considered to be important trading signals.
Moving averages are a totally customizable indicator, which means that an investor can freely choose whatever time frame they want when calculating an average. The most common time periods used in moving averages are 15, 20, 30, 50, 100, and 200 days. The shorter the time span used to create the average, the more sensitive it will be to price changes. The longer the time span, the less sensitive the average will be.
Investors may choose different time periods of varying lengths to calculate moving averages based on their trading objectives. Shorter moving averages are typically used for short-term trading, while longer-term moving averages are more suited for long-term investors.
There is no correct time frame to use when setting up your moving averages. The best way to figure out which one works best for you is to experiment with a number of different time periods until you find one that fits your strategy.
Predicting trends in the stock market is no simple process. While it is impossible to predict the future movement of a specific stock, using technical analysis and research can help you make better predictions.
A rising moving average indicates that the security is in an uptrend, while a declining moving average indicates that it is in a downtrend. Similarly, upward momentum is confirmed with a bullish crossover, which occurs when a short-term moving average crosses above a longer-term moving average. Conversely, downward momentum is confirmed with a bearish crossover, which occurs when a short-term moving average crosses below a longer-term moving average.
Types of Moving Averages
Simple Moving Average (SMA)
The simplest form of a moving average, known as a simple moving average (SMA), is calculated by taking the arithmetic mean of a given set of values. In other words, a set of numbers–or prices in the case of financial instruments–are added together and then divided by the number of prices in the set.
Exponential Moving Average (EMA)
The exponential moving average is a type of moving average that gives more weight to recent prices in an attempt to make it more responsive to new information.
To calculate an EMA, you must first compute the simple moving average (SMA) over a particular time period. Next, you must calculate the multiplier for weighting the EMA (referred to as the "smoothing factor"), which typically follows the formula: 2/(selected time period + 1). So, for a 20-day moving average, the multiplier would be 2/(20+1)= 0.0952. Then you use the smoothing factor combined with the previous EMA to arrive at the current value.
The EMA thus gives a higher weighting to recent prices, while the SMA assigns equal weighting to all values.

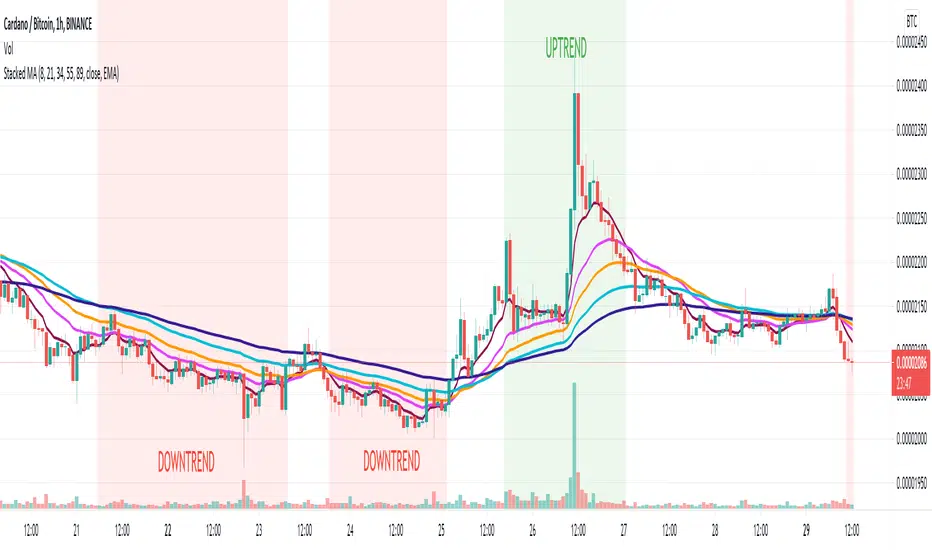
Stacked Moving AveragesThe Stacked Moving Averages indicator lets you see if a ticker is in an uptrend, downtrend, or no trend based on the condition of the moving averages. If the moving averages are stacked such that MA1>MA2>MA3>MA4>MA5, then that is described as an uptrend. If the moving averages are stacked such that MA5>MA4>MA3>MA2>MA1, then that is defined as a downtrend.
The moving averages can be SMA, EMA, or DEMA, and it’s possible to view all the moving average series in the chart or hide all series and only see if there is an uptrend or downtrend according to the condition.
Note: If length 4 OR length 5 is zero the MA4 OR MA5 will be ignored.
Reivaj MA - PreSession This script contains 9 moving averages which can be changed each between "sma", "ema", "wma", "vwma.
The values of the moving averages are:
MMA20 = SMA20
MMA50 = SMA50
MMA100 = SMA100
MMA200 = SMA200
MMA300 = SMA300.
MMAextra1 = ema 8
MMAextra2 = ema21
MMAextra3 = sma400
MMAextra4 = sma500.
It has an Asian range that goes from 21: 00-07: 00 UTC which turns the color of the candle in green.
And pre-sessions that is one hour before the opening, the time of the opening and the hour after the opening of London and New York.

200 EMA RoC Vs IndexThis indicator calculates 200 EMA rate of Change, between today's value vs yesterday's value
I found it useful and easier to track the trend.
I added 50 SMA as additional help top calculate averages between data. if the 50 SMA crosses over it will show gray background, and red if it crosses down.
The Histogram represent Index data.
Best use for Stock Market