MACD-Extendido-Estrategia por Neil--------------------------------
MACD-Extendida-Estrategia
--------------------------------
DESCRIPTION
Resource that identifies entry and exit operations using the indicator
Average Convergence and Divergence Movements ( MACD ) and 5 strategies
INTERESTING
Novel strategies are implemented such as:
1. Overbought and oversold band to avoid horizontal movements
2. Control inputs and outputs at positions opposite the histogram line
3. Make a profit (take profit) without prior purchase orders
HOW DOES IT WORK (STRATEGIES)
1) Overbought and oversold:
Allows you to define an overbought upper band
Allows you to define an oversold ower band
Operations that occur within the band are ignored
2) Place of next operation (either side):
Indicates that the next operation can occur on either side of the histogram
3) Place of next operation (opposite side):
Indicates that the next operation must occur on the opposite side of the histogram
4) Take profit:
It allows defining the deviation in favor to execute a take profit.
It does not place a buy order at a distant point, instead it looks back and if the shift meets the expected deviation, take profit is executed
5) Loss control (stop loss):
It allows to define the deviation against to execute a stop loss.
It does not place a stop order at a distant point, instead it looks back and if the displacement meets the expected deviation the stop loss is executed
How to use it:
Press the "Indicators" option, go to the "Public Librarian" segment, write the name "MACD-Extended-Strategy by Neil", double-click on the record in question and you will have it added in your work panel, now, just It remains to be used to identify the inputs and outputs and you can do it visually or by defining the automatic notification alerts.
--------------------------------
MACD-Extendida-Estrategia
--------------------------------
DESCRIPCION
Recurso que identifica operaciones de entradas y salida haciendo uso del indicador
Media móvil de Convergencia/Divergencia ( MACD ) y 5 estrategias
NOVEDADES
Se implementan estrategias novedosas como:
1. Banda de sobrecompra y sobreventa para esquivar movimientos horizontales
2. Control de entradas y salidas en posiciones contrarias a la línea del histograma
3. Toma de ganancias (take profit) sin ordenes de compra previa
COMO FUNCIONA (ESTRATEGIAS)
1) Sobrecompra y Sobreventa:
Permite definir una banda superior de sobrecompra
Permite definir una banda inferior de sobreventa
Operaciones que ocurren dentro de la banda son ignoradas
2) Lugar de próxima operación (cualquier lado):
Indica que la próxima operación puede ocurrir en cualquier lado del histograma
3) Lugar de próxima operación (lado opuesto):
Indica que la próxima operación debe ocurrir en el lado opuesto del histograma
4) Toma de ganancias (take profit):
Permite definir la desviación a favor para ejecutar una toma de ganancia.
No coloca una orden de compra en un punto distante, en su lugar mira hacia atrás y si el desplazamiento cumple con la desviación esperada se ejecuta la toma de ganancia
5) Control de pérdida (stop loss):
Permite definir la desviación en contra para ejecutar una parada de pérdida.
No coloca una orden de parada en un punto distante, en su lugar mira hacia atrás y si el desplazamiento cumple con la desviación esperada se ejecuta la parada de la pérdida
Como usarlo:
Presione la opción "Indicadores", ubíquese en el segmento "Libreria Publica", escriba el nombre "MACD-Extendido-Estrategia por Neil", haga doble clic sobre el registro en cuestión y lo tendrá agregado en su panel de trabajo, ahora, solo resta usarlo para identificar las entradas y salidas y puede hacerlo de forma visual o definiendo las alertas de notificación automática.
Sma

SMA Offset StrategyThis strategy uses simple moving averages and some math to determine buy/sell points. We keep a SMA 100 day line as our basis for our offset. If the close price is below the line, we choose our open position based on how low below the line it is goes, this value (Low Offset) is a percentage and can be configured by the user. Same for closing your position, when the close is above our SMA 100 line, we determine how high above the line before selling. If we try to sell too early (while the price is still rising), the trailing stop loss will kick in. Backtested with Bitcoin and Ethereum.
Configurable variables:
SMA Fast (default is 14 days)
SMA Slow (default is 100)
SMA Reference (default is 30)
Low Offset % (default is 0.001)
High Offset % (default is 0.0164)
Order Stake % (default is 0.96)
Trailing stop loss % (default is 1.35)

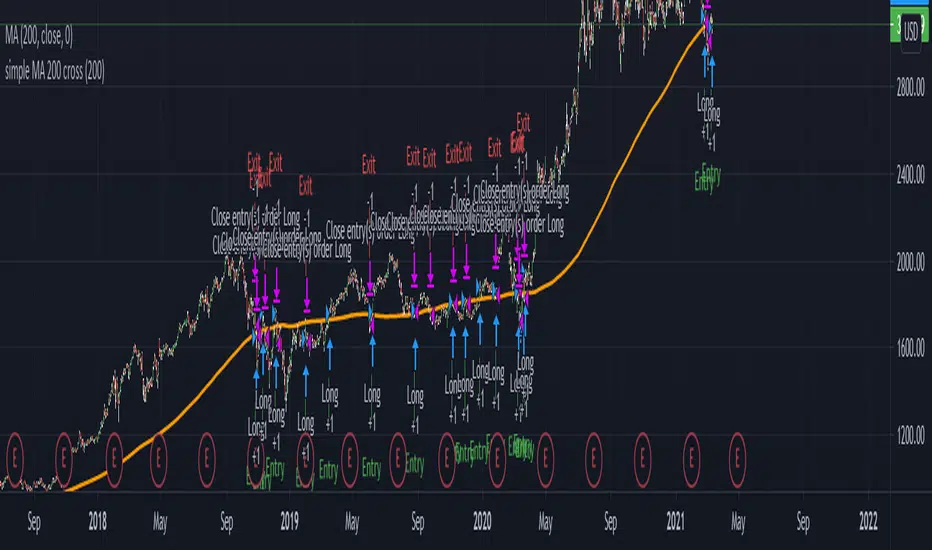
SMA-Extendido-Estrategia por NeilDescription:
Strategy that identifies entry and exit operations, using 3 moving averages and 5 strategies. New strategies are implemented such as the prediction of closing operations, independent of the events that justify entry operations.
How does it work:
1) Long strategy: if SMA5 crosses up to SMA200 and SMA200 is bullish, a buy operation begins, if SMA5 crosses down to SMA200 and SMA200 is bearish, a sale begins.
2) Short strategy with smooth filtering of operations: if SMA5 crosses up to SMA20 and SMA20 is bullish and (SMA5 are above SMA200) a buy operation is initiated. If SMA5 crosses down to SMA20 and SMA20 is bearish and (SMA5 are below SMA200) a sell trade is initiated
3) Short strategy with strong filtering of operations: if SMA5 crosses up to SMA20 and SMA20 is bullish and (SMA5 and SMA20 are above SMA200 and SMA200 is bullish) a buy is initiated, in other words, buy operations occur only if SMA5 and SMA20 are above SMA200; if SMA5 crosses down to SMA20 and SMA20 is bearish and (SMA5 and SMA20 are below SMA200 and SMA200 is bearish) a sell is initiated, that is, sell operations occur only if SMA5 and SMA20 are below SMA200
4) Short strategy without filtering operations: if SMA5 crosses up to SMA20 and SMA20 is bullish, a buy is initiated (the location of MA200 does not matter). If SMA5 crosses down to SMA20 and SMA20 is bearish, a sell is initiated (it does not matter where the MA200 is located)
5) Prediction of closing operations: the algorithm evaluates potential closing operations differently and considers the following rules: If there is an active buy trade and SMA5 crosses down to SMA20, we close the current buy (the location of the SMA200 does not matter). If there is an active sell trade and SMA5 crosses up to SMA20, we close the sale in progress (the location of the SMA200 does not matter)
How to use it:
Press the "Indicators" option, go to the "Public Librarian" segment, write the name "SMA-Extendido-Estrategia por Neil", double-click on the record in question and you will have it added in your work panel, now, just It remains to be used to identify the inputs and outputs and you can do it visually or by defining the automatic notification alerts.

TDI Hedge Strategy
This is the incomplete version but upon multiple requests, I have released it early. All of the strategy and alert functions are yet to be written and I'll get around to it soon.
This indicator aims to be the best TDI indicator on TradingView. It is a strategy or study. It will have all of the filter, entry, and exit conditions for the strategies around the TDI.
What is implemented
MFI or RSI: the MFI is a much better TDI baseline than the RSI, in my opinion, and very effective
EMA or SMA used for the moving averages on fast, slow, and volatility band
Dynamic timeframe: set a factor of current timeframe and indicator will analyse higher timeframe automatically
Manual timeframe: set a higher timeframe to analyse different to currently viewed
Features for later
conditions for TDI filters/entries/exits
Strategy functions to use built-in strategy tester
BTE signal plot for Backtesting & Trading Engine
alerts
Enjoy!

SNAP BACK 2.0 Strategy
This strategy is designed to allow you to catch the bounce or "SNAP Back" of an equity that has been in a trend.
1) Once the moving averages are in the order of 200SMA > 50 SMA > 34EMA > 20SMA > 8EMA (or reverse for and uptrend), the strategy is setup.
2) Next you wait for a trigger of the closing price crossing the 8EMA, while there is a desired gap size between the 8EMA and the 20SMA (2-10% of stock value preferred).
3) Exit position based on target profit reached (conservative sell half at 34EMA and engage a trailing stop loss for remainder or set static limit) or price crosses 8EMA or stop loss%
*)This code also allows you to determine your desired backtesting date compliments of alanaster
This code is the product of many hours of hard work on the part of the greater tradingview community. The credit goes to everyone in the community who has put code out there for the greater good.
The idea for the coding came from a video I watched on YouTube presented by TradeStation called Snap Back - thank you guys for the inspiration.
UPDATE: I have coded the other side of the strategy to allow you to take advantage of the same set-up in an uptrend for Short plays. You can turn the up or downsides on, off, or both.
The main intent is to catch the bounces of a falling stock. However, I have found that you can do the inverse and catch the drops in a rising stock (the latter is not as reliable). This also tends to work better on less volatile stocks. I have included a large volume of user defined conditions and display entry and exit conditions on the chart to see how your choices are impacting the script.

Basic SMA 200 StrategyThe SMA 200 basic strategy will be more than familiar to most traders.
This strategy is to stay with the programming language so to say the "Hello World" of trading.
The SMA 200 basic strategy is also one of the simplest strategies in trading. All that is required is the price and a 200 period moving average. Usually the strategy is used in the daily chart.
The rules are as follows:
Entry: A position is opened when the price crosses the moving average 200 from the bottom to the top.
Exit: The position is closed when the price crosses the moving average from top to bottom.
This is a trend following system and was originally used for trading stocks.
In my opinion, trading with the strategy is recommended to every beginner. There are strategies with better performance, but they are much more complicated to implement. And that's where the big advantage of the strategy can be seen.
Beginners are more than overwhelmed at the beginning of their trading career. Often beginners trade in the 5 min chart with 6 different indicators some signals that they have seen in a Youtube video.
Comparable to a beginner driver who immediately gets into a Porsche as his first car.
Beginners should follow simple rules and avoid intraday charts. Above all, you should do the actual work of a trader.A trader does not just press the mouse twenty times a day and then has easily earned 2000 $. A trader tests systems down to the smallest detail, optimizes and tests again, until he has found an almost " waterproof " trading system. The 200 SMA basic strategy is excellent for gaining experience, learning to follow the rules of a system and not to burn your money right away.
With this script you can test how successful the "simplest strategy in the world" would have been in the past.
Small tip: Do not trade Forex with it it will never work. The strategy is made for long trends and you can find them for example in the stock market.
Have fun with it! About a positive feedback I would be very happy of course.
Scalping using RSI 2 indicator with TSLThis strategy implements a simply scalping using the RSI (calculated on two periods), the slopes of two MAs ( EMA or SMA ) having different lengths (by default, I use 50 and 200).
A trailing stop loss (%) is used.
Entry conditions:
.) Fast MA > Slow MA and Price > Slow MA and RSI < Oversold Threshold ------> go Long
.) Fast MA < Slow MA and Price < Slow MA and RSI > Overbought Threshold ------> go Short
Exit conditions:
.) Long entry condition is true and (close >= TP or close <= TSL ) ----> close short position
.) Short entry condition is true and (close <= TP or close >= TSL ) ----> close long position
The strategy performed best on Bitcoin and the most liquid and capitalized Altcoins but works excellent on volatile assets, mainly if they often go trending.
Works best on 3h - 4h time frame.
There's also an optional Volatility filter, which opens the position only if the difference between the two slopes is more than a specific value, which can be set in the study inputs. The purpose is not opening positions if the price goes sideways and the noise is way > than the signal.
Note:
.) the RSI length is 2;
.) the oversold Threshold is 90%;
.) the overbought Threshold is 10%;
.) by default, the trailing stop loss per cent is 1%;
.) by default, the fast MA length is 50;
.) by default, the slow MA length is 200;
.) by default, the MA used is EMA.
Cheers.

Triple SMA Strategy with entries based on sma price closesHi! :)
This strategy is made for intraday trades, especially on 5 sec - 5 min charts to follow the trend.
I have not tested on higher timeframes, but feel free to play with the values.
I have set a basic value for the 3 SMA at
-200
-400
-600
We will use an oscillator for entries which is not mine. Link ->
The oscillator mentioned above is just for visualization purposes, You do not need to get the signals, but You can see how scripts are generated with different values.
When the price above/below all the 3 SMA and oscillator crosses above/below "value you set" - You will get the buy or sell signal.
Your stop will be where the slowest SMA is.
Pyramiding is set for 10.
You can manually set 3 take profit and quantity levels.
Basic values are 1 %, 2 %, and 6 % for taking profits - You can change it based on how volatile the asset is.
Basic quantity values are 30 % at each level.
Hope You find it useful :)

Combined EMA & MA crossovers [CDI]Implementation of the strategy of moving averages crossings combining two fast and two slow that are used to confirm the entry.
The purpose is to be able to quickly see a backtesting of the strategy by easily configuring the profit / loss percentage. In this script the profit percentage is used for the loss percentage as well.
Additionally you can see the moving averages all in a single chart tool.
In the community to which I belong, this strategy is used in daily candles, especially for swing trading, but it can be used in different time frames.
WARNING:
- For purpose educate only
- The entries are used under your responsibility

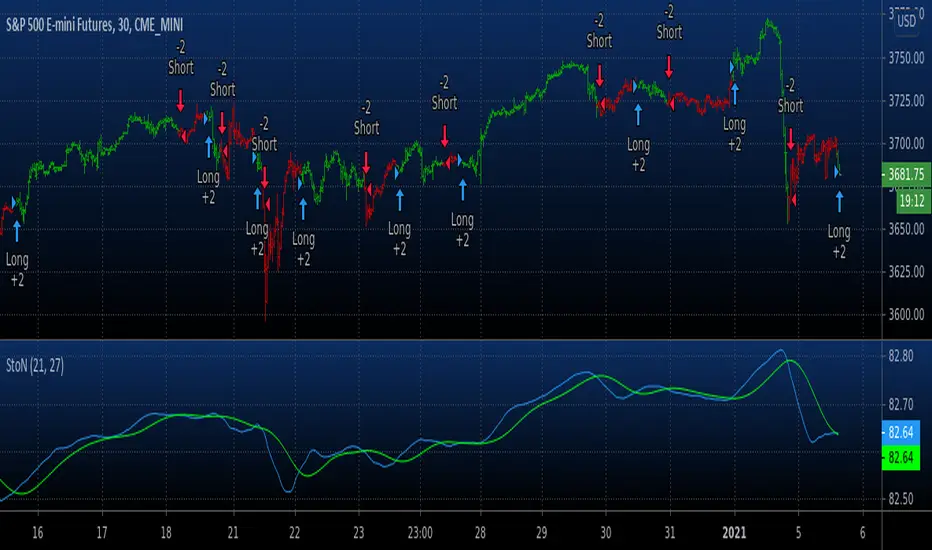
Backtest Signal To Noise This source code is subject to the terms of the Mozilla Public License 2.0 at mozilla.org
© HPotter 05/01/2021
The signal-to-noise (S/N) ratio.
And Simple Moving Average.
Thank you for idea BlockchainYahoo
WARNING:
- For purpose educate only
- This script to change bars colors.
KISS Strategy: SMA + EMA//Hello my fellow investors
//I am creating a simple non-cluttered strategy that uses 3(+1) simple means to determine: viability, entry, and exit
//1) Has a consistent trend been maintained for several days/weeks
//2) SH SMA crossover LG SMA = Bullish entry/LG SMA crossover SH SMA = Bearish entry
//3) Use the Slope factor & Weeks in Trend (WiT) to dertermine how strong of an entry signal you are comfortable with
//4) Exit position based on next SMA cross and trend reversal or stop loss%
//3+1) For added confidence in trend detection: Apply MACD check - buy--> MACD line above signal line and corssover below histogram \\ sell --> MACD line below signal line and crossover above histogram.
//*)This code also allows you to determine your desired backtesting date compliments of alanaster
The chart shown has:
Starting Capital: $10,000
Investment percent per trade: 1.5%
Stop Loss: 20%
Take Profit: 100%
Combo Backtest 123 Reversal & Volume SMA This is combo strategies for get a cumulative signal.
First strategy
This System was created from the Book "How I Tripled My Money In The
Futures Market" by Ulf Jensen, Page 183. This is reverse type of strategies.
The strategy buys at market, if close price is higher than the previous close
during 2 days and the meaning of 9-days Stochastic Slow Oscillator is lower than 50.
The strategy sells at market, if close price is lower than the previous close price
during 2 days and the meaning of 9-days Stochastic Fast Oscillator is higher than 50.
Second strategy
Volume and SMA
WARNING:
- For purpose educate only
- This script to change bars colors.

London breakout GBPUSD daytradeHello,
First I want to WARN THAT YOU NEED A MINIMUM OF 30X LEVERAGE FOR THIS STRATEGY IN ORDER TO WORK.
THE REASON IS THAT THE SIZE IS CALCULATED BASED ON A VERY SHORT STOP LOSS LEVEL IN PIPS
UTILIZE IT AT YOUR OWN RISK
This is a daytrading strategy, that's suited for GBPUSD 1H timechart.
It a very simple strategy that utilizes 2 moving averages : a very fast one and a very slow one.
It will always enter only at the beginning candle of London session, and it will always exit at the candle at the finish of London session.
So the rules are simple :
If its 8 am GMT and the candle close or high cross the slow moving average and we are above at the same over the slow moving average we make a long movement. The oposite condition is applied for short.
At the same time we always use a very small stop loss = 50-100 points ( 5-10 pips).
We dont have a take profit, in our case the trade ends always at the end of London session. In this case at 15h GMT
It might work on other currencies aswell, but it has to be tested first.
For any questions or suggestions, please let me know.

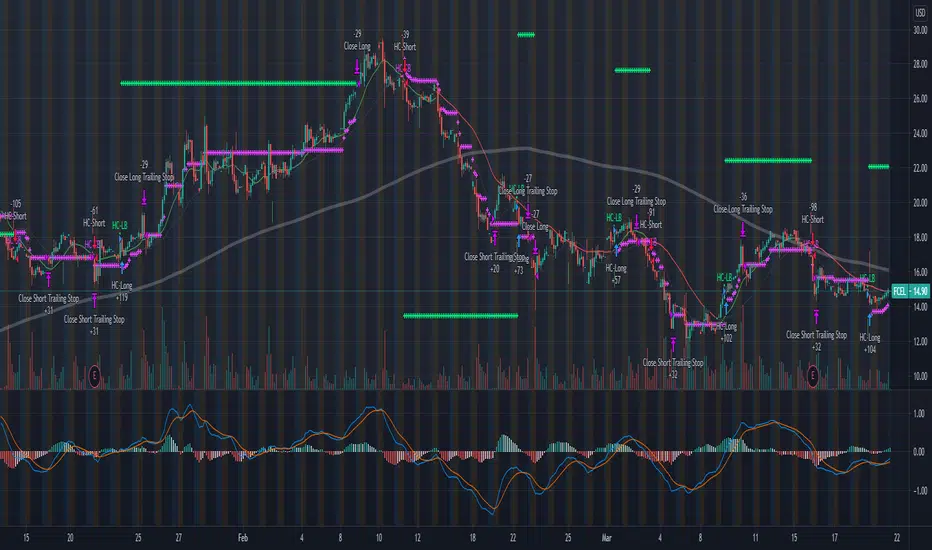
BB21_MA200_StrategyThis strategy follows the trend and keeps you in the trend until it breaks SMA 200
SMA setting is 200
BB setting is 21
BUY
====
when BB is (lower band and upper band) above SMA 200 and price crossing above BB middle line
Partial Exit
==========
When Lower BB crossing down SMA200 , exit 30%
Total Exit
=========
When BB middle band crosses down SMA200 , exit ALL
Stop Loss
======
default is set to 5%
Risk Management
================
This is new parameter I have introduced in my strategies. Default value is 10% . That means , if your capital is 10000 , you are willing to risk 10% of it ... i.e 1000.
It doesnot mean that you are buying shares/units for 1000 only. It is different ...see below
Your trade size is calculated based on Risk% .... capital x risk 5 / stop Loss units
for further explanation you can check Alexander Elder's risk management rule. He mentioned 2% rule for 100K account. But most of us dont have 100K accounts .. . so I have defaulted 10% on 10K account. You can change this values and see the results. It wont change the number of trades or profit factor. It will increase the net profit.
Warning
=======
For educational purposes only

Easy System 420In this strategy, 15 indicators are used, each giving its results as a numerical value, which then is added or subtracted from the total points, gathered from all 15 indicators.
Many thanks to RafaelZioni for his great work making the EasySys1 script which i modified to create this script.
Onchart is drawn some of the indicators, but not all, a info panel is drawn showing the value each indicator has calculated. The info panel can be turned on or off.
Many of the indicator settings can be changed by user, and this is recommended, to tune the strategy to users chosen pair/timeframe.
Therefore any pair or timeframe can be used, the strategy tester results showing possible results, remember to set commission to match your broker. example chart settings here have common crypto exchange commission value: 0.25%
indicator list : SAR + STT + ZigZag + ROC + DMI + CCI + Weis + SMA + AO + MOM + Hist + BB + Ichimoku + HMA

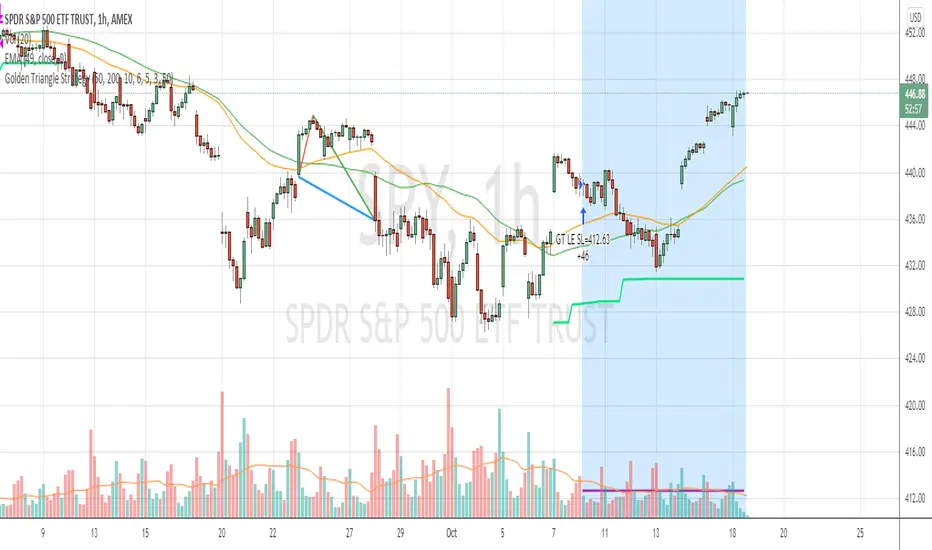
Golden Triangle StrategyGolden Triangle strategy setup is a variation of the buy-the-dip strategy, by Charlotte Hudgin.
You can find the detailed explanation here by Thomas N. Bulkowski thepatternsite.com
BUY
===
1. price should be trading above sma50
2. when it touches sma50 first time , check the starting rallypoint of where it initiated
3. from the above point to current close , see if you have white space , then draw the triangle
4. then check for volume confirmation ( current volume should be greater than last 4 ) --- I have slightly changed this to fit into hourly strategy by adding condition close>vwap
EXIT
====
1. Exit when close crossing down sma50 with at least 2% profit (slightly modified original condition)
StopLoss
========
2. stop loss is set to 6%
Warning
=======
For the use of educational purposes only
Simple SMA Strategy Backtest Part 5Simple SMA strategy
In this stream, we will create an intraday trade cap.
WARNING:
- For purpose educate only
- This script to change bars colors
Stream:
www.tradingview.com

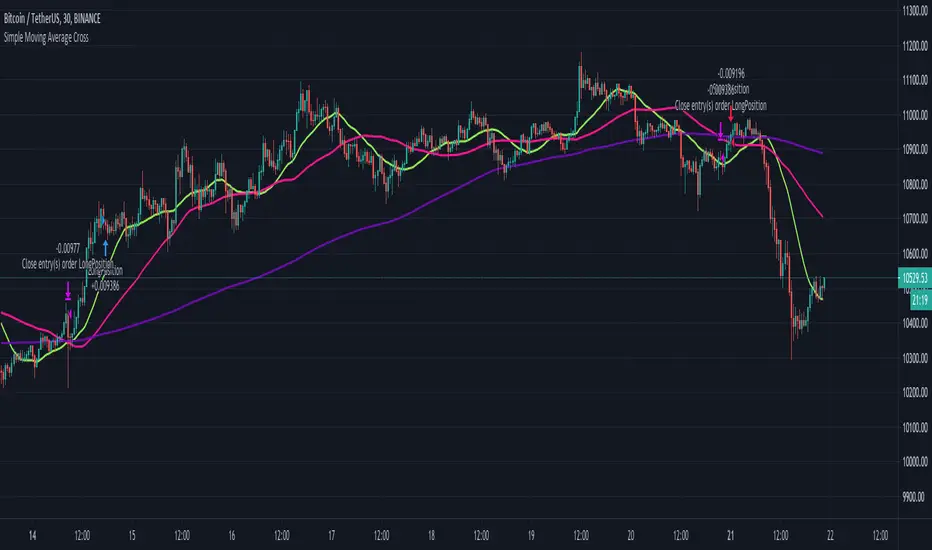
Simple Moving Average CrossThe script uses 3 simple moving averages that you can define (SMA Top, SMA Mid, SMA Long).
Once the SMA Top is above the SMA Mid and the SMA Mid is above the SMA Top a long position is entered.
Once the SMA Top is below the SMA Mid and the SMA Mid is below the SMA Top a short position is entered.
You may define how long before these positions are entered by adjusting the bars in the Inputs section.
A setting of 0 will enter a position as soon as the conditions are met,
whereas a setting of 5 will wait 5 bars after the conditions are met before entering the positions.
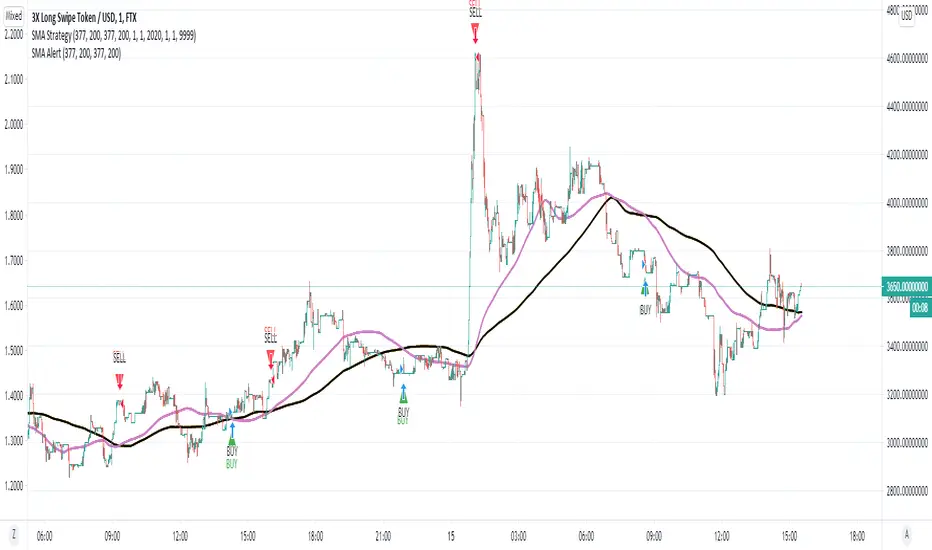
SMA StrategyIn this strategy, I took advantage of two different sma intersections for buying and selling points. You can use the intersection of 2 sma values for buying and 2 separate sma intersection for selling.
The main purpose of this strategy is to calculate the rate of return of the indicator belonging to this system. You can access the indicator version from this link and set an alarm.
Koala System EURUSD 15minToday I bring you one of the best systems I have found for 15min chart for EURUSD, can be adapted to other pairs aswell I suppose.
Its made of 4 SMA 3 6 9 50 and EMA 200.
It only makes 1 trade per day, in this case we have a risk % of our total eqquity, being the min 0.1 lots , can be changed tho .
We target TP/SL the same 1:1 rr, in this case I use 30 pips for both., that means I risk maximum 30$ out of a total of 1000 equity , per each trade , with 3%
Entry is simple : price is below all movings averages for sell or above for buy. At the same time we check that the ma's are in ascending or descending order.
The key here is patience, never make more than one trade per day.
System always close the trade at the end of london session. Also it only works, during the london session.
Enjoy it.

M4x Rainbow strategyReal Grid Trend Multiplier & SMA
"M4x Rainbow" is a Grid Trend Multiplier bot, who is following an adjustable SMA.
"M4x Rainbow" is not bound on FIFO, each trade get's his own exit.
It is set for Pyramiding=0, which can be changed in the "Strategy" line
Fees are set equal to Binance numbers at 0.1%, about...
!!! Pin to existing scale !!!
Or switch the main Indicator off.
Adjustable Settings:
- Profit % per Step (0-1000%)
- SMA lenght (0-4000)
Alerts: (one Alert is one step)
- longRain
- shortRAIN
The coloring of the lines is:
green = linestate is LONG
blue = linestate is WAIT
yellow = linestate is SHORT
!!! Tested only on 1 Minute Chart !!!
Give it a try and let me know.
...have fun ;-)

COPPER 5Mins BUY/SELL StrategyCopper Buy/Sell Indicator for Copper Future Contracts (since tested only on copper) based on Simple Moving Average.
This works based on the gap between the price and sma along with the open and close value.
This sets target as 2 points and stop loss as 3 points. The position may reverse based on the scenario. Works well with 5 mins timeframe.

Simple SMA Strategy Backtest Part 4Added Take Profit and Stop Loss logic.
Part 4 :
www.tradingview.com
Part 3:
www.tradingview.com
