ChrixBBThis is a special flavor of Bollinger Bands strategy, with RSI , MFI and Stochastic checks. All the indicators act as oscillators, except for Stochastic , that can also be used with crossover/crossunder triggers. Contact me for access.
Chỉ báo Stochastic RSI (STOCH RSI)


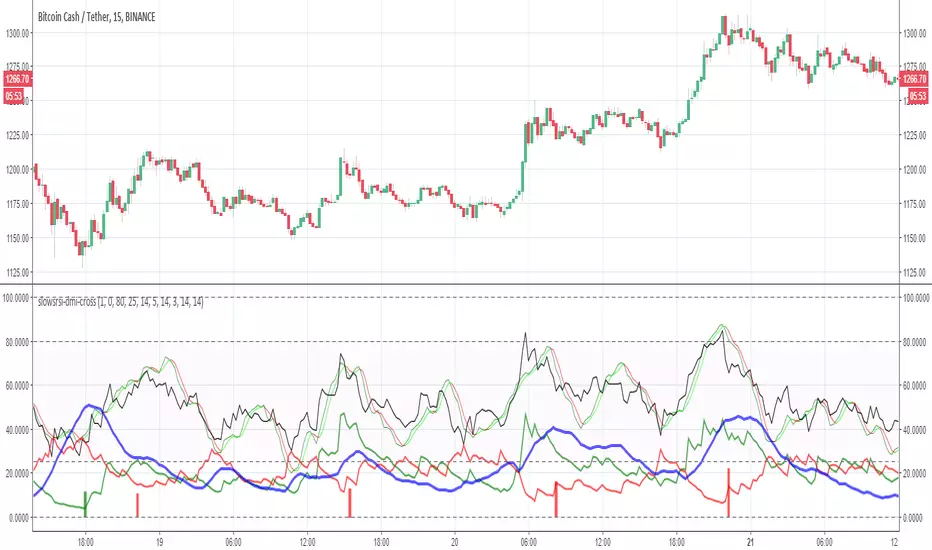
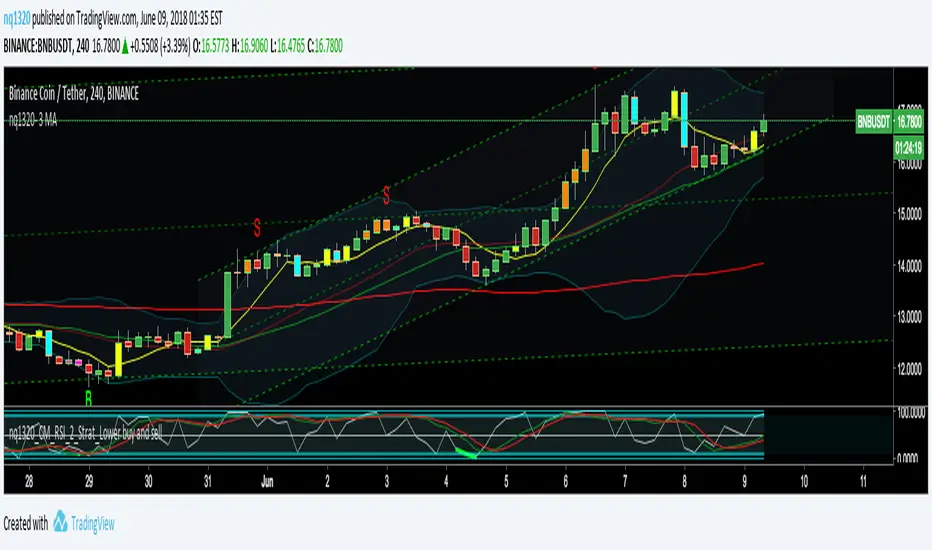
slowsrsi-dmi-crossThis model is based on buy and sell points according to rsi +DMI and the cross up of slow stoch
dmi-srsi-candle v1very similar to previous version only here instead of using rsi dmi system , I use only dmi srsi cross up as seen as green and red trinangular on top or buttom. fib candles are the same no modification best buy if candles bellow 10 and sell if candles above 90

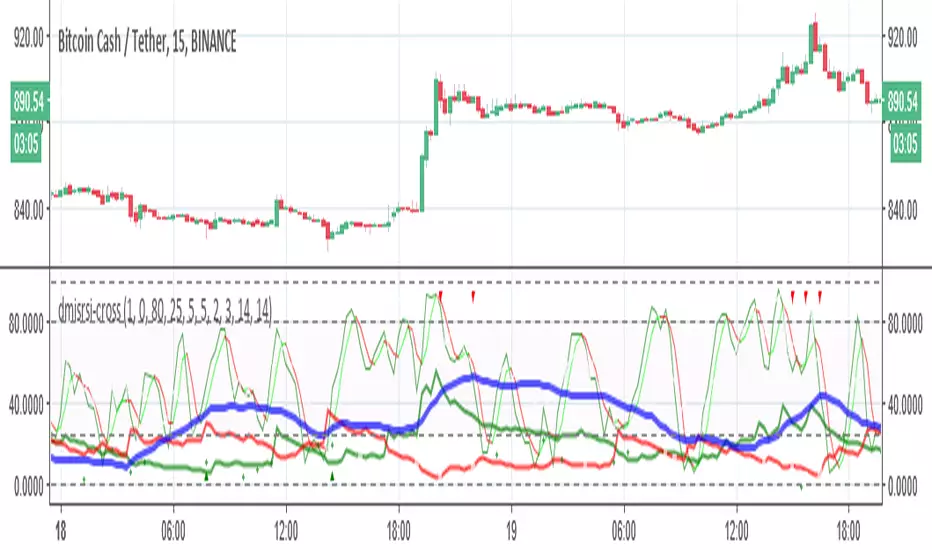
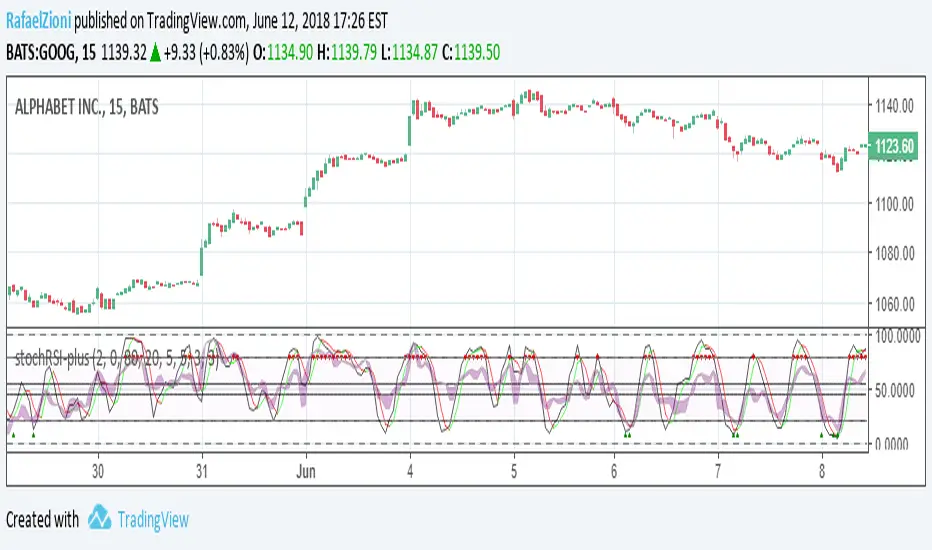
dmi-srsi-crossthis indicator show you the best buy points and sell points on a combination of DMI and SRSI cross up or down represented in green or red triangular dots
dmi-srsi-candleThe indicator has 3 part
1. buy sell pints based on rsi and stoch and DMI = green red trinagukar
2. crossing up of srsi =green cross points
3. fibonaci candels= below 10 best buy ,above 90 =best sell according to candles

stochrsi-histo-candleHave fun I hope you will like it :) its a special stoch rsi design with relation of candels and fib levels

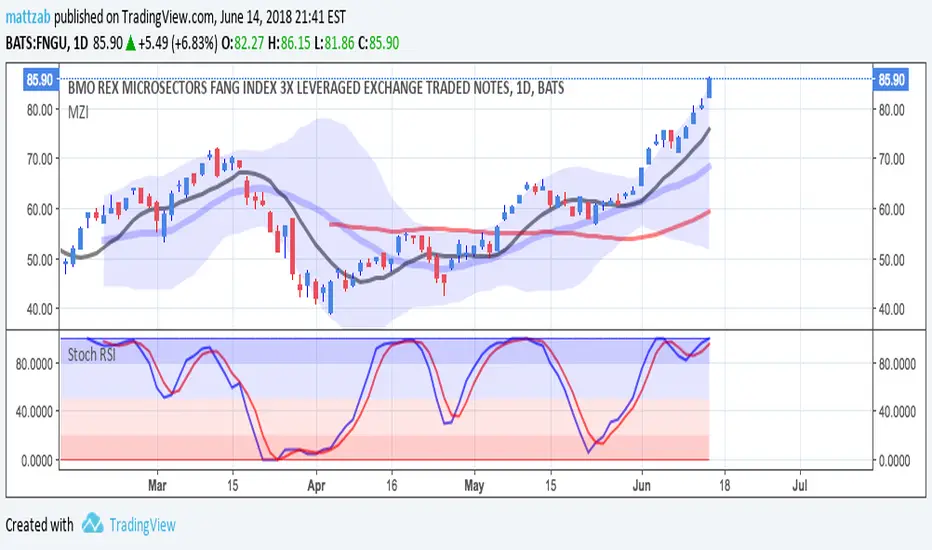
Bull Bear Stoch RSIStandard Stoch RSI with some color modification. 0 - 20 = Really Bearish (Dark Red Zone) 20 - 50 = Bearish (Light Red Zone) 50 - 80 = Bullish (Light Blue Zone) and 80 - 100 = Really Bullish (Strong Blue Zone). Thick lines at top and bottom to easily see 100 and 0.
StochRSI RangeIndicator for getting StochRSI reading while looking at RSI.
White background plots RSI lows and highs over lookback period. (14 is the default)
Both lines are smoothed like original RSI.

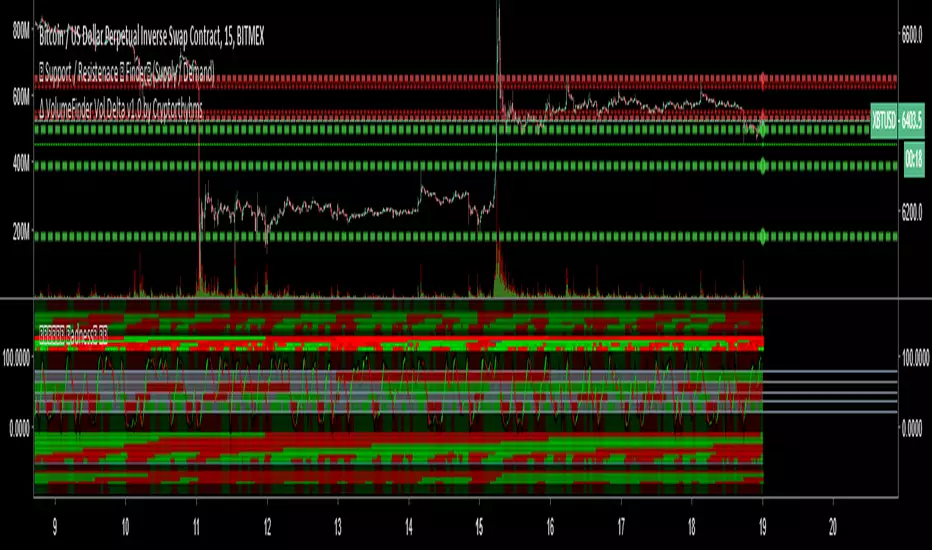
BottomFinder MTF Madness - 5x MTF Grid IndicatorsHello Again Trading View!
Bottom Finder Team here bringing another delicious indicator, this time to help spot those trends! This version is closed for Beta Testing with our subscribers only for the next few weeks. After beta improvements it will be released free to anyone who signs up as a free member on our site.
This is meant to be used on the 15m timeframe, and it looks up into higher TF's. It is meant to be maximized, so have this open in one tab and the chart on another. Dual Monitors are best. All options and Time frames are fully configurable inputs.
Indicators from top to bottom are:
1.)Polarity Filtration - 6 Timeframes
2.)Price Volume Trend - 4 Timeframes
3.)Stochastic RSI - 4 Timeframe Grid, and Current Timeframe in lines/ribbons
4.)MACD Crossovers - 8 Timeframes
5.)SuperTrend - 4 Timeframes
And last...
6.)Background Color indicator is up/down (green/red) price on 1 Hour Heiken Ashi candle chart.
No more swapping back and forth between timeframes!
For access to this and many other exclusive indicators - you can visit our telegram and ask about becoming a subscriber. All our paid indicators have a reasonable lifetime cap price. Once you reach it, indicator is yours for life - no more subscription.

PT2_Stochastic RSI / MACDThis indicator is designed for use with Profit Trailer version 2 and plots the values of RSI, Stochastic, StochasticRSI and MACD.
Due to the decimal values that they all produce, There are some important things to understand before using this indicator.
In PT2, RSI and Stochastic require values between 0 and 100, but StochasticRSI requires values between 0.00 and 1.00. Because of this the following needs to be understood.
RSI:
----
The buy and sell values and limits are inputted as values between 0 and 100, but they get divided by 100 so to map alongside StochasticRSI on the indicator scale.
In other words an RSI buy value inputted as 30 will display as 0.3, but in your PT2 settings you would still input 30.
Stochastic:
-------------
Stochastic and StochasticRSI share common buy and sell value input fields for this indicator (so you can't use BOTH Stochastic and StochasticRSI at the same time, in the same indicator).
The buy and sell values and limits, need to be written as decimal values between 0.00 and 1.00 even though within the PT2 settings, Stochastic is inputted as values between 0 and 100.
So when translating values from this indicator to your PT2 settings, a Stochastic Buy Value of 0.3 in this indicator will be written in your PT2 settings as 30. Just like RSI.
StochasticRSI:
-----------------
PT2 uses StochasticRSI values between 0.00 and 1.00 (as mentioned above). It is because of this, to enable RSI and Stochastic to display together, everything is displayed using the decimal notation of between 0.00 and 1.00.
MACD:
--------
The MACD is completely different and produces a decimal value down to 9 decimal places as used in PT2, making it not compatible with the RSI and Stochastic values.
So at the top of the settings of this indicator, you need to choose which indicator you wish to view at a time (Stochastic-RSI or MACD, not both).
Also, Trading view doesn't handle negative decimals down to 9 places very well, so the Buy/Sell Value/Limit numbers you enter here will be divided by 100,000,000.
This means that if you enter a MACD Sell Value of -250 in this indicator, it gets translated to -0.000000250. This would be the decimal value you would put in your PT2 settings.
======================================================================================================================================================
I hope this indicator helps you all out, feel free to show any appreciation you have in what ever way you feel you can.
// Created 2018 - by @Squiggles#8806
// LTC Tip Jar: LX4bUBdjiRPsagUbZoAczSGgDC4YqTJL7w
======================================================================================================================================================


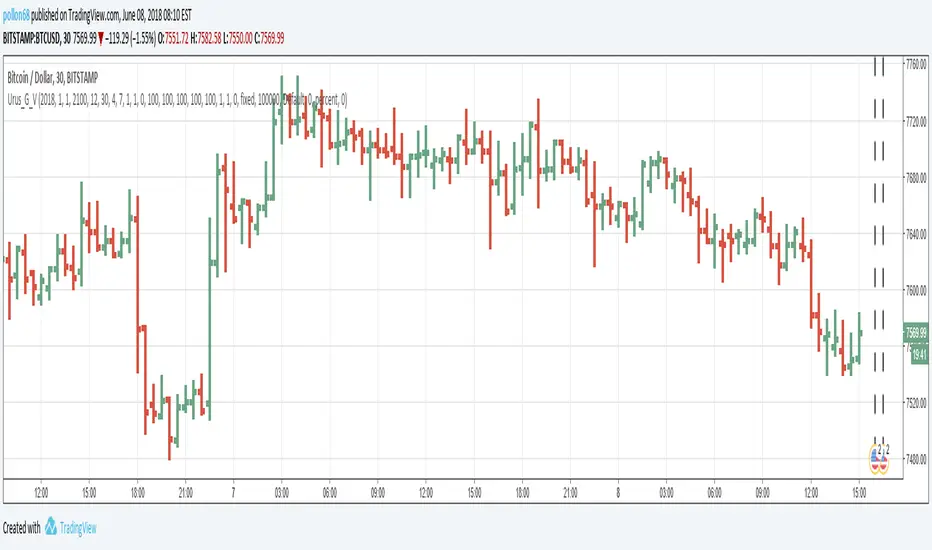
Zero Cross Buy/SellThis is an oscillator.
Buy on zero cross from below.
Sell on zero cross from above.
It prevents risky buys when price is too high and too low. It is capable of recognizing long bear runs to prevent you prom buying
Best used with Bollinger Bands.
Based on RSI and Stochastic RSI

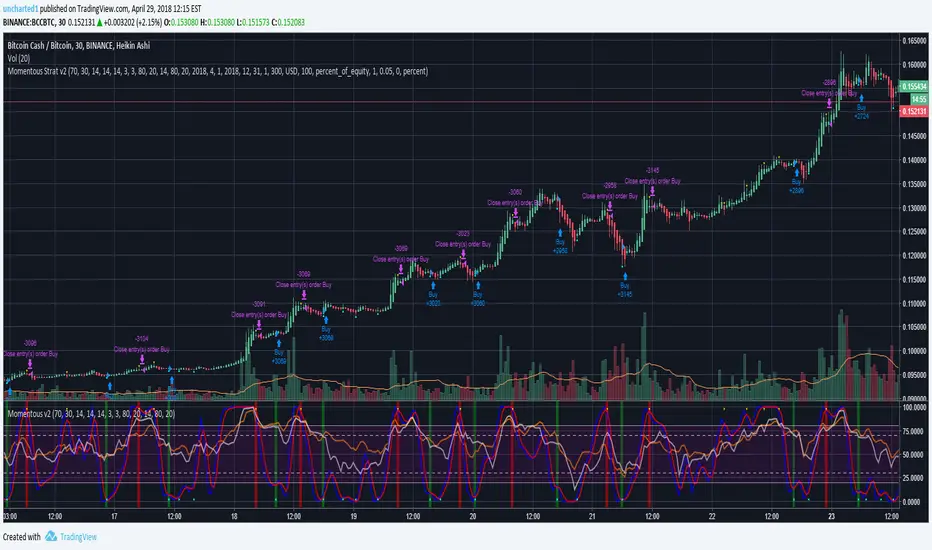
uncharted1 - Momentous Strat v2Strategy accompanying the study of the same name; uses RSI, StochRSI, and MFI indicators. Mix and match to find what you think could be the best entries and exits using these indicator combinations. All the switches are in the Inputs page so have fun with it. I created this primarily for crypto currencies and long positions. Perfect for users of AutoView. Backtest component by @pbergden included.
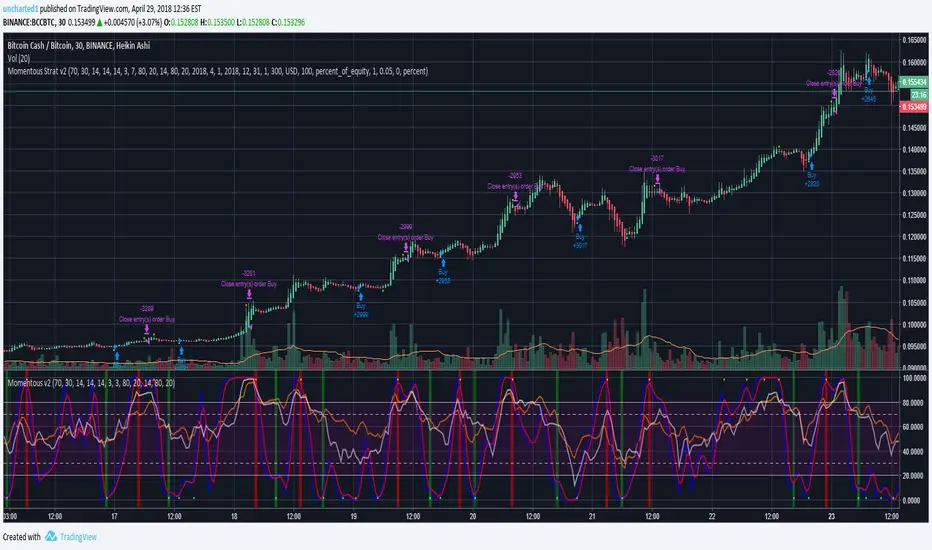
uncharted1 - Momentous v2Study using RSI, StochRSI, and MFI indicators. Mix and match to find your best entries and exits using these indicator combinations. All the switches are in the Inputs page so have fun with it. Alert setups are easy. I created this primarily for crypto currencies and long positions. Perfect for users of AutoView. Backtest component by @pbergden included.
Alert conditions are easy enough to set up. Just use 'Buy Alert' and 'Sell Alert'.

uncharted1 - Momentous v2Study using RSI, StochRSI, and MFI indicators. Mix and match to find what you think could be the best entries and exits using these indicator combinations. All the switches are in the Inputs page so have fun with it. Alert setups are easy. I created this primarily for crypto currencies and long positions. Perfect for users of AutoView.
Alert conditions are easy enough to set up. Just use 'Buy Alert' and 'Sell Alert'.