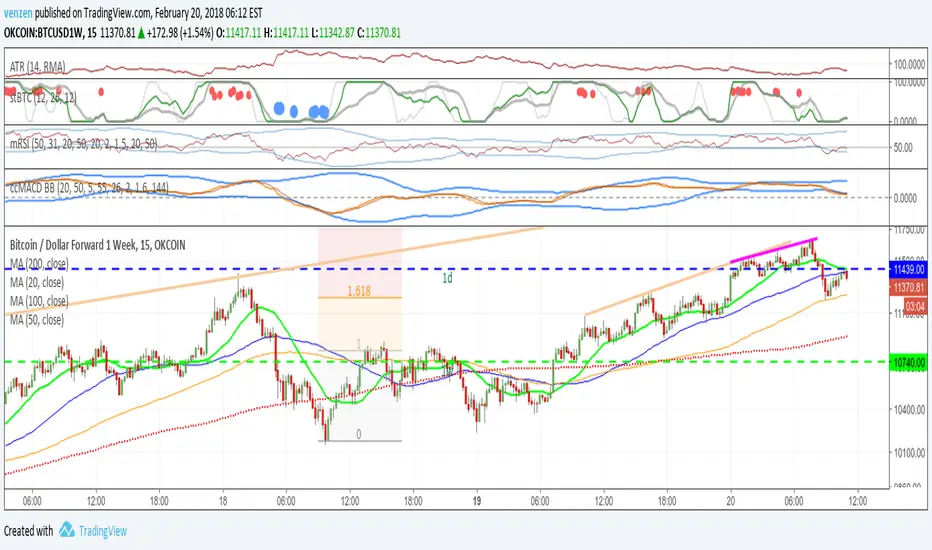
stochBTCThis indicator displays a fast, medium and slow stochastic representation of MACD in a single panel.
Go to "Settings" > "Style" to cutomise display.
Chỉ báo Stochastic RSI (STOCH RSI)
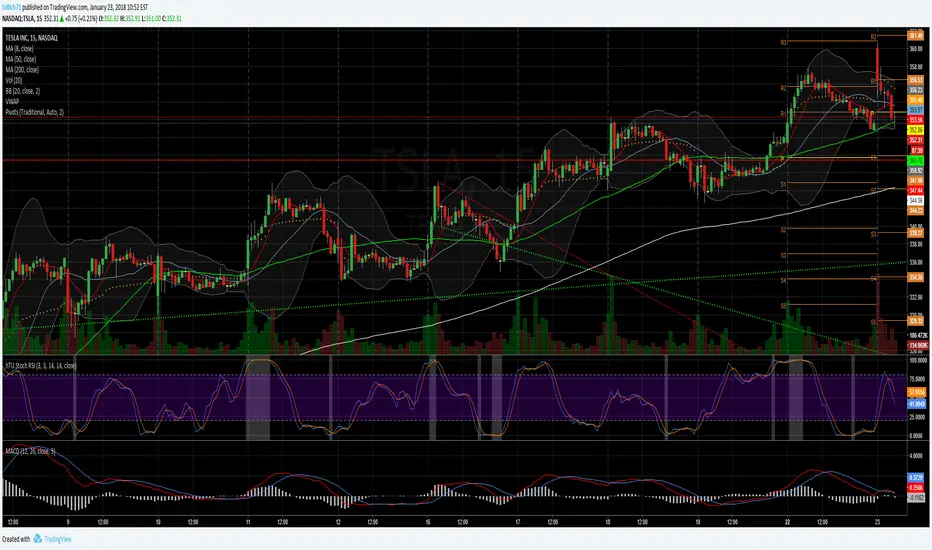
RSI / Stoch / Stoch RSI (SRSI) Overlay [SigmaDraconis]Combines RSI, Stochastic and Stochastic RSI (SRSI) in only one indicator.
Most useful to better pick tops and bottoms on oversold and overbought levels.
I decided to write it since I felt the need to look at how all 3 behaved at once, relative to each.
If you like it, here are my tip jars:
BTC: 1CfBVcxmrx7Uxw3SYJWVGKZsEK698fwXP9
LTC: LXXt76wWTksLcM5qbbiAxfP1o8SoxwzDH2
BTS: sigma-draconis

RSI / Stoch / Stoch RSI (SRSI) Overlay [SigmaDraconis]One indicator combining RSI, Stochastic Oscillator and Stochastic RSI in one.
Credits for rwhiteside and his RSI / Stoch RSI Overlay indicator who served as inspiration to all three.
I believe this will be very useful to a lot of people.
If you like, use and i prove to be , you can contribute to my
TIP JAR :

BB/StochRSI Strategy Backtest For Crypto BotThumbs Up for access
Buy is triggered when the price reaches chosen percent of lower Bollinger Band, Stoch RSI is oversold and there's a K/D signal crossover. The exit is when StochRSI is Overbought or K/D Crossover (toggle) AND/OR (toggle) price is greater than or equal to Top or Mid Bollinger Band (toggle).
Use 15m charts. It works excellent for consolidating/sideways markets and good for bullish impulsive moves but takes losses during impulsive downside market moves.
Results will be better in real-time. The script calculates the price based on the close, but a bot would calculate in real-time. Entries would be better. I recommend manually testing the strategy by using the "Date and Price Range" tool in TradingView.
I'll share the source code to those who wish to collaborate for improving profitability.

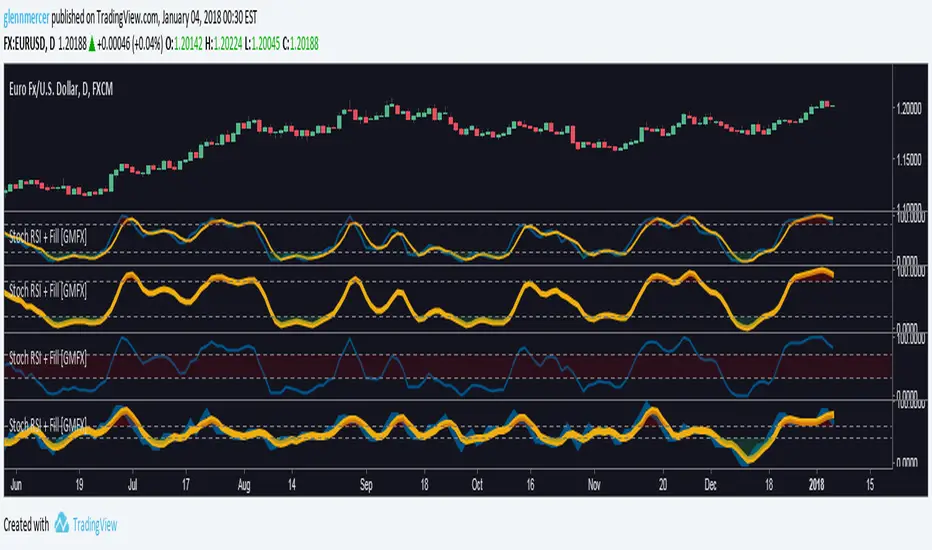
Stochastic RSI w/ Fill [GMercerFX]This is a variation on the StochRSI indicator with MANY more options for customization. These options include:
Color fill for OB and OS conditions on either K or D values
Ability to fill center or disable
Adjustable overbought and oversold levels
Easy line width adjustments
Ability to show or hide either k or d lines
All original StochRSI options
Enjoy!
@gmercerfx
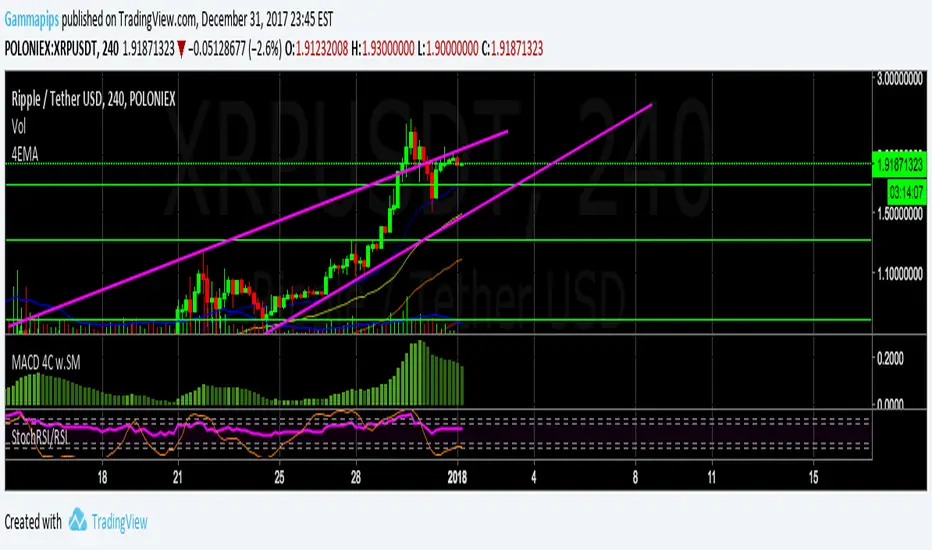
RSI + Stoch/RSIThis is a combination of 2 of the most used indicators. RSI and stochastic/RSI
Ive coded them both to work together to save space on your chart and work as only ONE indicator.
I specifically only use the D line with my rsi , but you have the option to use the K and D line if you so choose.
RSI is good for momentum
Stochastic is good for short term momentum.
They work very well together and if you are a swing trader or scalper they can help immensely when looking for sniper entry areas after you've done you're initial pattern, level, fibonacci and wave analysis.
I like the way this works and have been using these two indicators for a while so I figured I would share.
Happy new year everyone, God bless!
stochifyStochastic RSI reflected in candles. Adds an element of caution when overbought, and an element of opportunity when oversold. BTFD.

Stochastic RSI MTF - 4 REALStochastic RSI Multi-timeframes
4 simultaneous timeframes on one indicator
This indicator is invite only, if you want to try it ask for access in comments

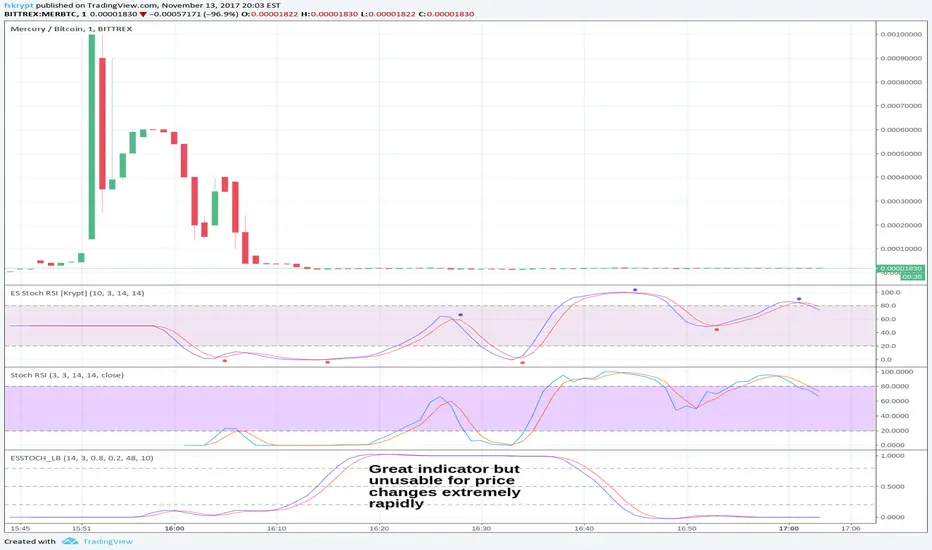
Ehlers-Smoothed Stochastic RSI [Krypt]This script uses a regular Stochastic RSI formula and then runs Ehlers' Super Smoother on top of it. It also provides buy/sell signals on crossovers.
The script is inspired by LazyBear Ehlers-Smoothed Stochastic RSI with Roofing Filter, except I find that the Roofing filter (existing implementation) does not work well near extreme price changes, where a regular formula is preferable. The Ehlers Super Smoother however is excellent and seems to provide earlier signals in most cases than an EMA-EMA smoother. Combined, the super-smoother and regular Stochastic RSI formula provide very good results.


Cuathro EMA StrategyIt's a long term script based on multiples EMA, crossover and crossunder.
Based on two good scripts CM Sling and OCC.
Always adjust resolution at least twice than chart.
Enjoy it! BTCUSD

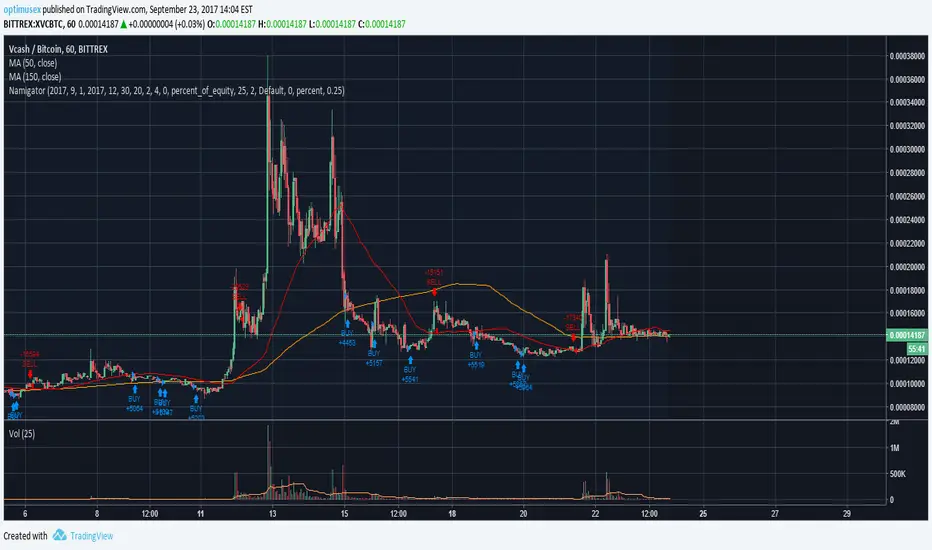
Log-space Stochastic RSISimilar to regular Stochastic RSI except usable even with charts that show dramatic (10x or more) volatility, such as in the beginning of the ZEC-BTC chart in the example attached.

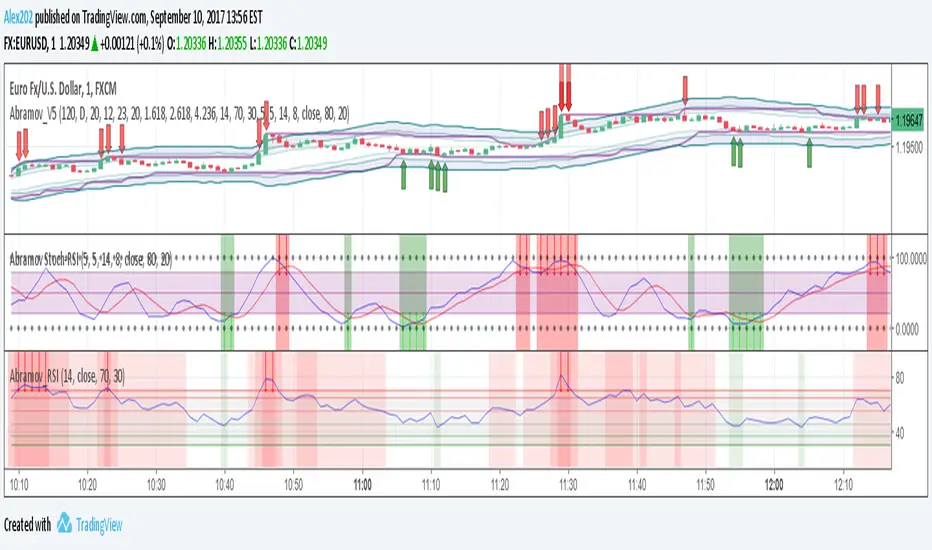
Abramov_V5Improved script Abramov_V4, has notifications
Recommended for binary options
Strategy is on my site
Multicurrency
Timeframe from 1 minute
Volatility - not lower than average
This indicator includes:
1. Bollinger waves 3 levels - incl. / off.
2. Moving averages 2 pieces - incl. / off.
3. Price channel - incl. / off.
4. Support and resistance level per day - incl. / off.
5. Support and resistance level for 120 minutes - incl. / off.
6. Arrows RSI + Stochastic buy / sell
7. Arrows to buy / sell on the price level in the channel
8. Customizable notifications from the indicator, now you do not need to waste time searching for a good entry point, notification comes in advance.
9. The indicator does not redraw!
Any of the indicators is configurable.
The optimal settings are set by default.
This indicator is suitable for several strategies.
Paid subscription to the indicator
When working with this indicator, it is necessary to avoid news and sudden jumps in the market
For additional signal filtering, I recommend:
Abramov_RSI - additional indicator
Abramov Stochastic-RSI - additional indicator
----------------------------------------------
Улучшенный скрипт Abramov_V4, имеет оповещения
Рекомендовано для бинарных опционов
Стратегия у меня на сайте
Мультивалютный
Таймфрейм от 1 минуты
Волатильность - не ниже среднего
Этот индикатор включает в себя:
1. Волны Боллинджера 3 уровня - вкл. / выкл.
2. Скользящие средние 2 штуки - вкл. / выкл.
3. Канал цены - вкл. / выкл.
4. Уровень поддержки и сопротивления за день - вкл. / выкл.
5. Уровень поддержки и сопротивления за 120 минут - вкл. / выкл.
6. Стрелки RSI+стохастик купить/продать
7. Стрелки купить/продать по уровню цены в канале
8. Настраиваемые уведомления от индикатора, теперь не нужно тратить время на поиски хорошей точки входа, уведомление приходит заранее.
9. Индикатор не перерисовывает!
Любой из индикаторов настраивается.
Оптимальные настройки устанавливаются по умолчанию.
Этот индикатор подходит для нескольких стратегий.
Платная подписка на индикатор
При работе с этим индикатором необходимо избегать новостей и резких скачков на рынке
Для дополнительной фильтрации сигналов рекомендую:
Abramov_RSI -дополнительный индикатор
Abramov Stochastic-RSI -дополнительный индикатор
Abramov Stochastic-RSIImproved script of the usual stochastic-rsi
Added:
- 2 levels 0 and 100
- visualization of oversold and overbought levels
- arrows
The levels are configurable.
The indicator is very informative for visual and technical use
Paid subscription to the indicator
For additional signal filtering, I recommend:
Abramov_RSI - additional indicator
Abramov_V5 -basic indicator
----------------------------------------
Улучшенный скрипт обычного stochastic-rsi
Добавлены:
- 2 уровня 0 и 100
- визуализация уровней перепроданности и перекупленности
- стрелки
Уровни настраиваются.
Индикатор очень информативен для визуального и технического использования
Платная подписка на индикатор
Для дополнительной фильтрации сигналов рекомендую:
Abramov_RSI -дополнительный индикатор
Abramov_V5 -основной индикатор

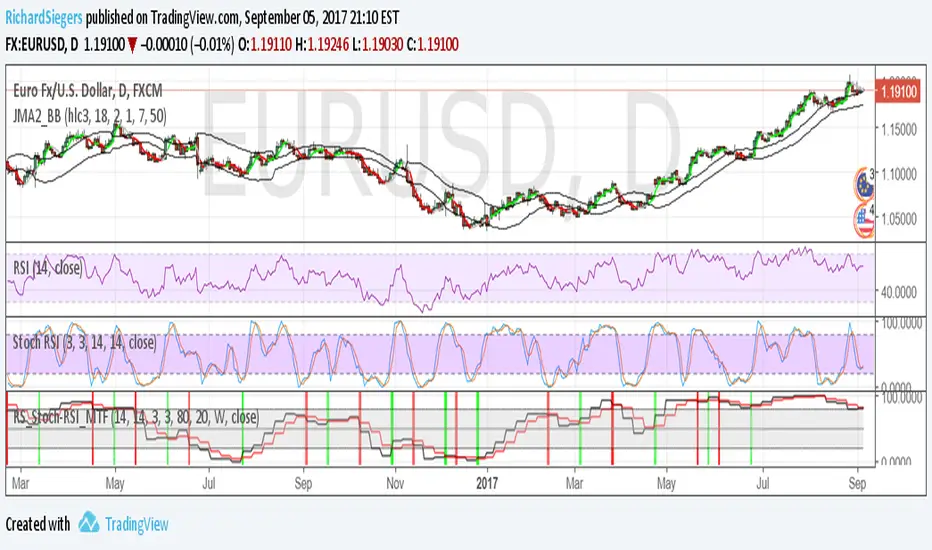
RS_Stoch-RSI_MTFmodification by Richard Siegers that turned stochastic mtf from ChrisMoody into stochastic-rsi mtf
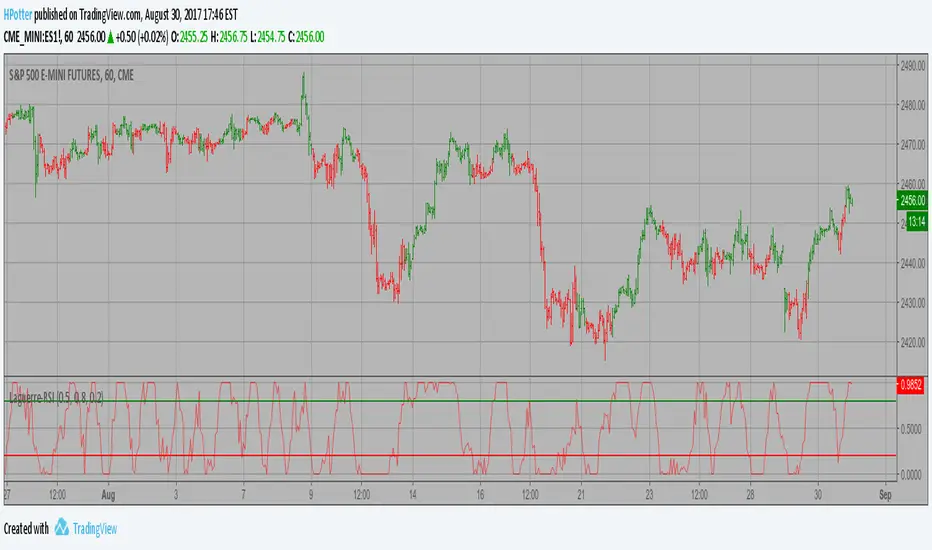
Laguerre-based RSI Backtest This is RSI indicator which is more sesitive to price changes.
It is based upon a modern math tool - Laguerre transform filter.
With help of Laguerre filter one becomes able to create superior
indicators using very short data lengths as well. The use of shorter
data lengths means you can make the indicators more responsive to
changes in the price.
You can change long to short in the Input Settings
WARNING:
- For purpose educate only
- This script to change bars colors.
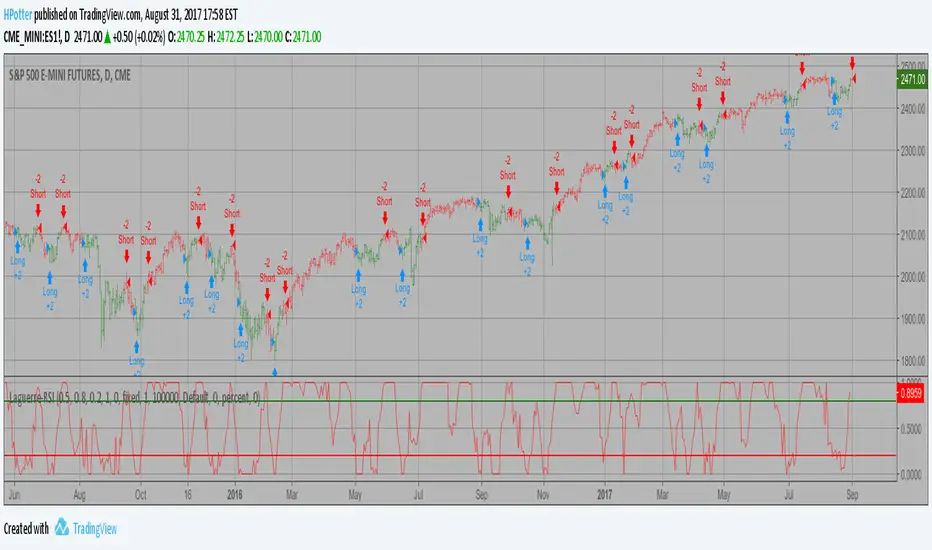
Laguerre-based RSI Strategy This is RSI indicator which is more sesitive to price changes.
It is based upon a modern math tool - Laguerre transform filter.
With help of Laguerre filter one becomes able to create superior
indicators using very short data lengths as well. The use of shorter
data lengths means you can make the indicators more responsive to
changes in the price.
WARNING:
This script to change bars colors.
MoD_v1.3_StochRSIMultRSI_StrategyMulti timeframe trend trading strategy using TRIMA, StochRSI and RSI

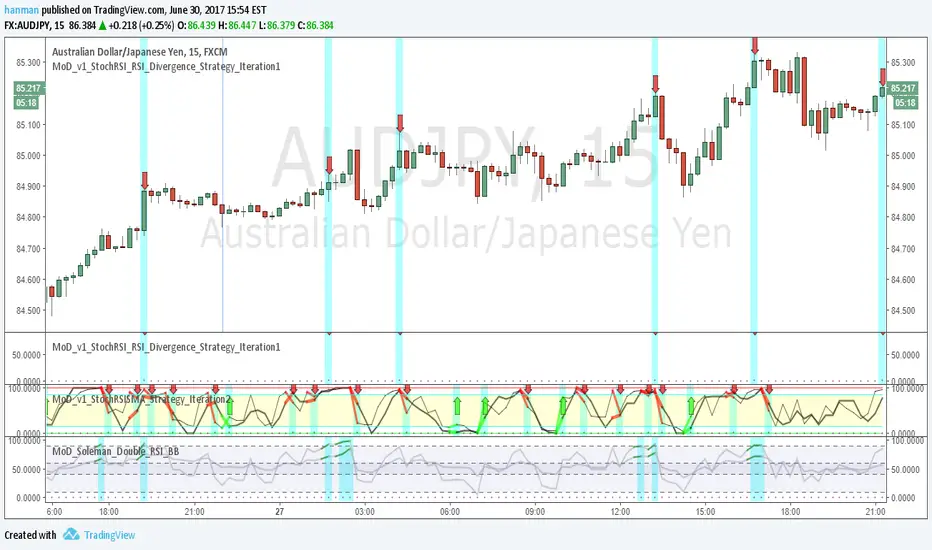
MoD_v1_StochRSISMA_Strategy_Iteration1combines StochRSI, RSI, SMA and BB to find best reversal entries. Also has options for finding Divergence (TBC in Version 2 :-) )
