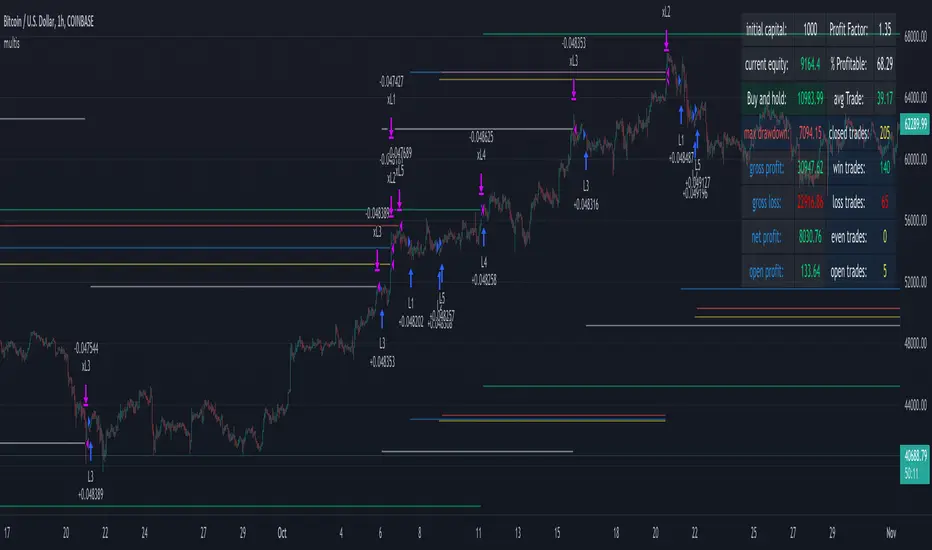
multiple orders - strategy - educationalHi,
Here is a 'template', using array's, for multiple orders and different SL/TP levels per trade (This is an example with max 5 open trades)
The 'switch' makes sure that the first available position will be used,
for example, when 'L1' is closed in the past, and a buy condition is triggered, position 'L1' will be filled,
should it be that 'L1', 'L2', 'L3' are already filled, then position 'L4' will be filled, ...
An extra table is added with data of the trades
Be aware, the 'Buy and Hold' resembles the profit when 100% of the available equity has been bought at the time of the very first trade and sold now. On the other hand, the positions work with a % of equity, 20% per trade (5 x 20 = 100%)
You can see that every trade exits on its own terms, without interference of other trades
Important, this technique only works if in the strategy() function:
- close_entries_rule -> set at 'ANY'
- pyramiding is set at max amount of trades or higher (in this case 5 or higher)
Cheers!
Strategy
Top 40 High Low Strategy for SPY, 5minThis strategy is developed based on my High Low Index SPY Top 40 indicator
Notes:
- this strategy is only developed for SPY on the 5 min chart . It seems to work with QQQ as well, but it isn't optimized for it
- P/L shown is based on 10 SPY option contracts, call or put, with strike price closest to the entry SPY price and expiry of 0 to 1 day. This includes commissions (can be changed). This is only an estimate calculated using an arbitrary multiplier factor, this can be changed in the setting
- P/L is based on $5000 initial capital
- Works with both regular / extended trading session turned on/off. However, max drawdown is 1/2 with extended trading session ON
- there is still a bug that doesn't allow alert to be created due to calculation error, will update once fixed
This strategy combines signals from the following indicators to determine entry signals:
- High Low Index SPY Top 40
- MACD
- Linear Regression Slope
Entry signal is triggered when:
- High Low Index line crosses the EMA line
- MACD trending in the same direction
- Linear Regression slope is accelerating above a threshold in the same direction, indicating a strong trend
Profit target(PT) and stop loss(SL) are determined using ATR value, with 2:1 Reward to Risk ratio as default.
Exit signal may be triggered prior to PT or SL trigger when:
- High Low Index SPY Top 40 shows a reversal after overbought or oversold conditions (optional)
- Opposite entry signal is triggered
There are a number of optional settings:
- Turn on/off "option trading", P/L will be calculated using share price only without multiplication factor for trading option contracts
- # of options per trade, default to 10
- Reinvest with profit made
- Trade with trailing SL after PT hit
- Take profit early based on Top 40 overbought/oversold
- Trade 0/1 day expiry. This will signal exit by the end of the day on Mon/Wed/Fri, and only exits 1/2 of positions (if in profit) on Tues/Thurs
- Can reduce the SL level without impacting PT
- No entry between 10:05 - 10:20 (don't ask me why, but statistically it performs better)
Consider donating me some of your profit if you make $$$ hahaha~ ;)
Enjoy~~

Triple ThreatThis indicator provides buy and sell signals for Bitcoin based on confluence from well-known momentum, volatility, and trend indicators. It has successfully captured the major directional trends on Bitcoin's daily chart since 2018, and the settings are currently optimized for this chart in particular. This indicator implements RSI to gauge momentum, BBWP to gauge volatility, and an EMA to gauge trend. Maximum confluence signals are represented by horizontal bars in the indicator's pane, where the tallest green bar is a confirmed buy signal, and the tallest red bar is a confirmed sell signal. The shortest bar represents a momentum-only signal, and the second-shortest bar represents a volatility signal in confluence with the previously given momentum signal.
To track momentum, the RSI is plotted to the indicator plane against a moving average of the RSI. A momentum signal is generated when the RSI crosses over its moving average, retests/approaches the moving average, and then continues in the crossover direction (i.e., it fails to cross the moving average to the opposite side, creating a successful retest). The settings that affect this trigger are the "Crossover Threshold," which specifies how much the RSI should exceed the moving average to be considered a crossover, and the "Retest threshold," which specifies how closely the RSI should approach the moving average to be considered a retest. A momentum signal is ALSO generated if the RSI or its moving average exceed their counterpart by a certain threshold. For example, if the threshold was set at 10, a BUY signal would be generated when the RSI exceeds the moving average by 10, or a SELL signal would be generated when the moving average exceeds the RSI by 10. This threshold can be set using the "Instant Signal Threshold" setting. Either type of momentum signal will be plotted on the pane as the shortest horizontal bar, with its color indicating the signal's direction.
Volatility is primarily measured using the Bollinger Band Width Percentile (BBWP) indicator, which was created by The_Caretaker. BBWP plots the volatility of the asset's price, given by Bollinger Band width, relative to past volatility by assigning the volatility readings into percentiles. The indicator also includes a moving average of the BBWP itself, where a crossover to the upside represents expanding volatility and a crossover to the downside represents contracting volatility. This indicator is used to confirm a signal given by the momentum indicators - a momentum signal that is given during a period of expanding volatility has a greater likelihood of success. Therefore, when the BBWP crosses above its moving average by a given threshold, a previously triggered momentum signal is considered to be "confirmed." The threshold for this crossover can be set using the "BBWP Confirmation Threshold" setting. However, it is also relevant that periods of extreme volatility often accompany an extremity in price action (a "top" or "bottom"), in which case the BBWP is likely to contract after price reaches such an extremity. This phenomenon is captured by also using "extreme reads" on the momentum indicator to signal that there has already been enough volatility to confirm a momentum signal. If the RSI gives an "extreme read" before triggering a signal, the momentum signal is also considered to be confirmed. For example, if the RSI is above 80, breaks below 80, and then gives a SELL signal, this sell signal is considered to be confirmed without requiring the BBWP to crossover its moving average to the upside. The threshold that would confirm a SELL signal can be set with the "Overbought" setting, and the threshold that would confirm a BUY signal can be set with the "Oversold" setting. Whenever a volatility signal confirms a momentum signal, a medium-sized horizontal bar will be plotted on the pane in the same directional color as the momentum signal. Note that a momentum signal may trigger at the exact same time as the volatility signal which confirms it; in this case, only the medium-sized bar will be visible on the pane, but its direction can still be identified by its color.
Lastly, to reduce the likelihood of "false signals," a trend indicator is used to confirm the direction of the signal. This is typically an exponential moving average. If a confirmed volatility SELL signal is given, and the closing price is below the moving average, then the SELL signal is also confirmed by the trend. Likewise, if a confirmed volatility BUY signal is given, and the closing price is above the moving average, then the BUY signal is confirmed by the trend. The type and length of the moving average used to verify the trend can be set using the "Moving Average Type" and "Moving Average Length" settings found below the momentum/volatility settings. A trend signal is plotted on the pane as a tall horizontal bar, and is more deeply colored than the momentum and volatility signals.
For maximum confluence, it is recommended that the trend signal, given by the tallest bar, is the one that forms the basis of trades executed while using the Triple Threat indicator. It is possible to enter more aggressive trades with better entries by using only the volatility signal, given by the medium-sized bar, however this entails greater risk and should only be done in confluence with an additional trading strategy of your own discretion. Backtesting has shown that using the volatility signal alone underperforms using the volatility signal in confluence with the trend signal.
Please also be advised that the default setting are optimized for Bitcoin's daily chart only. The indicator is still applicable to other timeframes and asset classes, but the settings may need to be modified. I have a list of settings for other Bitcoin timeframes, and I would be happy to share them upon request.
I hope you can find this indicator to be of some use to your trading strategies. I'd be happy to hear any feedback from the community, so please don't hesitate to reach out. Stay safe, and happy trading.

Loft Strategy V1This strategy consists of a kalman filter (by alexgrover ) and a "stop and reverse" line which is following the kalman filter.
If the price goes in the same direction as the position side, the "stop and reverse" line approaches the kalman filter as set on the "Approach Decrease Step" parameter.

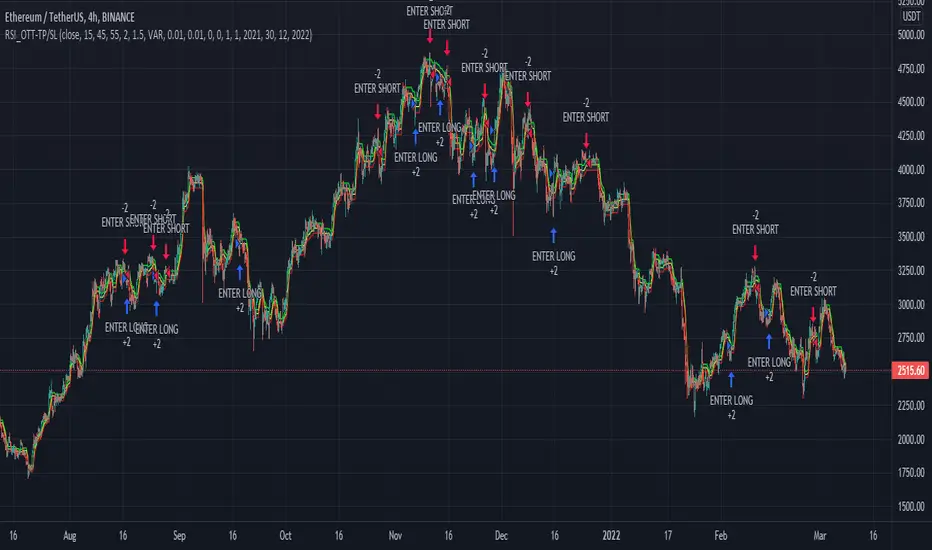
RSI_OTT - TP/SLWhile creating this strategy, I was inspired by "ott(by Anıl Özekşi)" and "RSI + Bollinger Double Strategy(by ChartArt)".
Basically, the strategy uses ott bands instead of bollinger bands in the "RSI+Bollinger Double Strategy".
User can select take profit, stop loss, position direction(long, short or both) and the other ott parameters via interface.
OTT-Stoch-TP/SLThis strategy combines stochastic oscillator and OTT (OTT is originally owned by Anıl Özekşi).
The strategy is triggered at fast OTT and slow OTT crossing points. User can select the "Evaluate Stoch OTT" option which is validate the crossing points through stochastic oscillator.
In the same way, user can select "take profit", "stop loss" and position direction(long, short or both) via interface.
By the way, Stoch OTT is not classic Stochastic oscillator. Actually, it is also combined classic stochastic oscillator and OTT for long term validation to base strategy.

RSI_Boll-TP/SLThis strategy is originally "Bollinger + RSI , Double Strategy (by ChartArt)"
I added just TP/SL exit point, position direction selection(long, short or both) and time window into that strategy.

EDMA Scalping Strategy (Exponentially Deviating Moving Average)This strategy uses crossover of Exponentially Deviating Moving Average (MZ EDMA ) along with Exponential Moving Average for trades entry/exits. Exponentially Deviating Moving Average (MZ EDMA ) is derived from Exponential Moving Average to predict better exit in top reversal case.
EDMA Philosophy
EDMA is calculated in following steps:
In first step, Exponentially expanding moving line is calculated with same code as of EMA but with different smoothness (1 instead of 2).
In 2nd step, Exponentially contracting moving line is calculated using 1st calculated line as source input and also using same code as of EMA but with different smoothness (1 instead of 2).
In 3rd step, Hull Moving Average with 2/3 of EDMA length is calculated using final line as source input. This final HMA will be equal to Exponentially Deviating Moving Average.
EDMA Defaults
Currently default EDMA and EMA length is set to 20 period which I've found better for higher timeframes but this can be adjusted according to user's timeframe. I would soon add Multi Timeframe option in script too. Chikou filter's period is set to 25.
Additional Features
EMA Band: EMA band is shown on chart to better visualize EMA cross with EDMA .
Dynamic Coloring: Chikou Filter library is used for derivation of dynamic coloring of EDMA and its band.
Trade Confirmation with Chikou Filter: Trend filteration from Chikou filter library is used as an option to enhance trades signals accuracy.
Strategy Default Test Settings
For backtesting purpose, following settings are used:
Initial capital=10000 USD
Default quantity value = 5 % of total capital
Commission value = 0.1 %
Pyramiding isn't included.
Backtesting data never assures that the same results would occur in future and also above settings use very less of total portfolio for trades, which in a way results less maximum drawdown along with less total profit on initial capital too. For example, increasing default quantity value will definity increase maximum drawdown value. The other way is also to use fix contracts in backtesting but it all depends on users general practice. Best option is to explore backtesting results with manually modified settings on different charts, before trusting them for other uses in future.
Usage and In-Detail Backtesting
This strategy has built-in option to enable trade confirmations with Chikou filter which will reduce the total number of trades increasing profit factor.
Symmetrically Weighted Moving Average (SWMA) on input source, may risk repainting in real-time data. Better option is to run a trade on bar close or simply left this optin unchecked.
I've set Chikou filter unchecked to increase number of trades (greater than 100) on higher timeframe (12H) and this can be changed according to your precision requirement and timeframe.
Timeframes lower than 4H usually have more noise. So its better to use higher EDMA and EMA length on lower timeframes which will decrease total number of offsetting trades increasing average total number of bars within a single trade.
Original "Exponentially Deviating Moving Average (MZ EDMA )" Indicator can be found here.

Trend Follower Strategy v2 [divonn1994]The Trend Follower Strategy that I made classifies red and green candles into tiny, small, and big sizes and will send buy or sell signals depending on if the candle is classified as "big" so you get into and out of a position when there is a big candle. Out during a big green candle to take profit. Out during a big red candle in case the market is turning down. It also won't enter a position unless there is positive EMA momentum.
For the chart there is a Buy and a Sell signal. Buy = 1, Sell = 0, and when the value crosses above or below 0.5 it will trigger a long position or close the long position. The graph isn't necessary to the strategy, but can help with visualizing the trade patterns in the past if you like.
This strategy works best so far with these coins at time of posting (March 4th, 2022):
KCSUSDT (621x profit), HTUSDT (45x profit), LUNAUSDT (45x profit), BNBBTC (1553x profit), ETHBTC (219x profit), KCSBTC (1222x profit), LUNABTC (83x profit), FTMBTC (52x profit).
It can work with other pairings, but I personally like these pairings best. I didn't test it with coins outside of the top 100 coins by market cap. Use it however you want.
Works best on 1 Day charts.
The strategy would rather be in the market than out. It gets out when it see's a red flag, but can immediately go back in in the next bar if the red flags are all gone. So it makes a lot of trades.
------------------------------------------------------------------------------------------------------------------------------------------------------------------------------------------------------------------------
Update: This is the same strategy I uploaded before but I made the code Open for anyone to check it out and so it has a similar description as the previous version. Let me know what you think. I'd remove the old version if I could, but I guess it's site policy to not be able to remove scripts that have been uploaded.

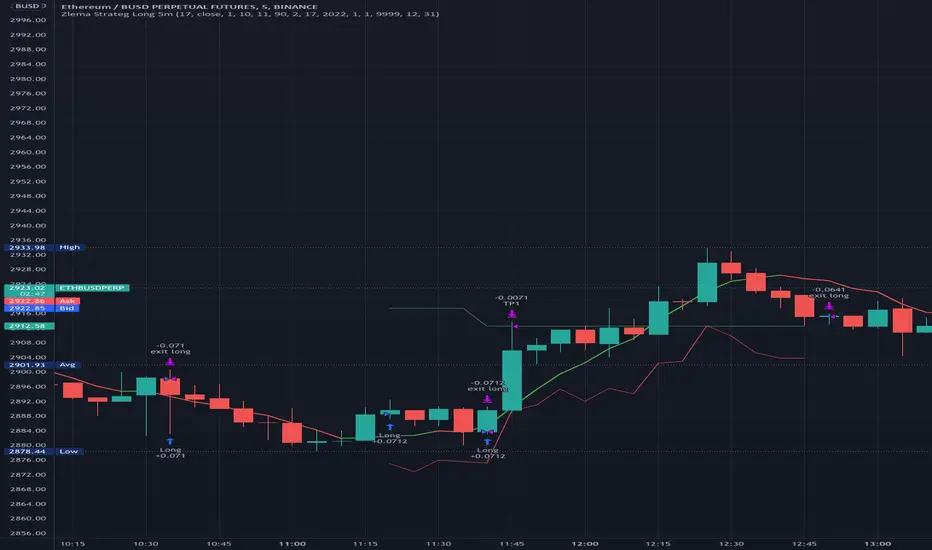
Zlema Strateg Long 5mJust putting this out there.
I created this Strategy based on Everget Zlema.
Opens long trade when Zlema changes color.
It is profitable as it is, but just putting it out to the community to see if someone else has ideas to make it better.
How to make this strategy better?
1. FInd a way to filter ranging bad trades.
2. Trades would be more profitable if entry point had an entry on the candle the zlema changes color.
3. I had to put TP 5 limit, but the optimal would be when the zlema changes color back to red (if ranging trades can we filtered that is).
In any case, just putting it out there, hope it is useful for someone, and I am open to suggestions.
Co-relation and St-deviation Strategy - BNB/USDT 15minThis indicator based on statistical analysis. it uses standard deviation and its co-relation to price action to generate signals. and following indicators has been used to calculate standard deviation and its co-relation values. finally it is capable to identify market changes in bottoms to pic most suitable points.
1. Parabolic SAR (parabolic stop and reverse)
2. Supertrend
3. Relative strength index (RSI)
4. Money flow index (MFI)
5. Balance of Power
6. Chande Momentum Oscillator
7. Center of Gravity (COG)
8. Directional Movement Index (DMI)
9. Stochastic
10. Symmetrically weighted moving average with fixed length
11. True strength index (TSI)
12. Williams %R
13. Accumulation/distribution index
14. Intraday Intensity Index
15. Negative Volume Index
16. Positive Volume Index
17. On Balance Volume
18. Price-Volume Trend
19. True range
20. Volume-weighted average price
21. Williams Accumulation/Distribution
22. Williams Variable Accumulation/Distribution
23. Simple Moving Average
24. Exponential Moving Average
25. CCI (commodity channel index)
26. Chop Zone
27. Ease of Movement
28. Detrended Price Oscillator
29. Advance Decline Line
30. Bull Bear Power

STR:EMA Oscilator [Azzrael]Strategy based on EMA and EMA Oscilator
(EMA - close) + Std Dev + Factor = detecting oversell/overbuy
Long only!
Pyramiding - sometimes, depends on ...
There're 2 enter strategies in one script:
1 - Classic, buy on entering to OverSell zone (more profitable ~> 70%)
2 - Crazy, buy on entering to OverBuy zone (catching trend and pyramiding, more net profit)
Exit - crossing zero of (EMA - close)

Volatility Breakout StrategyThis is a strategy used by Larry R. Williams called Volatility Breakout.
By identifying a strong uptrend that exceeds 'a certain level' on a daily basis as a breakout signal, enter long position, take advantage of long at the the next day's open.
'a certain level (Entry Price)' is calculated by { close + 'k' * high -low }, and applied logarithmic calculation.
Stop loss level is calculated by half of the previous day's Low and Entry Price.
Strategy exit always at UTC+0.
And expressed day session with the background color.
Thanks and hope this helps you.
(kor)
이건 Larry R. Williams가 사용하는 변동성 돌파 전략입니다.
특정 수준을 넘는 강한 상승세를 돌파 신호로 파악하여 매수하고, 장시간이 종료될때에 빠르게 수익을 실현하는 전략입니다.
"특정 레벨(진입가)"은 close + 'k' * high -low 로 계산되며 로그 계산을 적용했습니다.
손절 레벨은 전일 저가 및 진입 가격의 절반으로 계산됩니다.
전략은 항상 UTC+0에서 종료합니다. ( 한국 기준 오전 9시 )
그리고 배경색으로 일일세션을 표현했습니다.
트뷰에 오픈소스의 래리윌리엄스 변동성전략이 없는것 같아 간단하게나마 만들어 보았습니다. 도움이 되었으면 좋겟워요..

Buy Monday, Exit Tuesday with Stop Loss and Take ProfitStrategy to go long at end of Monday before market closes and exit before Tuesday close, or at stop loss or take profit percentages
This runs strategy on entering by weekday name and also by session time.
Implemented are also Take Profit and Stop Loss to exit position using custom inputs.
Added stoploss and take profit plot lines

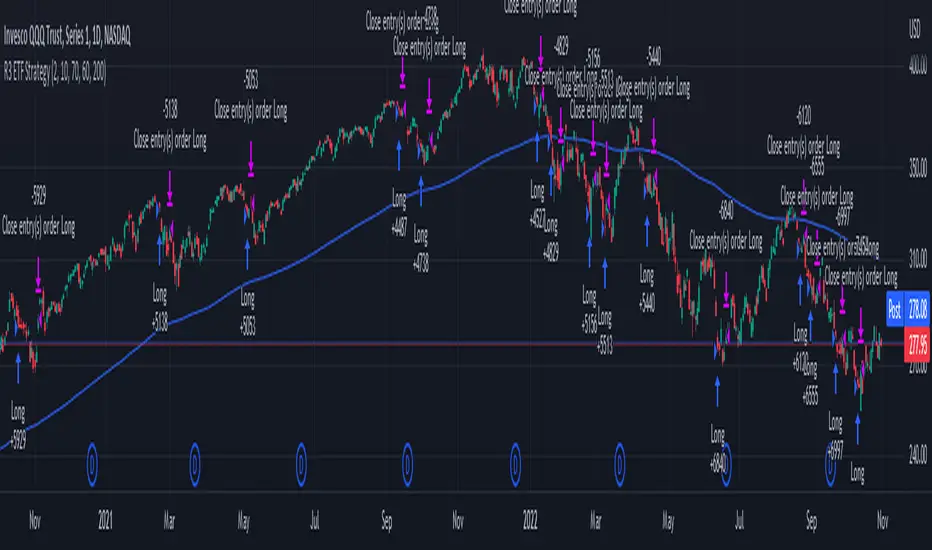
R3 ETF StrategyThis strategy is a modification of the “R3 Strategy” from the book "High Probability ETF Trading" by Larry Connors and Cesar Alvarez. This RSI strategy is for a 1-day time-frame and has these 3 simple rules:
Criteria:
The price must be above the 200 day moving average.
The 2-period (day) RSI drops 3 days in a row.
The 2-period RSI must have been below 60 3 days ago and below 10 today.
Entry and Exit:
If the 3 rules above are true, then buy on the close of the current day.
Exit on the day's close when the RSI crosses above 70.
How it works :
The Strategy will buy when the buy conditions above are true. The strategy will sell when the RSI crosses above 70. The RSI period/length, and RSI entry/exit criteria thresholds have all been coded to be adjustable with inputs.
Plots :
Blue line = 200 Day EMA (Used as Entry Criteria)
Disclaimer: Open-source scripts I publish in the community are largely meant to spark ideas that can be used as building blocks for part of a more robust trade management strategy. If you would like to implement a version of any script, I would recommend making significant additions/modifications to the strategy & risk management functions. If you don’t know how to program in Pine, then hire a Pine-coder. We can help!
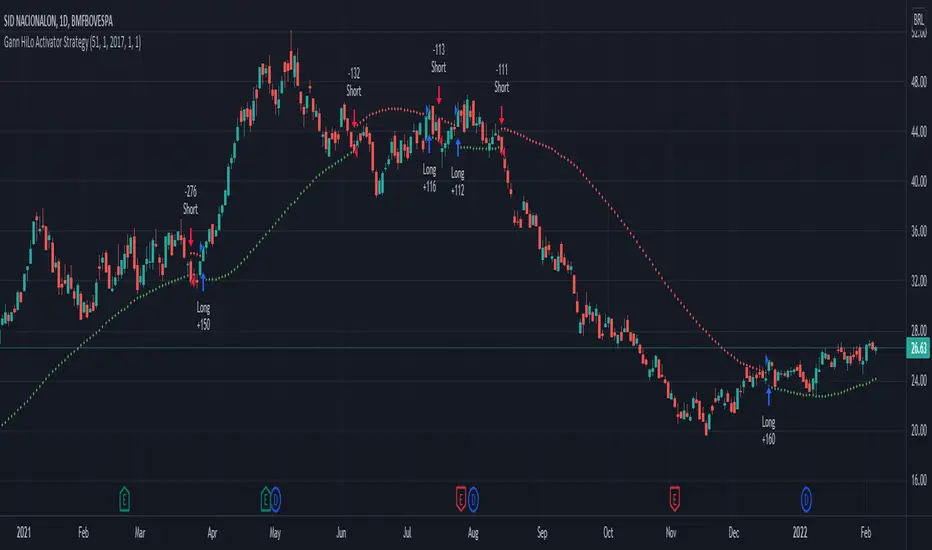
Gann HiLo Activator Strategy█ OVERVIEW
Strategy based on the Gann Hilo Activator . This is a trend following strategy, which means it will go long (and close the previous short position) once the price closes above the high SMA, and go short (and close the previous long position) once the price closes below the low SMA.
█ PARAMETERS
- Length
- Displace (or offset): default is 1
- Begin from start: strategy will run since the beggining
- From year, month, day: Choose an specific date to start backtesting (must disable the parameter above to work)
█ HOW TO USE
After choosing the start date to run the strategy, you can change the length field and look at the backtest results to find the most optimal settings for the current symbol.
This strategy was tested on the stock and crypto market with good results. Hope you enjoy!
Hourly Bias on BTC in Bullish USA Session “Green Eagle”Name: Hourly Bias on BTC in Bullish USA Session
Category: Hourly Bias
Operating mode: Spot, only long
Trades duration: Intraday, 11 bars
Timeframe: 1H
Suggested usage: When the market is compressed, USA session has a bullish bias.
Entry: enter Long at 15:00 on specific days of the week. There is a volatility filter based on ATR which identifies compression.
Exit: exit at a pre-defined time at 01:00
Usage:
⁃ It can be useful to use alerts or webhooks to automate this strategy.
⁃ This is a core system that can be improved in different ways (e.g. Stop-loss, take-profit, position sizing) or studying more the behaviour in the specific days of the week or short when is red.
Configuration:
- N/A
Backtesting
⁃ Exchange: BINANCE
⁃ Pair: BTCUSDT
⁃ Timeframe: 1H
⁃ Fee 0.075%
⁃ Slippage 2
- Start : 2019-01-06
We decided to release this free BTC strategy.
How you or we can improve? Source code is open so share your ideas!

NSDT HAMA Candles STRATThis is a STRATEGY based on our popular HAMA Candles Indicator.
It is an "Always On" strategy, meaning it will stay in a Long position until the Short criteria shows up, and then it will close the Long position and immediately enter a Short position.
Since this is a strategy, we added a few more components. The most notable one is the grid at the top right that shows the statistics of whatever the current settings are. The user can change the MA lengths and see the potential results update in real time.
Since this is Always On and uses Moving Averages, we added an ADX setting to help filter our trades in a ranging/choppy market.
The settings will need to be adjusted to find the best fit for your instrument, chart time, and risk management plan.

action zone - ATR stop reverse order strategy v0.1 by 9nckACTION ZONE-ATR MOD v0.1 DOCUMENTATION
Overview
This tradingview pine script strategy is mainly created to enrich my coding skill. It is a combination of “CDC-ACTIONZONE” and my personal studies of trading techniques in various sources e.g.book, course or blog. This strategy purposefully built to connect with my automatic trading bot. However, It will be very useful to aid your trading routine by diminishing mental distraction which possibly leads to bad trades.
How does it work?
This strategy will do a basic simple thing that most traders do by creating entry signals on both sides long/short and also set the stop loss. Furthermore, It will also reverse the order (from long to short and vice versa (if long/short conditions are met). Finally, it will recalculate the stop loss/take profit price in every complete bar to increase the chance of winning and limit our loss.
Entry rules(Long/Short)
If you have no open order, an order will be created when a fast EMA crosses(up(long)/down(short) the slow EMA(It’s as simple as that).
If you have an open order, the current order will be (sold if long, covered if short) and the opposite side order will be created.
Exit and Reverse rules(Long/Short)
If fast EMA cross (DOWN(long), UP(short)), the current order will be closed, THE OPPOSITE SIDE ORDER WILL ALSO BE CREATED.
Risk management
FLEX STOP PRICE : initial value will be set at the bar which order created. It is a fast ema (+/-) MIDDLE ATR value.
If MIDDLE ATR value rises, it will be our new stop price.
If MIDDLE ATR value falls, stop price unchanged
If Price OVERBOUGHT(long)/SOLD(short), LOW of that bar will be a new stop price.
Minimum position hold period
In order to eliminate risk of repeatedly open, close orders in sideway trends. Minimum hold period must be passed to start exit our position. However, It always respects stop loss prices. The value refers to the number of bars.
MUST READ!!!
This strategy uses only MARKET ORDER. If you trade with a bot, make sure you choose only enormous market cap tokens.
This strategy is bi-direction strategy. It will work best in the DERIVATIVE market.
It was initially designed to compete in the cryptocurrency market which has very high volume and volatility.
I only use this strategy in 1HR (acceptable change rate, optimum trade frequency)
How (should) we use it?
Choose crypto future pairs (recommend only top 10-15 market volume pairs in Binance, let’s say 1000M+ trade value)
Choose your time frame (1H is strongly recommended)
Setup your portfolio profile (Setting->Properties) such as Initial cap, order size, commission. DO NOT USE CAL ON EVERY TICK IT WILL CAUSE REPAINTING AND YOUR CAPITAL IS BLEEDING !!!
BACKTEST FIRST!! Back test is a combination of art, math and statis(and a bit of luck). You can apply to train and test methods or whatever you are familiar with. In my opinion, your test period should include UPTREND, SIDEWAY, DOWNTREND. Fine tune fast, slow ema first(my best ema length of 1H timeframe around 7-10, 17-22). Try to eliminate fault breakout trade and use other options only necessary. Hopefully we can use automatic optimization on Pine Script soon.
Don’t forget to turn off using a specific backtest date option to start your strategy.A
THIS IS NOT A PERFECT (OR EVEN PROFITABLE) STRATEGY. USE AT YOUR OWN RISK AND TRADE RESPONSIBLY. DYOR DUDE.

TEMA/HMA/VWMACD - Short Strategy 4HAs we can discover by studying the history of BTCUSD, the fall is always swift. Confirmation of this - today's collapse. In this strategy, an attempt is made to catch such drop by using quick entry and quick exit.
Let's describe what this strategy consists of:
• TEMA (you can find this strategy separately on this page or on platform)
• VWMACD
• HMA
• Take-profit and Stop-losses
Logic:
Firstly we VWMACD (the difference between VWMACD and simple MACD is only in the way of calculating moving average) and plot it as a histogram.
Then HMA is adding as a trend filter. For easy understanding let's plot it now on chart separately.
Next step is to create and add TEMA. After it is needed to subtract slow TEMA from fast TEMA and plot this value around 0 on histogram. This is the main decision for the implementation of the short trade.
ENTRY the trade:
When VMACD is below 0 and price (src = close) is below the HMA and TEMA below 0.
CLOSE the trade:
When VWMACD is upper than 0 or price is upper than HMA or TEMA is upper than 0
You can find more strategies on tradingammo.pro.

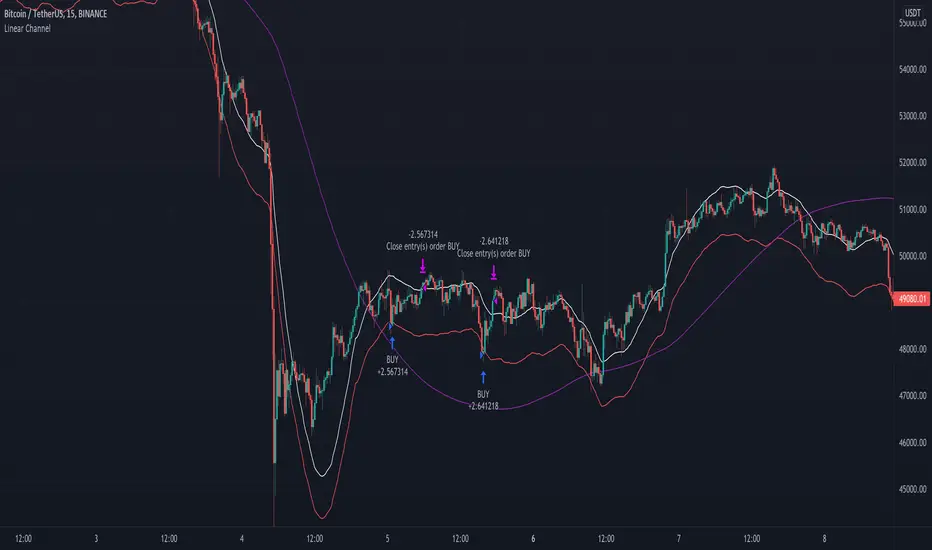
Linear Channel - Scalp Strategy 15MSimple way how to use Linear Regression for trading.
What we use:
• Linear Regression
• HMA as a trend filter
Logic:
Firstly we make simple linear regression moving. It is the white line which appears on the chart.
Then we make second line (named: band2) on the chart by multiplying linreg and value difference.
The third step is to ad HMA as a trend filter.
The trade open when price is below band2, but still upper than Hullma. The trade close when price again upper than linreg.
Automated Bitcoin (BTC) Investment Strategy from Wunderbit Automated Bitcoin (BTC) Investment Strategy from Wunderbit Trading
This strategy is designed for the automated long-term investment in Bitcoin. The BTC investment strategy is primarily suitable for long-term investors who want to increase the percentage of their investments through timely trading long-term transactions. The main feature is the difference from the indicator of long-term investment. Based on their statistics, this figure is 2 times less. That is, if we just bought Bitcoin and held it, we would receive 2 times less than if we applied the BTC Investment strategy.
This strategy uses the intersection of the triple exponential moving average and the least squares moving average. We also control the profit you will make during an uptrend by implementing a trailing stop based on the ATR indicator.
This is a spot market-only strategy and can be used primarily for long-term investors. The strategy is designed to create an automatic version of investing using a webhook.
Automation allows you to safely ignore the state of your portfolio and exclude emotions.
In order to create a cryptocurrency bot for this strategy, you need to:
1. Create alerts and link the URL to the webhook.
2. Connect the TradingView strategy with automated trading service.

200DMA last DOM - ajhImplements and backtests a simple 200 day moving average trend following rules based on last day of month to limits trades to 12 per year.
From the book : 5 BEST Moving Average Strategies (That beat buy and hold) by Steve Burns and Holly Burns
Click on the cog to set the input date range eg; 2000-01-01 to 2016-12-31
The book back tested SP500 returns from 2000-2016 317% using this method vs 125% buy and hold only with less drawdown.
Simple 200 day moving average test and trading on last day of month.
(you may find it trades on next available day close to end of month as not all dates can be traded weekends etc..)
Rules are ;
1. if last day of month and stock over 200 day moving average, then go long 100%
2. if last day of month and stock under 200 day moving average, then close long 100% and goto cash.
Aims to miss market declines and keep you long for upside.
Note: Have found doesn't work well in choppy markets moving sideways like the FTSE100 for same period 2000-2016 and causes losses. Also for many stocks.
