Absolute ZigZagThis ZigZag Indicator is a bit unique in it's kind.
It uses my own Absolute ZigZag Lib to calculate the pivots:
Instead of using percentages or looking more than 1 bar left or right, this Zigzag library calculates pivots by just looking at the current bar highs and lows and the ones of one bar earlier. This is a very fast and accurate way of calculating pivots.
The library also features a solution for bars that have both a higher high and a higher low like seen below.
You can also use your own colors for the labels and the lines:
You can also quickly select a one-colored theme without changing all colors at once:
Swingtrading

Relative Strength and MomentumRelative Strength and Momentum Indicator
Unlock deeper market insights with the Relative Strength and Momentum Indicator—a powerful tool designed to help traders and investors identify the strongest stocks and sectors based on relative performance. This custom indicator displays essential information on relative strength and momentum for up to 15 different symbols, compared against a benchmark index, all within a clear and organized table format.
Key Features:
1. Customizable Inputs: Choose up to 15 symbols to compare, along with a benchmark index, allowing you to tailor the indicator to your trading strategy. The 'Lookback Period' input defines how many weeks of data are analyzed for relative strength and momentum.
2. Relative Strength Calculation: For each selected symbol, the indicator calculates the Relative Strength (RS) against the chosen benchmark. This RS is further refined using an exponential moving average (EMA) to smooth the results, providing a more stable trend overview.
3. Momentum Analysis: Momentum is determined by analyzing the rate of change in relative strength. The indicator calculates a momentum rank for each symbol, based on its relative strength’s improvement or deterioration.
4. Percentile Ranking System: Each symbol is assigned a percentile rank (from 1 to 100) based on its relative strength compared to the others. Similarly, momentum rankings are also assigned from 1 to 100, offering a clear understanding of which assets are outperforming or underperforming.
5. Visual Indicators:
a. Green: Signals improving or stable relative strength and momentum.
b. Red: Indicates declining relative strength or momentum.
c. Aqua: Highlights symbols performing well on both relative strength and momentum—ideal candidates for further analysis.
6. Two Clear Tables:
a. Relative Strength Rank Table: Displays weekly rankings of relative strength for each symbol.
b. Momentum Table: Shows momentum trends, helping you identify which symbols are gaining or losing strength.
7. Color-Coded for Easy Analysis: The tables are color-coded to make analysis quick and straightforward. A green color means the symbol is performing well in terms of relative strength or momentum, while red indicates weaker performance. Aqua marks symbols that are excelling in both areas.
Use Case:
a. Sector Comparison: Identify which sectors or indexes are showing both relative strength and momentum to pick high-potential stocks. This allows you to align with broader market trends for improved trade entries.
b. Stock Selection: Quickly compare symbols within the same sector to find the stronger performers.

Adaptive Momentum Oscillator [BackQuant]Adaptive Momentum Oscillator
Please take time to read the following.
Conceptual Foundation and Innovation
The Adaptive Momentum Oscillator brings a new approach to momentum trading by introducing percentile-based adaptive thresholding. Unlike traditional momentum oscillators that rely on static overbought and oversold levels, this indicator adjusts dynamically to changing market conditions, providing more relevant signals in real-time. By combining percentile-based thresholds with a smoothed momentum oscillator, this tool allows traders to detect trend shifts with a higher degree of accuracy.
Technical Composition and Calculation
The core of this oscillator uses a lookback period to calculate the highest and lowest values of a smoothed price source (using a non-robust moving average). These values are then used to compute the oscillator, which normalizes the current price between the lookback high and low. The true innovation lies in its adaptive thresholds, which adjust based on percentiles of past oscillator values over a user-defined lookback period.
Lookback Period: The indicator checks the highest and lowest smoothed price over a set period, which becomes the basis for calculating momentum.
Percentile-Based Thresholds: The upper and lower thresholds are dynamically set at user-defined percentiles of historical momentum values, allowing the oscillator to adapt to the volatility and strength of the market.
Smoothing Length: Users can adjust the smoothing of the source input to fine-tune the sensitivity of the oscillator.
Features and User Inputs offer a host of customizable settings to suit different market conditions and trading strategies:
Adaptive Thresholding: Traders can set the lookback period and define the percentile levels for the upper (long) and lower (short) thresholds. This provides the ability to dynamically adjust to changing market conditions and avoid static thresholds that may become irrelevant over time.
Signal Line Customization: Users can configure the signal line width, colors for long, short, and neutral conditions, and choose whether to display adaptive threshold lines on the chart.
Candle Coloring: An optional feature allows traders to color the price bars based on the oscillator's trend signal, adding a visual confirmation layer for trend shifts.
Practical Applications
This oscillator is particularly effective in markets where the strength and direction of momentum are essential for identifying potential trend reversals or confirming ongoing trends. Traders can leverage the Adaptive Momentum Oscillator to:
Capture Adaptive Trends: The percentile-based thresholds adjust dynamically, ensuring that traders catch significant trends while filtering out market noise.
Avoid False Signals: By adapting to historical momentum levels, the oscillator reduces the risk of false breakouts or breakdowns, allowing for more reliable entries and exits.
Optimize Entries and Exits: With dynamically adjusting thresholds, the oscillator helps traders time their positions more effectively, minimizing the risk of getting caught in choppy or uncertain markets.
Advantages and Strategic Value
It offers a clear advantage over traditional static oscillators by continuously adjusting its sensitivity to market conditions. The adaptive percentile thresholds ensure that the indicator remains relevant, regardless of changes in volatility or market direction. This feature, combined with a customizable UI, makes the Adaptive Momentum Oscillator a powerful tool for traders looking to refine their momentum-based strategies with dynamic thresholds.
Summary and Usage Tips
The Adaptive Momentum Oscillator is a versatile tool for both trend-following and contrarian traders. Its dynamic nature allows for better alignment with current market conditions, while its user-friendly inputs offer extensive customization options. Traders are encouraged to experiment with the percentile-based threshold settings to find the optimal balance between signal sensitivity and noise reduction, particularly in fast-moving or volatile markets.
This indicator is best used in combination with other trend-confirmation tools, offering a dynamic layer to your trading system.
Thus following all of the key points here are some sample backtests on the 1D Chart
Disclaimer: Backtests are based off past results, and are not indicative of the future.
INDEX:BTCUSD
INDEX:ETHUSD
BINANCE:SOLUSD

MQLSoftware - Pro Swing Trading SystemThe PRO Swing Trading System for TradingView is an advanced, fully integrated trading solution designed for traders who demand precision, versatility, and convenience in their trading strategies. Part of our Premium Collection, this system combines robust algorithms with hyper-customizable features to help traders effectively capitalize on market swings across various asset classes.
Our system embodies a comprehensive approach to trading, emphasizing risk management and capital preservation while maximizing trading efficiency. By seamlessly integrating risk management tools directly within the trading terminal, the PRO Swing Trading System eliminates the need for external spreadsheets or complex calculations, ensuring that traders can focus solely on executing their strategies. Every aspect of this system is designed to provide a streamlined, user-friendly experience where entry points, stop-loss levels, and take-profit targets are automatically calculated and displayed, allowing for rapid decision-making and execution.
KEY FEATURES
Advanced Trend Channels and Swing Levels
The PRO Swing Trading System features a unique, color-coded trend channel that visually adapts based on market trends. This channel helps traders identify optimal entry points by highlighting key swing levels for potential reversals or trend continuations. The system marks these levels on the chart as potential entry points for long or short positions, providing a clear visual cue for trading opportunities.
Comprehensive Signal and Trade Levels
Clear Stop-Loss and Take-Profit Levels: The system automatically marks stop-loss and take-profit levels on your charts, including absolute values to support informed decision-making. Traders can adjust these levels directly on the chart to match their trading style and risk tolerance, ensuring that risk management is always at the forefront of their trading strategy.
Dynamic Signal Adjustments: Customize your signals based on trend strength and market volatility to ensure you receive alerts that align with your specific trading strategies. This flexibility allows for a tailored trading experience that can adapt to various market conditions.
This image showcases a chart of BTC/USD on a one-hour timeframe. Here, we highlight the system's functionality, illustrating how different colors represent ascending and descending trends. The image includes features such as the Descending Channel, Extending Channel, Main Swing Level, Echo Swing Level, and Potential Entry points.
Additionally, it displays levels for managing profits and losses, such as Take Profit Levels and Stop Loss Level. The system allows setting either one or two take-profit levels for staged exit strategies. Traders can enter positions based on the Main Swing Level (primary entry point) or Echo Swing Level (secondary entry point), depending on their trading style or market conditions. This flexibility is useful for phased entry or if the primary entry opportunity is missed.
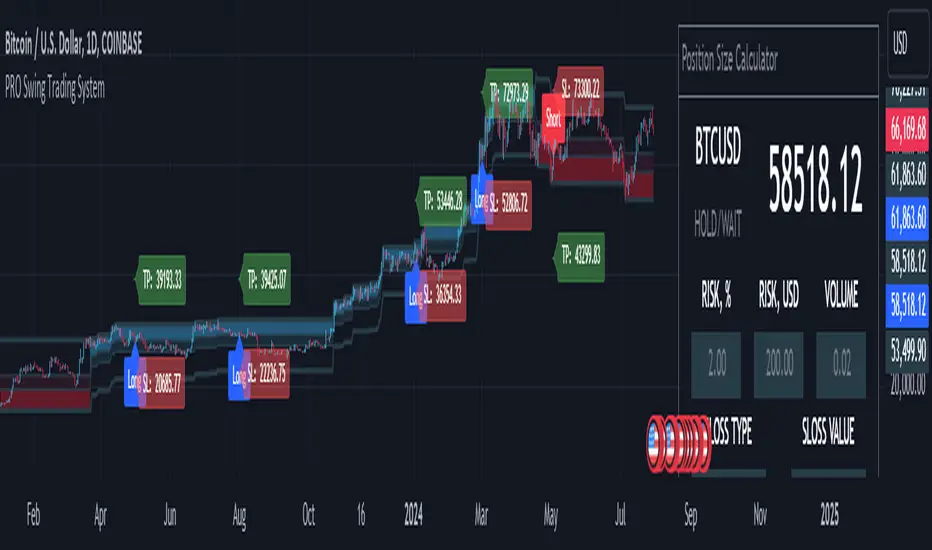
Integrated Position Size Calculator
Located in the top-right corner of the chart by default, the Position Size Calculator is a powerful tool that helps traders quickly determine the optimal trade size based on their risk settings. By integrating this calculator directly into the chart, traders can efficiently manage their trades with precision and confidence.
Configurable Risk Management: The calculator allows traders to set risk percentages, stop-loss types, and profit-to-loss ratios. It dynamically adjusts based on user inputs, optimizing trade volume and risk management to support a systematic trading approach.
This image presents a chart of ETH/USD on a 15-minute timeframe, clearly demonstrating the system’s ability to track trend changes accurately. The chart emphasizes the Position Size Calculator, part of the Risk Money Management Block. This panel allows users to set their risk (e.g., 2% of the deposit) and automatically calculates the appropriate position size. Absolute stop-loss and take-profit values are also calculated based on these settings, maintaining a consistent risk-reward ratio and supporting systematic trading.
Trend Strength Monitor
The Trend Strength Monitor is an essential tool for multi-timeframe analysis, helping traders identify the direction and strength of trends across higher timeframes. This feature aids in filtering out lower-probability trades, enhancing decision-making accuracy and ensuring that traders align their trades with the broader market trend.
This image features a chart of XAU/USD on an hourly timeframe, highlighting the Trend Strength Monitor. This tool helps traders understand the trend direction and strength across higher timeframes. The example shows that all higher timeframes indicate a buying zone, suggesting a safer long trade.
FILTERS AND SYSTEM USAGE
The indicator is equipped with a wide range of additional settings and filters that allow traders to adapt it to their specific needs and market conditions. Key features include:
Customizable Channel Width
The channel width is a crucial parameter that determines the indicator's adaptability to different market conditions. Traders can adjust the channel width to ensure the indicator responds quickly to market changes while remaining stable against false fluctuations. This flexibility is vital for trading in varying market conditions, such as ranging or trending markets.
Signal Frequency Control
This setting allows traders to control the frequency of signals generated by the system. By adjusting this parameter, traders can customize their trading approach to match their preferred style, whether it be a conservative, medium, or aggressive approach.
Alert and Notification Settings
The PRO Swing Trading System includes customizable alert settings to ensure traders are notified when key market conditions align with their strategy. Alerts can be set for specific entry points, trend reversals, or other significant market events, helping traders stay on top of their trades.
Trading Time Filters
Traders can set time filters to restrict trading activity to specific times of the day or week, ensuring their trading aligns with their schedule and market preferences. This feature is particularly useful for those who trade part-time or prefer to avoid trading during certain market sessions.
This image depicts a potentially risky LONG trade scenario after a prolonged downward movement on the AMD on an hourly timeframe. The recommendation is to avoid this trade, as the next three higher timeframes (H4, D1, W1) are in the red zone, indicating strong bearish trends.
CONCLUSION & ACCESS
The PRO Swing Trading System for TradingView is a powerful tool for traders who value precision, adaptability, and streamlined trading operations. With its advanced features, such as customizable trend channels, dynamic signal adjustments, and integrated risk management tools, this system supports a disciplined and systematic approach to trading. It's designed to enhance your trading experience by providing all the necessary tools to make informed decisions without the need for external resources.
To gain immediate access and start using the PRO Swing Trading System today, please refer to the Author's instructions below.
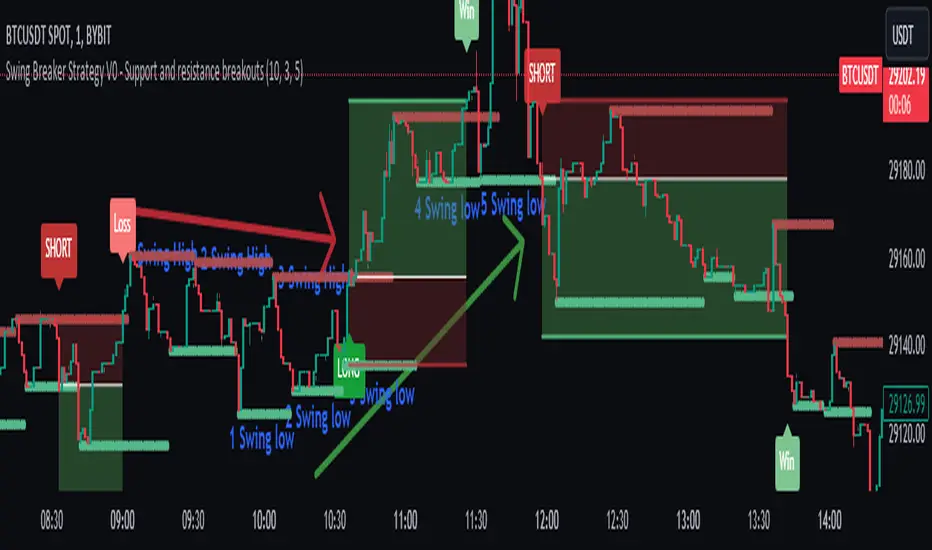
JL Swing Signal - {UT}Hello all, This signal is created based on Jesse Livermore's formula, I have tried to enhance it by including other elements to make the experience better and rewarding.
1. Swing Highs and Swing Lows:
>Identifies a swing high when the current high is higher than the highs of the specified number of bars to its left and right.
>Identifies a swing low when the current low is lower than the lows of the specified number of bars to its left and right.
>Also marks the confirmed swing highs (SH) and swing lows (SL) on the chart for visual reference.
2. Breakout Confirmation:
> Finds out when the closing price crosses above the last confirmed swing high.
> Ensures that the breakout is sustained for the defined number of confirmation bars to filter out false breakouts.
>BuySignal: A buy signal is generated only when both the breakout and hold conditions are met.
3. Trend Filter:
>EMA Calculation: A 50-period EMA is used to filter trades in the direction of the existing trend. Trades are only taken in the direction of the trend.
>Ensures buy signals are only triggered if the price is above the EMA, indicating an uptrend.
4. Volume Confirmation:
Volume Moving Average: A 20-period Simple Moving Average (SMA) of volume is calculated to compare current volume levels.
5. Profit Target:
ATR-Based Profit Target: A dynamic profit target is set based on a multiple of the ATR. This helps capture profits when the market moves in the trade's favor.
6. Exit Strategy:
Stop Loss and Profit Target: The script exits the trade if the price hits the stop loss or the profit target.
Interpretaion:
Buy Signals: Displayed with a green "BUY" label.
Stop Loss and Profit Target: Plotted as orange and green lines, respectively.
Exit Signals: Displayed with a red "EXIT" label when the exit conditions are met.

False Breakouts [TradingFinder] Fake Breakouts Failure🔵 Introduction
Technical indicators are essential tools for analysts and traders in financial markets, helping them predict price movements and make better trading decisions. One of the key concepts in technical analysis that should be carefully considered is the "False Breakout."
This phenomenon occurs when a price temporarily breaks through a significant support or resistance level but fails to hold and quickly returns to its previous range. Understanding this concept and applying it in trading can reduce risks and increase profitability.
🟣 What is a False Breakout?
A Fake Breakout, as the name suggests, refers to a breakout that appears to occur but fails to sustain, leading the price to quickly revert back to its previous range. This situation often happens when inexperienced or non-professional traders, under psychological pressure and eager to enter the market quickly, initiate trades.
This creates opportunities for professional traders to take advantage of these short-term fluctuations and execute successful trades.
🟣 The Importance of Recognizing False Breakouts
Recognizing False Breakouts is crucial for any trader aiming for success in financial markets. False Breakouts typically occur when the market approaches a critical support or resistance level.
In these situations, many traders are waiting to see if the price will break through this level. However, when the price quickly returns to its previous range, it indicates weakness in the movement and the inability to sustain the breakout.
🟣 How to identify False Breakouts?
To identify Fake Breakouts, it is important to carefully analyze price charts and look for signs of a quick price reversal after breaking a key level.
Here are some chart patterns that may help you identify a False Breakout :
1. Pin Bar Pattern : The Pin Bar is a candlestick pattern that indicates a price reversal. This pattern usually appears near support and resistance levels, showing that the price attempted to break through a key level but failed and reversed.
2. Fakey Pattern : This pattern, which consists of several candlesticks, indicates a False Breakout and a quick price return to the previous range. It usually appears near key levels and can signal a trend reversal.
3. Using Multiple Timeframes : One way to identify False Breakouts is by using charts of different timeframes. Sometimes, a breakout on a one-hour chart may be a False Breakout on a daily chart. Analyzing charts across multiple timeframes can help you accurately identify this phenomenon.
🔵 How to Use
Once you identify a False Breakout, you can use it as a trading signal. For this, it is best to look for trading opportunities in the opposite direction of the False Breakout. In other words, if a False Breakout occurs at a resistance level, you might consider selling opportunities, and if it happens at a support level, you might look for buying opportunities.
Here are some key points for trading based on False Breakouts :
1. Patience and Discipline : Patience and discipline are crucial when trading with False Breakouts. Wait for the False Breakout to clearly form before entering a trade.
2. Use Stop Loss : Setting an appropriate stop loss is vital when trading based on False Breakouts. Typically, the stop loss can be placed near the level where the False Breakout occurred.
3. Seek Confirmations : Before entering a trade, look for additional confirmations. These can include other analyses or technical indicators that show the price is likely to return to its previous level.
🔵 Settings
🟣 Logical settings
Swing period : You can set the swing detection period.
Max Swing Back Method : It is in two modes "All" and "Custom". If it is in "All" mode, it will check all swings, and if it is in "Custom" mode, it will check the swings to the extent you determine.
Max Swing Bac k: You can set the number of swings that will go back for checking.
🟣 Display settings
Displaying or not displaying swings and setting the color of labels and lines.
🟣 Alert Settings
Alert False Breakout : Enables alerts for Breakout.
Message Frequency : Determines the frequency of alerts. Options include 'All' (every function call), 'Once Per Bar' (first call within the bar), and 'Once Per Bar Close' (final script execution of the real-time bar). Default is 'Once per Bar'.
Show Alert Time by Time Zone : Configures the time zone for alert messages. Default is 'UTC'.
🔵Conclusion
False Breakouts, as a key concept in technical analysis, are powerful tools for identifying sudden price changes and using them in trading. Understanding this phenomenon and applying it can help traders perform better in financial markets and avoid potential losses.
To benefit from False Breakouts, traders need to carefully analyze charts and use the appropriate analytical tools. By leveraging this strategy, traders can achieve lower-risk and higher-reward trades.

Swing Trend AnalysisIntroducing the Swing Trend Analyzer: A Powerful Tool for Swing and Positional Trading
The Swing Trend Analyzer is a cutting-edge indicator designed to enhance your swing and positional trading by providing precise entry points based on volatility contraction patterns and other key technical signals. This versatile tool is packed with features that cater to traders of all timeframes, offering flexibility, clarity, and actionable insights.
Key Features:
1. Adaptive Moving Averages:
The Swing Trend Analyzer offers multiple moving averages tailored to the timeframe you are trading on. On the daily chart, you can select up to four different moving average lengths, while all other timeframes provide three moving averages. This flexibility allows you to fine-tune your analysis according to your trading strategy. Disabling a moving average is as simple as setting its value to zero, making it easy to customize the indicator to your needs.
2. Dynamic Moving Average Colors Based on Relative Strength:
This feature allows you to compare the performance of the current ticker against a major index or any symbol of your choice. The moving average will change color based on whether the ticker is outperforming or underperforming the selected index over the chosen period. For example, on a daily chart, if the 21-day moving average turns blue, it indicates that the ticker has outperformed the selected index over the last 21 days. This visual cue helps you quickly identify relative strength, a key factor in successful swing trading.
3. Visual Identification of Price Contractions:
The Swing Trend Analyzer changes the color of price bars to white (on a dark theme) or black (on a light theme) when a contraction in price is detected. Price contractions are highlighted when either of the following conditions is met: a) the current bar is an inside bar, or b) the price range of the current bar is less than the 14-period Average Daily Range (ADR). This feature makes it easier to spot price contractions across all timeframes, which is crucial for timing entries in swing trading.
4. Overhead Supply Detection with Automated Resistance Lines:
The indicator intelligently detects the presence of overhead supply and draws a single resistance line to avoid clutter on the chart. As price breaches the resistance line, the old line is automatically deleted, and a new resistance line is drawn at the appropriate level. This helps you focus on the most relevant resistance levels, reducing noise and improving decision-making.
5. Buyable Gap Up Marker: The indicator highlights bars in blue when a candle opens with a gap that remains unfilled. These bars are potential Buyable Gap Up (BGU) candidates, signaling opportunities for long-side entries.
6. Comprehensive Swing Trading Information Table:
The indicator includes a detailed table that provides essential data for swing trading:
a. Sector and Industry Information: Understand the sector and industry of the ticker to identify stocks within strong sectors.
b. Key Moving Averages Distances (10MA, 21MA, 50MA, 200MA): Quickly assess how far the current price is from key moving averages. The color coding indicates whether the price is near or far from these averages, offering vital visual cues.
c. Price Range Analysis: Compare the current bar's price range with the previous bar's range to spot contraction patterns.
d. ADR (20, 10, 5): Displays the Average Daily Range over the last 20, 10, and 5 periods, crucial for identifying contraction patterns. On the weekly chart, the ADR continues to provide daily chart information.
e. 52-Week High/Low Data: Shows how close the stock is to its 52-week high or low, with color coding to highlight proximity, aiding in the identification of potential breakout or breakdown candidates.
f. 3-Month Price Gain: See the price gain over the last three months, which helps identify stocks with recent momentum.
7. Pocket Pivot Detection with Visual Markers:
Pocket pivots are a powerful bullish signal, especially relevant for swing trading. Pocket pivots are crucial for swing trading and are effective across all timeframes. The indicator marks pocket pivots with circular markers below the price bar:
a. 10-Day Pocket Pivot: Identified when the volume exceeds the maximum selling volume of the last 10 days. These are marked with a blue circle.
b. 5-Day Pocket Pivot: Identified when the volume exceeds the maximum selling volume of the last 5 days. These are marked with a green circle.
The Swing Trend Analyzer is designed to provide traders with the tools they need to succeed in swing and positional trading. Whether you're looking for precise entry points, analyzing relative strength, or identifying key price contractions, this indicator has you covered. Experience the power of advanced technical analysis with the Swing Trend Analyzer and take your trading to the next level.

ZigZag ProHello Traders!
TRN ZigZag Pro is an indicator which identifies, and highlights pivot points (swings) and prints useful information about the swings in the chart (e.g. length, duration, ...). The indicator uses an extremely precise swing algorithm to detect the most important pivot points. Compared to other swing or zig-zag indicators TRN ZigZag Pro works in real-time, does not need a look-a-head to find swings and is not repainting. Moreover, equal (double) highs and lows are detected and displayed. The TRN ZigZag Pro helps traders to visualize pure price action and supports the trader to identify key turning points or trends.
The indicator comes with the following features:
Precise real-time swing detection without repainting
Equal/double high and low detection
Displaying of swing labels, values and information
Customizable settings as well as look and feel
It's important to note that the TRN ZigZag Pro is a visual tool and does not provide specific buy or sell signals. It serves as a guide for traders to analyze market structure in depth and make well-informed trading decisions based on their trading strategy and additional technical analysis.
Getting an edge with the TRN ZigZag Pro
The indicator clearly displays up trends, defined as a sequence of higher highs (HH) and higher lows (HL), with green labels and down trends, defined as a sequence of lower lows (LL) and lower highs (LH), with red labels. Equal highs/double tops (DT) and equal lows/ double bottoms (DB) are highlighted in gold.
In addition, the labels show a full stack of valuable information about the swings to maximize your accuracy.
Length
Length percentage in relation to the last swing length
Duration
Label (e.g. HH, LL...)
Use cases for swing detection
Trend Identification
By connecting the swing highs and lows, traders can identify and analyze the prevailing trend in the market. An uptrend is characterized by higher swing highs and lows, while a downtrend is characterized by lower highs and lower lows. The indicator helps traders visually to assess the strength and continuity of the trend.
Support And Resistance Levels
The swing highs and lows can act as support and resistance levels. Swing highs may act as resistance levels where selling pressure increases, while swing lows may act as support levels where buying pressure increases. Traders often pay attention to these levels as potential areas for trade entries, exits, or placing stop-loss orders.
Pattern Recognition
The swings identified by the indicator can help traders recognize chart patterns, such as equal high/lows, consolidations, wedges, triangles or more complex patterns like Gartley or Head and Shoulders. These patterns can provide insights into potential trend continuation or reversal.
Trade Entry and Exit
Traders may use TRN ZigZag Pro to determine potential trade entry and exit points. For example, in an uptrend, traders may look for opportunities to enter long positions near swing lows or on pullbacks to support levels. Conversely, in a downtrend, traders may consider short positions near swing highs or on retracements to resistance levels.
Conclusion
While signals from TRN ZigZag Pro can be informative, it is important to recognize that their reliability may vary. Various external factors can impact market prices, and it is essential to consider your risk tolerance and investment goals when executing trades.
Risk Disclaimer
The content, tools, scripts, articles, and educational resources offered by TRN Trading are intended solely for informational and educational purposes. Remember, past performance does not ensure future outcomes.

ZigZag Smart Trend [TradingFinder] Major & Minor Structured Wave🔵 Introduction
🟣 Zigzag
Zigzag is a lagging indicator; this indicator identifies points on a price chart that have more significant changes than its previous wave and then by connecting these lines to each other, it assists traders in trend detection.
This indicator reduces random price fluctuations and attempts to make the primary price trend clearer.
🟣 Pivot
Pivots are points where the price chart changes direction. Pivots, also called reversal points, form when supply and demand forces dominate one another.
Different types of technical analysis pivots can be introduced into two categories, minor pivots, and major pivots, each of which has a specific meaning in analysis.
Major Pivot : These pivots actually indicate major changes in the direction of the chart and occur at the end of trends. Analysts seeking to reach the primary analysis focus more on major pivot points. In fact, most technical analysis tools are examined and determined based on major pivots.
Minor Pivot : This type of pivot focuses more on small and subsidiary points and directions. Therefore, it occurs at the end of corrections. Analysts focusing on minor pivots represent small trends, and it should be noted that minor pivots are not suitable for use in primary technical tools.
How to identify minor and major pivots :
Minor pivots are pivots formed between two major pivots and fail to break the opposite major pivot.
Major pivots are pivots that have either successfully broken the opposite pivot or have moved more than the previous pivot of the same type.
🔵 How to use
Based on identifying pivots and drawing zigzag lines, you can have various uses for this indicator.
Identifying support and resistance levels :
Identifying Elliott Waves :
Identifying classic patterns :
Identifying pivots with higher validity :
Identifying internal and external breakouts :
Identifying trends and range areas :
Identifying pivot types along with major and minor recognition :
MHH : Major Higher High
MLH : Major Lower High
MLL : Major Lower Low
MHL : Major Higher Low
mHH : Minor Higher High
mLH : Minor Lower High
mLL : Minor Lower Low
mHL : Minor Higher Low
🔵 Settings
Pivot Period Zigzag Line : Using this input, you can determine the pivot period for identifying zigzag swings.
Show Zigzag Line : To show or not to show the zigzag line.
Zigzag Line Color : Change the color of the zigzag line.
Zigzag Line Style : Change the Style of the zigzag line.
Zigzag Line Width : Change the Width of the zigzag line.
Show Label : To show or not to show Pivot Type.
Color Label : Change the color of the Pivot Type Label.

Dual RSI Differential - Strategy [presentTrading]█ Introduction and How it is Different
The Dual RSI Differential Strategy introduces a nuanced approach to market analysis and trading decisions by utilizing two Relative Strength Index (RSI) indicators calculated over different time periods. Unlike traditional strategies that employ a single RSI and may signal premature or delayed entries, this method leverages the differential between a shorter and a longer RSI. This approach pinpoints more precise entry and exit points, providing a refined tool for traders to exploit market conditions effectively, particularly in overbought and oversold scenarios.
Most important: it is a good eductional code for swing trading.
For beginners, this Pine Script provides a complete function that includes crucial elements such as holding days and the option to configure take profit/stop loss settings:
- Hold Days: This feature ensures that trades are not exited too hastily, helping traders to ride out short-term market volatility. It's particularly valuable for swing trading where maintaining positions slightly longer can lead to capturing significant trends.
- TPSL Condition (None by default): This setting allows traders to focus solely on the strategy's robust entry and exit signals without being constrained by preset profit or loss limits. This flexibility is crucial for learning to adjust strategy settings based on personal risk tolerance and market observations.
BTCUSD 6h LS Performance
█ Strategy, How It Works: Detailed Explanation
🔶 RSI Calculation:
The RSI is a momentum oscillator that measures the speed and change of price movements. It is calculated using the formula:
RSI = 100 - (100 / (1 + RS))
Where RS (Relative Strength) = Average Gain of up periods / Average Loss of down periods.
🔶 Dual RSI Setup:
This strategy involves two RSI indicators:
RSI_Short (RSI_21): Calculated over a short period (21 days).
RSI_Long (RSI_42): Calculated over a longer period (42 days).
Differential Calculation:
The strategy focuses on the differential between these two RSIs:
RSI Differential = RSI_Long - RSI_Short
This differential helps to identify when the shorter-term sentiment diverges from longer-term trends, signaling potential trading opportunities.
BTCUSD Local picuture
🔶 Signal Triggers:
Entry Signal: A buy (long) signal is triggered when the RSI Differential exceeds -5, suggesting strengthening short-term momentum. Conversely, a sell (short) signal occurs when the RSI Differential falls below +5, indicating weakening short-term momentum.
Exit Signal: Trades are generally exited when the RSI Differential reverses past these thresholds, indicating a potential momentum shift.
█ Trade Direction
This strategy accommodates various trading preferences by allowing selections among long, short, or both directions, thus enabling traders to capitalize on diverse market movements and volatility.
█ Usage
The Dual RSI Differential Strategy is particularly suited for:
Traders who prefer a systematic approach to capture market trends.
Those who seek to minimize risks associated with rapid and unexpected market movements.
Traders who value strategies that can be finely tuned to different market conditions.
█ Default Settings
- Trading Direction: Both — allows capturing of upward and downward market movements.
- Short RSI Period: 21 days — balances sensitivity to market movements.
- Long RSI Period: 42 days — smoothens out longer-term fluctuations to provide a clearer market trend.
- RSI Difference Level: 5 — minimizes false signals by setting a moderate threshold for action.
Use Hold Days: True — introduces a temporal element to trading strategy, holding positions to potentially enhance outcomes.
- Hold Days: 5 — ensures that trades are not exited too hastily, helping to ride out short-term volatility.
- TPSL Condition: None — enables traders to focus solely on the strategy's entry and exit signals without preset profit or loss limits.
- Take Profit Percentage: 15% — aims for significant market moves to lock in profits.
- Stop Loss Percentage: 10% — safeguards against large losses, essential for long-term capital preservation.

SMT/Divergence Suite (any Indicator)Hello Traders!
The TRN SMT/Divergence Suite detects divergences for any given indicator, even custom ones and divergences any two given instruments (SMT – smart money technique/tool). The indicator finds with unrivaled precision bullish and bearish as well as regular and hidden divergences. The main difference compared to other SMT/divergences indicators is that this indicator finds rigorously the extreme peaks of each swing, both in price and in the corresponding indicator/instrument. This precision is unmatched and therefore this is one of the best SMT/divergences detectors. The indicator helps traders to identify potential changes in trend before they occur.
Feature List
Works with any given custom oscillators or indicator
SMT (Smart Money Technique)/Divergence detecting for any given instruments
11 different build-in oscillators (incl. Cumulative Delta)
Customizable look and feel
The TRN SMT/Divergence Suite works with any given indicator, even custom ones. In addition, there are 11 built-in indicators. We have chosen a selection of different momentum, trend following and volume oscillators that gives you maximum flexibility. Most noticeable is the cumulative delta indicator, which works astonishingly well as a divergence indicator.
Following is the full list of the build in indicators/oscillators:
Awesome Oscillator (AO)
Commodity Channel Index (CCI)
Cumulative Delta Volume (CDV)
Chaikin Money Flow (CMF)
Moving Average Convergence Divergence (MACD)
Money Flow Index (MFI)
Momentum
On Balance Volume (OBV)
Relative Strength Index (RSI)
Stochastic
Williams Percentage Range (W%R)
The divergences are colored with vivid lines and labels. Bullish divergences are distinguished with luminous blue lines, while bearish divergences are denoted by striking red lines. Upon detecting a divergence, the colored lines act as a visual indicator for traders, signaling an imminent possibility of a trend reversal. In response, traders can leverage this valuable insight to make informed decisions in their trading activities.
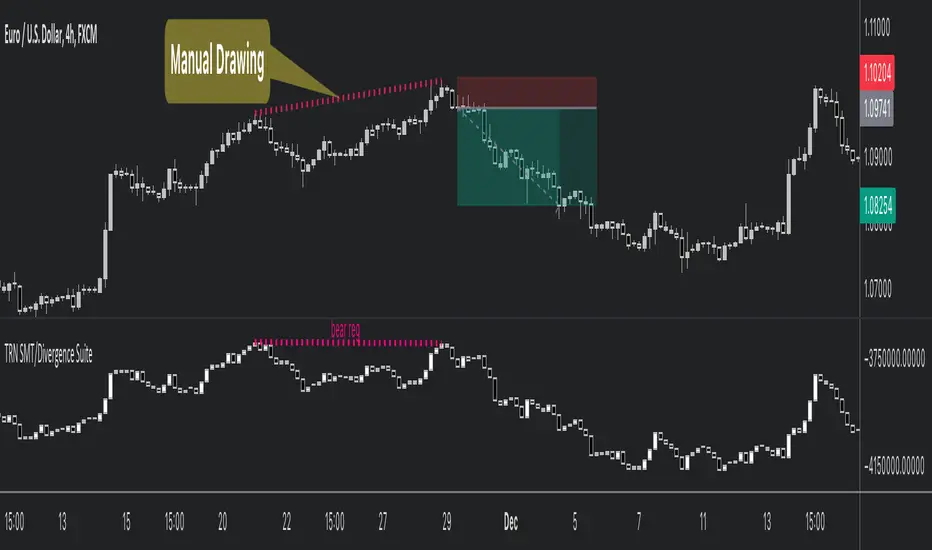
Choose Your Custom Divergence Indicator
Handpick your custom indicator, and the TRN SMT/Divergence Suite will hunt for divergences in your preferred market and timeframe. Importantly, you must add the indicator to your chart. Afterwards, simply go to the “Parameters” section in the indicator settings and choose "External Indicator/SMT". If the custom indicator has one reference value, then choose this value in the “External Indicator/SMT (High)” field. If there are high and low values (e.g. candles), then you also must set the “External Indicator Low/SMT” field.
In the provided graphic, we've chosen the stochastic RSI as our example, and as you can see, the TRN SMT/Divergence Suite instantly identifies and plots bullish and bearish divergences on your chart.
Make sure that the TRN SMT/Divergence Suite is in the same panel as the custom divergence indicator and that both indicators are pinned to the same scale of your chart.
Smart Money Technique (SMT)/Divergence detecting in Relation to other Instruments
Smart Money Technique/Tool (SMT) means the divergence detection between two related instruments. The TRN SMT/Divergence Suite finds divergences in relation to other instruments, e.g. NQ vs. ES or BTCUSDT vs. ETHUSDT. Just add another instrument to the chart. As representation style you can choose lines or candles/bars. Afterwards, simply go to the “Parameters” section in the indicator settings and choose "External Indicator/SMT". If the second instrument is represented as line, then choose this value in the “External Indicator/SMT (High)” field. If there are high and low values (e.g. candles/bars), then you also must set the “External Indicator/SMT Low” field.
The detection of SMTs can help traders to decide whether the trend continues, or a reversal is imminent. E.g. if the NQ makes a new higher high but the ES fails to do so and makes a new lower high, then the TRN SMT/Divergence Suite shows a divergence. As a result, the probability is high that the trend will not continue, and the trader can make an informed decision about what to do next.
How to set Parameters for Divergence Indicators
To begin, access the indicator settings. Look for the "Parameters" section where you can fine-tune Parameters 1-3. The default settings are already optimized for the oscillators AO, RSI, CDV, W%R, MFI and Stochastic. For other divergence indicators, you might want to adjust the settings to your liking. The parameter order is the same as in the corresponding divergence indicator.
What are Divergences?
When the price of an asset moves in one direction, but its indicators move in the opposite direction, this is called a divergence. Divergences can be a powerful signal that a trend reversal is about to occur.
There are two types of regular divergences: bullish and bearish. A bullish divergence occurs when the price of an asset makes a lower low, but its indicators make a higher low. This can be a sign that the asset is oversold and that a reversal is imminent. A bearish divergence, on the other hand, occurs when the price of an asset makes a higher high, but its indicators (such as Relative Strength Index - RSI) make a lower high. This can be a sign that the asset is overbought and that a reversal is imminent.
Next to regular divergences there are hidden divergences. These divergences occur when the price of an asset moves in the opposite direction of an indicator, suggesting a possible shift in the underlying trend. In trading, hidden bearish and hidden bullish divergences are patterns that traders often look for on price charts to identify potential trend reversals or continuation patterns.
Conclusion
While signals from TRN SMT/Divergence Suite can be informative, it is important to recognize that their reliability may vary. Bearish and bullish divergences are not foolproof indicators and should be used in conjunction with other analysis techniques and risk management strategies.
Risk Disclaimer
The content, tools, scripts, articles, and educational resources offered by TRN Trading are intended solely for informational and educational purposes. Remember, past performance does not ensure future outcomes.
Trend and Reversal ScannerHello Traders!
The TRN Trend and Reversal Scanner highlights in a user-friendly and easy to read table trend and reversal signals from up to 20 assets of your choosing. With it, you can efficiently monitor your preferred instruments simultaneously without jumping from one chart to the next. You will never miss a signal again. The indicator automatically finds swing-based up and down trends, bullish and bearish divergences, detects ranges and range breakouts as well as trend and reversal signals by the built-in trend detection algorithm called TRN Bars. Furthermore, you can conveniently stay updated with real-time alerts, notifying you whenever the scanner finds interesting market situations.
Feature List
Swing-based up and down trend detection
Divergence detection for any given (Custom) Indicator
Price range and breakout detection
Bar trend and reversal detection
Scanner alerts
The value of this indicator is to support traders to easily identify trend-based signals in an automated way and across many different markets at the same time. The trader saves a lot of time scanning the markets for up and down swings, divergences, consolidations and bar pattern-based trends and reversals, since finding and alerting these signals is done automatically for the trader.
For a visualization of the detected signals, you can add the TRN Bars and the Swing Suite indicator to your chart.
How does Trend Scanner work?
On the right side of the chart, you can find a table displaying the symbols monitored by the TRN Trend and Reversal Scanner for signal detection (first column). The table provides information on the status of each symbol. This visual representation allows you to quickly identify evolving signals across different symbols, helping you stay informed and make timely trading decisions.
The scanner operates specifically on the timeframe you are currently viewing, ensuring that the detected signals align precisely with your trading perspective.
In the following, we will describe the different signals displayed in the different columns of the table
Column 1 – Symbols
Column 2 – Bar Trend & Signals
Column 3 – Up & Down Swing Trend
Column 4 – Ranges & Range Breakouts
Column 5 – Bullish Divergences
Column 6 – Bearish Divergences
Bar Trend & Signals
In the second column, you can observe the status of TRN Bars, the built-in trend detection algorithm.
UP – Uptrend
DN – Downtrend
REV (Green) – Bullish Reversal Bar
REV (Red) – Bearish Reversal Bar
CON (Green) – Bullish Continuation Bar
CON (Red) – Bearish Continuation Bar
B/O (Green) – Bullish Range Breakout Bar
B/O (Red) – Bearish Range Breakout Bar
TRN Bars is designed to spot bullish and bearish trends and reversals. The trend analysis is based on a new algorithm that weights several different inputs:
classical and advanced bar patterns and their statistical frequency
probability distributions of price expansions after certain bar patterns
bar information such as wick length in %, overlapping of the previous bar in % and many more
historical trend and consolidation analysis
It provides high-probability trend continuation analysis and reversal detections.
Up and Downtrend
The second column (Trend) indicates whether the price of the asset moves within an uptrend (UP) or a downtrend (DN), as detected by our unique swing detection algorithm, on the selected timeframe.
The swing detection algorithm identifies pivot points (swings) with high accuracy. It works in real-time and does not need a look-a-head to find swings.
Ranges & Range Breakouts
The third column provides insights into the price behavior of a symbol within the selected timeframe, as analyzed by the range feature of the TRN Bars algorithm.
ACTIVE – Price moves within a price range
UP – Breakout detected
DN – Breakdown detected
UP CONF – Breakout confirmed
DN CONF – Breakdown confirmed
The bar range feature automatically finds consolidations where the price range of several consecutives bars is rather small. The detection of the bar ranges includes among other things the overlapping percentage of these bars.
Divergence Detection for any given (Custom) Indicator
The divergence detector finds with unrivaled precision bullish and bearish as well as regular and hidden divergences. The main difference compared to other divergences indicators is that this indicator finds rigorously the extreme peaks of each swing, both in price and in the corresponding indicator. This precision is unmatched and therefore this is one of the best divergences detectors.
The build in divergence detector works with any given indicator, even custom ones. In addition, there are 11 built-in indicators. Most noticeable is the cumulative delta indicator, which works astonishingly well as a divergence indicator. Full list:
External Indicator (see next section for the setup)
Awesome Oscillator (AO)
Commodity Channel Index (CCI)
Cumulative Delta Volume (CDV)
Chaikin Money Flow (CMF)
Moving Average Convergence Divergence (MACD)
Money Flow Index (MFI)
Momentum
On Balance Volume (OBV)
Relative Strength Index (RSI)
Stochastic
Williams Percentage Range (W%R)
Another highlight of the divergence detection is that it works with every indicator, even custom ones. To do this, you must add the (custom) indicator to your chart. Afterwards, simply go to the “Divergence Detection” section in the indicator settings and choose "External Indicator". If the custom indicator has one reference value, then choose this value in the “External Indicator (High)” field. If there are high and low values (e.g. candles), then you also must set the “External Indicator Low” field.
The visualization of the divergence detection is represented in the fifth column (Div Bull) and the sixth and last column (Div Bear).
REG – Regular divergence detected
HID – Hidden divergence detected
Scanner Alerts
You can opt to receive alerts for the following scenarios:
Detected up and down swings
Detected bullish and bearish divergences
Detected bar trend changes
Confirmed Reversal Bars
Confirmed Continuation Bars
Confirmed ange breakouts
The alert function is activated for all symbols listed in the scanner and corresponds to the timeframe of the chart you are currently viewing. This ensures that you receive alerts specifically tailored to the symbols and timeframe you are interested in.
Risk Disclaimer
The content, tools, scripts, articles, and educational resources offered by TRN Trading are intended solely for informational and educational purposes. Remember, past performance does not ensure future outcomes.

Swing Suite (SMT/Divergences + Gann Swings)Hello Traders!
TRN Swing Suite (SMT/Divergences + Gann Swings) is an indicator which identifies, and highlights pivot points (swings) and prints a lot of information about the swings in the chart (e.g. length, duration, cumulative Delta, ...). Furthermore, it detects divergences in connection with any given indicator, even custom ones. In addition to this, you can choose the algorithm to compute the swings. The famous Gann-Swing algorithm and the extremely precise TRN Swing algorithm (called Standard) are available for selection, as well as two other variants. Compared to other swing or zig-zag indicators it works in real-time, does not need a look-a-head to find swings and is not repainting. Moreover, equal (double) highs and lows are detected and displayed. The TRN Swing Suite helps traders to visualize the pure price action and identify key turning points or trends. The indicator comes with the following features:
Precise real-time swing detection without repainting
Divergence detecting for any given (custom) indicator - with 11 different preset indicators
SMT (Smart Money Technique)/Divergence detecting in relation to other instruments
Swing Performance Statistics
Swing support and resistance levels
Swing trend for multiple swing sizes
Equal/double high and low detection
4 different swing computation styles
Displaying of swing labels, values and information
Customizable settings as well as look and feel
It's important to note that the TRN Swing Suite is a visual tool and does not provide specific buy or sell signals. It serves as a guide for traders to analyze market structure in depth and make well-informed trading decisions based on their trading strategy and additional technical analysis.
Divergence Detection for any given (Custom) Indicator
The divergence detector finds with unrivaled precision bullish and bearish as well as regular and hidden divergences. The main difference compared to other divergences indicators is that this indicator finds rigorously the extreme peaks of each swing, both in price and in the corresponding indicator. This precision is unmatched and therefore this is one of the best divergences detectors.
The build in divergence detector works with any given indicator, even custom ones. In addition, there are 11 built-in indicators. Most noticeable is the cumulative delta indicator, which works astonishingly well as a divergence indicator. Full list:
External Indicator (see next section for the setup)
Awesome Oscillator (AO)
Commodity Channel Index (CCI)
Cumulative Delta Volume (CDV)
Chaikin Money Flow (CMF)
Moving Average Convergence Divergence (MACD)
Money Flow Index (MFI)
Momentum
On Balance Volume (OBV)
Relative Strength Index (RSI)
Stochastic
Williams Percentage Range (W%R)
The divergences are colored with vivid lines and labels. Bullish divergences are distinguished with luminous blue lines, while bearish divergences are denoted by striking red lines. Upon detecting a divergence, the colored lines act as a visual indicator for traders, signaling an imminent possibility of a trend reversal. In response, traders can leverage this valuable insight to make informed decisions in their trading activities.
Choose Your Custom Divergence Indicator
Handpick your custom indicator, and the TRN Swing Suite will hunt for divergences on your preferred market and timeframe. Importantly, you must add the indicator to your chart. Afterwards, simply go to the “Divergence Detection” section in the TRN Swing Suite indicator settings and choose "External Indicator". If the custom indicator has one reference value, then choose this value in the “External Indicator (High)” field. If there are high and low values (e.g. candles), then you also must set the “External Indicator Low” field.
In the provided graphic, we've chosen the stochastic RSI as our example, and as you can see, the TRN Swing Suite instantly identifies and plots bullish and bearish divergences on your chart.
Smart Money Technique (SMT)/Divergence detecting in Relation to other Instruments
Smart Money Technique/Tool (SMT) means the divergence detection between two related instruments. The TRN Swing Suite finds divergence in relation to other instruments, e.g. NQ vs ES or BTCUSDT vs ETHUSDT. Just add another instrument to the chart. As representation style you can choose lines or candles/bars. Afterwards, simply go to the “Divergence Detection” section in the TRN Swing Suite indicator settings and choose "External Indicator". If the second instrument is represented as line, then choose this value in the “External Indicator (High)” field. If there are high and low values (e.g. candles/bars), then you also must set the “External Indicator Low” field.
The detection of SMTs can help traders to decide whether the trend continues, or a reversal is imminent. E.g. if the NQ makes a new higher high but the ES fails to do so and makes a new lower high, then the TRN Swing Suite shows a divergence. As a result, the probability is high that the trend will not continue, and the trader can make an informed decision about what to do next.
How to Set Parameters for Divergence Indicators
To begin, access the indicator settings and find the “Divergence Detection”. Look for the "Parameters" sections where you can fine-tune Parameters 1-3. The default settings are already optimized for the oscillators AO, RSI, CDV, W%R, MFI and Stochastic. For other divergence indicators, you might want to adjust the settings to your liking. The parameter order is the same as in the corresponding divergence indicator.
TRN Swing Suite Statistics
Unveil the untapped potential of advanced Swing Statistics! Gain invaluable insights into historical swings and turning points. Elevate your expertise by harnessing this treasure trove of data to supercharge signal reliability, while masterfully planning stop loss and take profit strategies with unrivaled accuracy. Within the TRN Swing Suite lie two powerful statistics, each offering distinct insights to empower your trading prowess.
Swing Statistic
The Swing Statistic comprises of two series, one for up swings (Up) and one for down swings (Down), with values given in points. The columns have the following meaning:
Up or down
# - total number of analyzed swings
Overall ∅ Length - average length of all swings in points
Overall ∅ Duration - average duration of swings in bars
∅ Length - average lengths for custom-defined swing counts
∅ Duration - average durations for custom-defined swing counts
The custom-defined swing count is used to determine the swing length/duration for the last x swings. Note, in the case of well-established assets like Microsoft or Nvidia, which have undergone one or more stock splits, the overall average in column three may deviate significantly from those in column five. That is why column 5 is useful.
Relation Statistic
The Relation Statistic highlights percentages representing the historical occurrence of specific high and low sequences. In the first column (in %), various types of highs and lows are listed as reference points.
For example, the first row corresponds to "HH followed by", where the second column (#) displays the total count of higher highs (HH) considered. The subsequent columns showcase the percentages of how often certain patterns follow the initial HH.
Fields marked in blue represent sequences that occurred in over 50% of cases. The darker the shade of blue in each field, the higher the percentage.
Use Swing Statistics to Validate Stop-Loss and Take-Profit Levels
No matter which signals you choose to trade, consulting Swing Statistics can significantly enhance the reliability of these signals.
For example, when looking for a long entry after a lower low (LL), you can examine the likelihood of a subsequent lower high (LH) or even a higher high (HH). Combining this valuable information with your predetermined Take Profit level allows you to better assess whether your target can be achieved successfully. Additionally, you can add the average up swing length to the lower low for an alternative Take Profit level. Similarly, you can verify the probability of the next low being a higher low (HL) or another lower low (LL) to determine the likelihood of your Stop Loss being triggered. Align the length of the last down swing with the average down swing length for an alternative Stop Loss.
Swing Support and Resistance Levels
Swing support and resistance levels are horizontal lines starting from a swing high or swing low and representing natural support and resistance levels. Price tends to respect this levels one way or another. In most cases, old swing highs and swing lows provide a lot of liquidity to the market. For example, for a swing high there are at least three different market players at work:
Traders put there stop loss above the swing high
Breakout traders go long above the swing high
Turtle soup (reverse) trader go short above the swing high
Swing Trend (Multiple Sizes)
The TRN Swing Suite can display either at the top or at the bottom the prevailing swing trends for the main trend seen in the chart and for two additional swing sizes. This is useful to see the swing trend for medium and bigger swings to get a clear picture of the market.
Getting an Edge with the TRN Swing Suite
The indicator clearly displays up trends, defined as a sequence of higher highs (HH) and higher lows (HL), with green labels and down trends, defined as a sequence of lower lows (LL) and lower highs (LH), with red labels. Equal highs/double tops (DT) and equal lows/ double bottoms (DB) are highlighted in gold.
In addition, the labels show a full stack of valuable information about the swings to maximize your accuracy.
Length
Length percentage in relation to the last swing length
Duration
Time
Volume
Cumulative Delta
In an uptrend the up swings should have higher volume und higher cumulative delta than the down swings. The duration and time for down swings in an uptrend should be shorter than for the up swings.
Use Cases for Swing Detection
Trend Identification
By connecting the swing highs and lows, traders can identify and analyze the prevailing trend in the market. An uptrend is characterized by higher swing highs and lows, while a downtrend is characterized by lower highs and lower lows. The indicator helps traders visually assess the strength and continuity of the trend.
Support And Resistance Levels
The swing highs and lows can act as support and resistance levels. Swing highs may act as resistance levels where selling pressure increases, while swing lows may act as support levels where buying pressure increases. Traders often pay attention to these levels as potential areas for trade entries, exits, or placing stop-loss orders.
Pattern Recognition
The swings identified by the indicator can help traders recognize chart patterns, such as equal high/lows, consolidations, wedges, triangles or more complex patterns like Gartley or Head and Shoulders. These patterns can provide insights into potential trend continuation or reversal.
Trade Entry and Exit
Traders may use TRN Swing to determine potential trade entry and exit points. For example, in an uptrend, traders may look for opportunities to enter long positions near swing lows or on pullbacks to support levels. Conversely, in a downtrend, traders may consider short positions near swing highs or on retracements to resistance levels.
Swing Styles
In addition to the standard swings, you have the flexibility to choose between various swing styles, including ticks, percent, or even the famous Gann swings.
Standard
Gann
Ticks
Percent
Conclusion
While signals from TRN Swings can be informative, it is important to recognize that their reliability may vary. Various external factors can impact market prices, and it is essential to consider your risk tolerance and investment goals when executing trades.
Risk Disclaimer
The content, tools, scripts, articles, and educational resources offered by TRN Trading are intended solely for informational and educational purposes. Remember, past performance does not ensure future outcomes.

Swing Sniper by Republic of TradersSwing Sniper: A Comprehensive Market Reversal Indicator
Description:
Swing Sniper, developed by Republic of Traders, is a sophisticated trading indicator designed for traders who require precise market reversal signals. It performs optimally across all trading instruments and timeframes, offering both reliability and precision.
How It Works:
Swing Sniper employs a complex signal generation mechanism that activates only when six distinct conditions align within a specific timeframe. This includes:
A modified Commodity Channel Index (CCI) that helps identify short-term price fluctuations.
A Relative Momentum Index (RMI) utilized for recognizing long-term market trends.
A Supertrend indicator serves as a dynamic trend filter.
Several custom parameters that enhance signal reliability.
These components work synergistically to ensure that each trading signal is robust and well-founded. The indicator specializes in capturing significant market reversals by requiring a confirmation of trend reversal through a break and close above or below a previous supply/demand zone.
Usage Instructions:
Upon a valid signal, Swing Sniper advises traders that a potential market reversal has occurred and an entry may be considered in the direction of the new trend. Traders are recommended to set alerts for "once per candle close," allowing them to monitor multiple charts and timeframes simultaneously. Proper risk management is encouraged by placing stop losses just below or above the previous swing low or high and the signal candle's low or high. Take profits should similarly be set to capitalize on potential swings.
Why Choose Swing Sniper:
Swing Sniper is designed not only as a tool for generating entries but as a strategic component of your trading methodology. It brings a clear, analytical approach to navigating the markets, supported by detailed and logical indicator collaboration. This ensures users understand the underlying mechanics and can apply the tool effectively within their trading strategy.
Commitment to Originality and Utility:
Swing Sniper is a unique creation, adhering to TradingView’s standards by offering actionable insights that are distinct from other indicators available on the platform. It is meticulously crafted, featuring an original combination of technical analysis tools tailored to enhance market reversal detection.
Disclaimer:
Past performance is not indicative of future results. Always exercise due diligence and consider market conditions when trading.
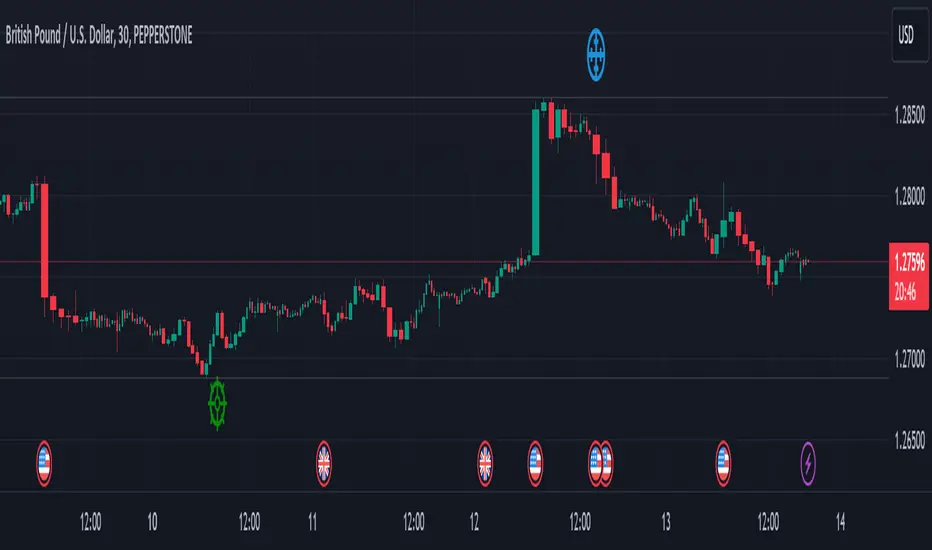
Visualization Aid:
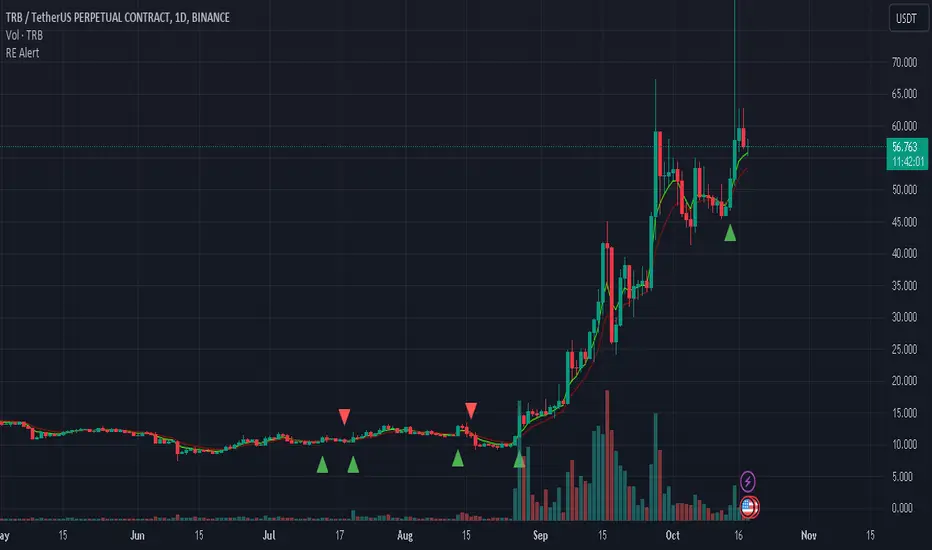
The accompanying chart visualization helps users identify signal examples, marked with a red triangle for market reversals short and a green triangle for market reversals long.
Embrace the strategic depth and precision of Swing Sniper and enhance your trading confidence and accuracy in financial markets.
Swing Trading Indicators (Improved)This "Swing Trading Indicators" script is a sophisticated trading tool designed for traders who wants to use technical analysis for identifying optimal entry points, safeguarding profits, and protect their capital. With foundations loosely based on the momentum burst strategy by Pradeep Bonde, Kristjan Kullamaggie's trading methodologies, and incorporating automatic stop-losses based on Average Daily Range (ADR) and Average True Range (ATR), this script offers a comprehensive solution if you want to capitalize on short-term market movements.
Key Features:
Indicators and Moving Averages: Includes EMA (5, 10, 20, 50 days), SMA (200 days), and the highest and lowest prices over 200 days to provide a multifaceted view of market trends and momentum.
Thrust Indicator: Central to the script, the thrust indicator signals a buy point when a candlestick bar closes above the highs of the last two days, indicating a momentum burst. This feature is particularly inspired by Pradeep Bonde's 4% breakout strategy, highlighting the script's capability to identify range expansion and upward thrusts as key entry moments.
Automatic Stop-Levels: Utilizes ADR and ATR to set dynamic stop-losses, helping traders to manage risk effectively by adapting to market volatility.
Comprehensive Market Analysis : Through volume analysis, RSI, closing range, and other parameters, the script offers a deep dive into market dynamics, aiding in decision-making.
Who Should Use It:
This tool is ideal for swing traders and momentum traders focused on short to medium-term gains. Its robust set of features makes it suitable for those who prefer a data-driven approach to identify buying opportunities and manage risk.
Trading Style Compatibility:
The thrust indicator shines in momentum trading strategies, providing clear signals for entering trades ahead of potential price jumps. The integration of moving averages and volume analysis supports a variety of trading styles, including day trading and swing trading, by offering insights into trend strength and potential reversals.
How the Thrust Indicator Works:
When you see a thrust indicator (green upwards arrow below a candle) when the price is moving out of a consolidation or low volatility price-range , that's the buy point.
The thrust indicator is NOT indended as an indicator for long term positions or trend reversals, but for entries at a good price while capturing the first day of a potential 5-20% move in the coming 3-5 days.
The thrust indicator pinpoints moments when a stock shows a strong upward momentum, characterized by a candlestick closing above the highs of the preceding two days. This identifies a momentum burst, signaling an optimal entry point for traders looking to profit from a short-term price movement, typically ranging from 5-20% over the following 3-5 days. Such precision in identifying entry points is invaluable for traders focusing on capturing quick gains from market volatility.
"Top / Watch out" Indicator:
In addition to the script's core functionality, the "WatchOut" indicator plays a crucial role in identifying potential reversals after significant price movements. By analyzing conditions such as recent price increases compared to the average daily range, RSI levels, and the opening price distance from the EMA, the "WatchOut" indicator alerts traders to exercise caution. This feature is pivotal for those looking to avoid entering trades that might be on the verge of a pullback or reversal, enhancing the script's utility in managing risk.

Smallest Swing [Truth Indie]This indicator is designed to test the smallest swing draw using the swing capture concept of the Pivot Points High Low indicator, setting the length to 1 for all periods, and combining it with price action that I think makes sense.
Example of a valid swing high.
Example of a valid swing low.

Kernel Regression RibbonKernel Regression Ribbon is a flexible, visually pleasing trend identification tool. Plotting 8 different kernel regressions of different types and parameters allows the user to see where levels of support and resistance are being tested, retested and broken.
What’s Kernel Regression?
A statistical method for estimating the best fitting curve for a dataset, in this case, a time/price chart.
How’s Kernel Regression different from a Moving Average?
A Moving Average is basically a simple form of Kernel Regression, in that it uses a fixed (Retangular) Kernel function. In an MA, all data points are weighted equally over its length. However, a Kernel function reacts more to data points that are closer to the current point. This means it will adapt more quickly to changes in data than an MA. Due to this adaptability, Kernel functions often form part of Machine Learning.
Using this indicator:
Explore the default Regular mode first to get a feel for the inputs, which are more numerous than for MAs. Try out different settings, filters and intervals to get the best out of each kernel. Not all parameters are available for each KR. There are info tips to explain this in the menu, but I’ve also included handy, optional labels on the chart for each KR as a more accessible guide.
Once you know your way round the Regular mode, check out the Presets and start changing the parameters of each kernel to your liking in the “User KR1, KR2, … “ mode. Each kernel type has its strong and weak points. Blending different kernels is where this indicator comes into its own. Give your charts a funky shine!
This indicator does NOT repaint.
This script acknowledges, and hopefully showcases, the great work of @veryfid Kernel Regression Toolkit.

buy/sell signals with Support/Resistance (InvestYourAsset) 📣The present indicator is a MACD based buy/sell signals indicator with support and resistance, that can be used to identify potential buy and sell signals in a security's price.
📣It is based on the MACD (Moving Average Convergence Divergence) indicator, which is a momentum indicator that shows the relationship between two moving averages of a security's price.
📣 The indicator also plots support and resistance levels, which can be used to confirm buy and sell signals. The support and resistance can also be used as a stoploss for existing position.
👉 To use the indicator, simply add it to your trading chart. The indicator will plot three sections:
📈 Price and Signals: This section plots the security's price and the MACD buy and sell signals.
📈 MACD Oscillator: This section plots the MACD oscillator, which is a histogram that shows the difference between the two moving averages.
📈 Moving Averages: This section plots the two moving averages that the MACD oscillator is based on.
📈 Support and Resistance: This section plots support and resistance levels, which are calculated based on the security's recent price action.
👉 To identify buy and sell signals, you can look for the following:
📈 Buy signal: When shorter Moving Average crosses over longer Moving Average.
📈 Sell signal: When shorter moving average crosses under longer moving average.
📈 You can also look for divergences between the MACD oscillator and the security's price. A divergence occurs when the MACD oscillator is moving in one direction, but the security's price is moving in the opposite direction. Divergences can be a sign of a potential trend reversal.
👉 To confirm buy and sell signals, you can look for support and resistance levels take a look at below snapshot. If a buy signal occurs at a support level, it is a stronger signal than if it occurs at a random price level. Similarly, if a sell signal occurs at a resistance level, it is a stronger signal than if it occurs at a random price level.
⚡ Here is a example of how to use the indicator to identify buy signal:
☑ Add the indicator to your trading chart.
☑Look for a buy signal when short MA crosses over Long MA.
☑Look for the buy signal to occur at a support level.
☑Enter a long position at the next candle.
☑Place a stop loss order below the support level.
☑Take profit when the MACD line crosses below the signal line, or when the security reaches a resistance level.
⚡ Here is an example of how to use the indicator to identify a sell signal:
☑Add the indicator to your trading chart.
☑Look for a sell signal, when shorter moving average crosses under longer moving average.
☑Look for the sell signal to occur at a resistance level.
☑Enter a short position at the next candle.
☑Place a stop loss order above the resistance level.
☑Take profit when the MACD line crosses above the signal line, or when the security reaches a support level.
✅Things to consider while using the indicator:
📈Look for buy signals in an uptrend and sell signals in a downtrend. This will increase the likelihood of your trades being successful.
📈Place your stop losses below the previous swing low or support for buy signals and above the previous swing high or resistance for sell signals. This will help to limit your losses if the trade goes against you.
📈Consider taking profits at key resistance and support levels. This will help you to lock in your profits and avoid giving them back to the market.
Follow us for timely updates regarding indicators that we may publish in future and give it a like if you appreciate the indicator.

REMA CROSSOVER BY JUGNUThis indicator triggers alerts for long and short positions on DAILY TIME FRAME for SWING trades based on the conditions which described below. This script will generate alerts when the following conditions are met:
LONG POSITION:
RSI(14) above 50.
EMA(5) crosses above EMA(10).
Indicator Triangle Green below price bars
SHORT POSITION:
RSI(14) below 50.
EMA(5) crosses down EMA(10).
Indicator Triangle RED above price bars
This script plots green and red triangles below and above the price bars to indicate long and short alert conditions, respectively. It also triggers alerts when these conditions are met.
Swing based support and resistanceThis indicator provided here is for identifying swing-based support and resistance levels. It uses two swing lengths, which can be adjusted by the user, to identify swings in the price data. For each swing length, the script calculates the support level as the low of the swing if the trend is up, or the high of the swing if the trend is down. It then plots the support and resistance levels on the chart, along with buy and sell signals.
The buy and sell signals are generated by comparing the current closing price to the support and resistance levels. If the closing price is above the support level, the script plots a buy signal. If the closing price is below the level, the script plots a sell signal.
To use the script, you would first need to add it to your trading platform. Once it is added, you can configure the swing lengths and other parameters to suit your trading style. You can then apply the script to a chart and begin using the support and resistance levels and buy and sell signals to make trading decisions.
Points to be noted while using the indicator:
# The script is designed to be used on a daily chart. However, you can also use it on other timeframes, such as weekly or monthly charts.
# The swing lengths that you choose will depend on your trading style. If you are a swing trader, you may want to use longer swing lengths. If you are a day trader, you may want to use shorter swing lengths.
# Remember, the support and resistance levels generated by the script are not exact price points. They are rather zones where demand and supply can change. Therefore, you should always use other technical analysis tools and indicators to confirm your trading decisions.
# Overall, the script is a useful tool for identifying swing-based support and resistance levels. It can be used by traders of all experience levels to generate trading ideas and improve their trading performance.
To use the swing-based support and resistance indicator with respect to price, you can follow these steps:
=> Identify the support and resistance levels that have been generated by the indicator.
=> Look for price action that is taking place near these levels.
=> If the price is above the level, look for bullish reversals or continuations.
=> If the price is below the level, look for bearish reversals or continuations.
For Example,
=> Bullish reversal: The price is above the level and forms a bullish candlestick pattern, such as a bullish hammer or engulfing pattern.
=> Bullish continuation: The price is above the level and bounces off of the level.
=> Bearish reversal: The price is below the level and forms a bearish candlestick pattern, such as a bearish hammer or engulfing pattern.
=> Bearish continuation: The price is below the level and rejects the level.
$$ You can also use the indicator to identify potential trading entry and exit points. For example, you could enter a long trade when the price breaks above a resistance level and exit the trade when the price retraces to the resistance level. Or, you could enter a short trade when the price breaks below a support level and exit the trade when the price rallies to the support level.
This swing-based support and resistance indicator is just one tool that you can use to trade. You should always use other technical analysis tools and indicators, such as price action and trend analysis, to confirm your trading decisions.
Additionally:
=> Be aware of the overall trend direction. If the trend is up, you should be looking for bullish reversals or continuations. If the trend is down, you should be looking for bearish reversals or continuations.
=> Use a stop loss order to limit your risk on each trade.
=> Consider using a position sizing strategy to manage your risk.
=> Do your own research and backtest any trading strategy before using it in a live trading environment.
Follow us for timely updates regarding future indicators and give it a like if you appreciate the indicator.

Nitin Swing TradingThis is a CPR which indicates pivot points based on monthly price action.
The Orange line acts as a resistance area, blue lines act as pivot point/CPR and green one is support.
One can study retrospective chart to analyse how market has respected these Support and Resistance levels.
A guide on how to trade using this indicator?
1. If you see the resistance is broken after multiple attempt - We can Go Long
2.If you see price going down below CPR, We can Go Short
3.If you see price taking support at support level - We can Go Long.
Risk reward should always be 1:1 then gradually increase it to 1:2 & 1:3
It is advised to consult with your financial advisor before taking any trade just based on any indicator. You have to manage risk before entering any trade.

Swing Ranges [ChartPrime]Swing Ranges is an indicator designed to provide traders with valuable insights into swing movements and real-time support and resistance (SR) levels. This tool detects price swings and plots boxes around them, allowing traders to visualize the market dynamics efficiently. The indicator's primary focus is on real-time support and resistance levels, empowering traders to make well-informed decisions in dynamic market conditions.
Key Features:
Swing Box Visualization:
Swing Ranges excels at detecting swings in the price data and visually representing them with boxes on the price chart. This enables traders to quickly identify swing ranges, essential for understanding market trends and potential reversal points. VWAP POCs are also provided giving areas of high activity in each block.
Real-Time Support and Resistance Levels:
The core feature of Swing Ranges is its real-time support and resistance levels. These levels are dynamically calculated based on the volume-weighted data for each specific range. The indicator displays the strength of support and resistance zones with percentage bars, indicating the ratio between bullish and bearish volume. This real-time information empowers traders to assess the strength and significance of each SR level, enhancing their ability to execute well-timed trades.
ATR (Average True Range) Value:
Swing Ranges also includes an ATR value label, which shows the Average True Range for the selected period. ATR aids traders in understanding market volatility, enabling them to set appropriate stop-loss and take-profit levels for their trades.
VWAP (Volume Weighted Average Price) Information:
Traders c an readily access the VWAP value through the indicator's label. VWAP provides insights into the average price at which an asset has been traded, helping traders identify potential fair value areas and market trends.
Price Difference Percentage:
Swing Ranges displays the percentage difference between the high and low of each swing. This information allows traders to gauge the magnitude of price movements and assess potential profit targets more effectively.
The indicator also has a NV value. If the NV is high e.g. 10% or more there is indecision in the market and the market is trying to remain in a given range.
Settings Inputs:
1. Length Control:
The Length setting input in Swing Ranges allows traders to adjust the sensitivity of the indicator to detect swings. Traders can customize the length based on their trading strategies and timeframes.
2. ATR Period Adjustment:
The ATR Period input allows traders to fine-tune the calculation period for the Average True Range. This feature enables traders to adapt the indicator to different market conditions and asset classes.
Swing Ranges: Real-Time Support and Resistance Indicator is a comprehensive tool that combines swing visualization with dynamic support and resistance levels. By focusing on real-time SR levels, this indicator equips traders with the essential information needed to make confident trading decisions in ever-changing market conditions.

Swing Breaker Strategy [v0.1] - Support and resistance breakoutSwing Breaker Strategy - Support and Resistance Breakouts
This strategy has no repainting.
Default settings:
Swing Barsback: 10
Number of Swings: 3
Stoploss Candles Lookback: 5
Why these default settings?
This strategy has been backtested with over 100 trades, and on a larger scale of 1000 trades, it has reported a 1.33 profit factor with a maximum 5% cumulative drawdown, using no leverage. In this backtest, the settings (10,3,5) were used, becoming the default settings as they are more adaptable to different market conditions.
How does this strategy work?
Defining swing lows (support) and swing highs (resistance): We can locate these candles by looking at a symmetrical candle unit around them. For example, the default settings present a 10 swing bars back, which means there is no superior level within a 10-candle radius in the case of a swing high, and the opposite for a swing low. Swings are located a few candles after, just the number of swing bars back (width), because it is needed to ensure it is a swing.
Locating trends: We locate trends by looking at consecutive swings. For example, in the default settings, to determine a bullish trend, we need 3 consecutive ascending swing lows; for a bearish trend, 3 consecutive descending swing highs. You can find this parameter in settings as "Number of swings."
When a trend is formed, a stop entry is placed at the last swing until it is broken.
Just after the entry, the stop is placed at the lowest (in the case of a long) or the highest (in the case of a short) of the last candles. You can define that number in the settings as "Stoploss candles lookback," which default is 5. The take profit is placed at 2 times the stop value, resulting in a 2 risk-reward ratio.
Why is this strategy protected?
No other strategy combines the way of locating swings and turning it into a strategy, including customizable parameters such as stop loss, swing width and introducing the number of swings. That's why we decided to protect it.