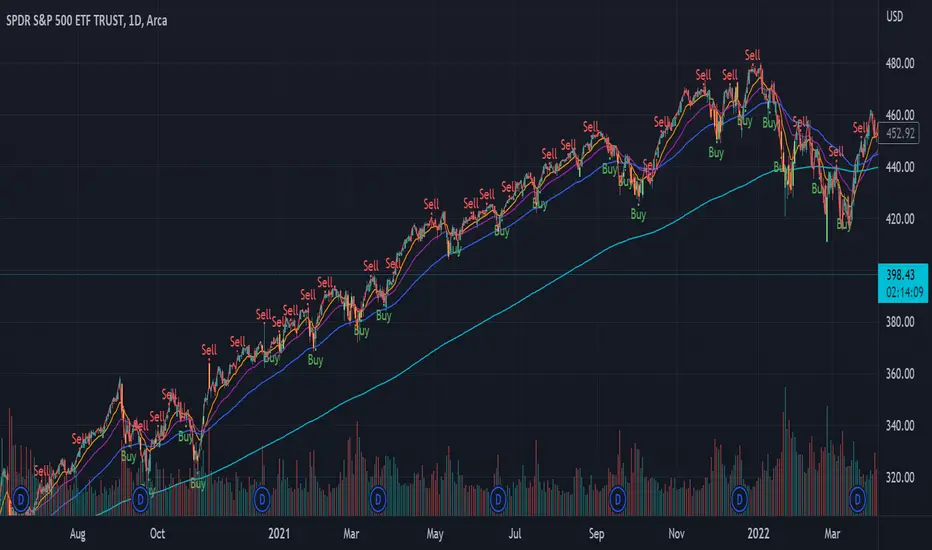
Law of Effort vs Results is a tool to find the price changes based on volume. This tool shows that if there is a high volume occur but the price has small difference in one candle, this will trigger a 'spike'. This spike represents that a high activity has occurred but the price did not reflect as the volume changes. The analogy of this tool can be represented...
This script calculates how much cryptos or dollars you have to bet with 4 variables : Risk Loss , Leverage, Entry and Stop Loss. When you want to open a position, just complete the parameters and the script will tell you how much you have to bet in dollars or cryptos units, depending the way you're trading. Note : don't foreget that you have to pay fees on...
This script is based on the Gann's 50% Retracement rule. First, the ATH (All Time High) and ATL (All Time Low) are calculated; then, the 50% retracement level is found. With this 50% level, we'll calculate the maximum price entry to keep a ROI which is set in the parameters. For exemple, I only want to buy assets which can make a x16 before the 50% retracement...
Hello everyone, This is the first script I publish, also my English is not the best my apologies. This simple study script is an attempt to estimate the slippage during a trade. By no means it is a precise calculation, it is just an approach that can be improved. You are welcome to take this simple script and use it and change it at your convenience just ask...
The MA is indicating historical cost on the market. This script will help you observe MA with price and slope. This stript is inspired by LEI & LoneCapital. All thanks to LEI.
This is an Tradingview implementation of the Grahams Formula as described in Benjamin Grahams book "The Intelligent Investor". In theory this can be used to screen for over- and undervalued stocks, however as Graham himself notes, you should look into other fundamentals when using them in conjunction with Grahams formula.
Institutional investors have a profound impact on financial instruments prices because of the large volume, and their trading activities can greatly impact the price of financial instruments. They sometimes may split trades over time in order to not make a material impact and of course not to decrease liquidity to the point where there may be no one to take the...
Buys amount of shares by bars with specified amount of money (100$ for a month bar for example). Including commissions.
I present to you a script for testing the channel breakout strategy for the Bitmex exchange. Cryptocurrency itself is a trending tool, which is why breakout strategies generate the largest profits, and the channel breakout strategy is one of the most effective trend strategies. The optimization result shows the result of trading on a volume of 20% of the deposit....
Simple script useful to scan you position with all previous closing pattern.
Price and Moving Averages Convergence/Divergence, shortly named as P-MACD P-MACD is a trend-following momentum indicator that shows the relationship between Price and Long-term Moving Average (PMACD), and the relationship between two Moving Averages (MAMACD). P-MACD is composed of two lines, and an histogram, showing price distance (convergence/divergence) to...
Prices high above the moving average (MA) or low below it are likely to be remedied in the future by a reverse price movement as stated in an Article by Denis Alajbeg, Zoran Bubas and Dina Vasic published in International Journal of Economics, Commerce and Management Here comes a study to indicate the idea of this article, Price Distance to its Moving Averages...
Function: labelling recent highs and lows automatically. Easy and clean. In this example, we can see the previous low of the ticker is around 105.5, the previous high is around 120. We can set up our entries and exits by referring to the last lows and highs. Users can adjust the searching bar range by themselves.
Hey there, here I like to publish my first TradingView Script for the Indicator "LotSizeCalc" which calculates the LotSize for the currency '€' for e.g. the MT4-App depending on the following parameters: - Stop Loss in pips (example: 30 pips) - Account Balance in EUR (example: 500€) - Risk in % (example: 1%) It is very similar to the MyFxBook Calculator on their...
Shows the historic bar type, whether it is up, down, up and inside, down and inside, up and outside, or down and outside. Will only display historic bar type based on the selected time timeframe. (Ex. if you are looking at the weekly time frame, you will only see the bar type for Year, Quarter, Month, and Week. It will not display the Day or Hour bar type.)
Hello everyone, Quick script to check the PEG Ratio. What is PEG Ratio? The price/earnings to growth ratio (PEG Ratio) is a stock's price-to-earnings (P/E) ratio divided by the growth rate of its earnings for a specified time period. The PEG ratio is used to determine a stock's value while also factoring in the company's expected earnings growth, and is...
This is my revision of AO (Awesome Oscillator) that can give more correct and early signals as on my opinion. I'm used a original formula of AO and modified it with high and low prices adding. Enjoy it!