Blockchain Fundamentals: PPT [CR]Blockchain Fundamentals: PPT
A proprietary market positioning indicator that analyzes price behavior using percentile-based statistical methods. The PPT (Percentile Position Transform) provides a normalized oscillator view of market conditions, helping traders identify potential trend exhaustion and reversal zones through multi-timeframe statistical analysis.
█ FEATURES
Dual Signal Lines
The indicator plots two distinct signals:
- White Line — Primary signal representing the normalized, smoothed market position. This is the main signal used for trading decisions.
- Red Line — Raw statistical measurement before final normalization. Useful for identifying divergences and signal development.
Background Coloring
Dynamic background colors provide at-a-glance market context:
- Green Background — Indicates bullish positioning when the primary signal exceeds the buffer threshold.
- Red Background — Indicates bearish positioning when the primary signal falls below the buffer threshold.
- Gray Background — Neutral zone where no clear directional bias is present.
Flip Buffer
An adjustable threshold system designed to reduce noise and false signals:
- Enable Flip Buffer — Toggle the buffer system on or off.
- Buffer Size — Adjustable threshold level (default -0.1) that determines when background colors change. Higher values reduce sensitivity; lower values increase responsiveness.
Reference Levels
Three horizontal reference lines provide context:
- Center line at 0 — Neutral market position.
- Upper dashed line at +1 — Extreme bullish positioning threshold.
- Lower dashed line at -1 — Extreme bearish positioning threshold.
█ HOW TO USE
Signal Interpretation
The indicator operates as a mean-reversion oscillator within a normalized range:
1 — Values approaching +1 suggest extended bullish conditions where price may be overextended relative to recent history.
2 — Values approaching -1 suggest extended bearish conditions where price may be oversold relative to recent history.
3 — Crosses of the center line (0) indicate shifts in the underlying statistical trend.
Trading Applications
While specific trading strategies will vary by individual approach and market conditions:
- Consider the extremes (+1 and -1 levels) as potential areas of interest for mean-reversion setups.
- Background color changes can help identify when market positioning shifts from one regime to another.
- Divergences between the white and red lines may provide early warning of potential trend changes.
- The buffer zone (gray background) represents areas where market positioning is relatively neutral.
█ LIMITATIONS
- The indicator requires sufficient historical data to function properly. In assets with limited price history, the statistical measurements may be less reliable during early data periods.
- As a percentile-based system, the indicator is relative to recent history. Changing market regimes may require interpretation adjustments.
- Not designed for high-frequency or scalping strategies due to its daily data dependency.
- Background colors are visual aids and should not be used as standalone trading signals without additional confirmation.
█ NOTES
This indicator is part of the Blockchain Fundamentals suite and represents proprietary research into statistical market positioning analysis.
Users should experiment with the buffer settings to match their risk tolerance and trading style. More conservative traders may prefer larger buffer values to reduce signal frequency, while active traders might benefit from smaller buffers that provide earlier warnings.
Blockchain

TernTable: Crypto SectorsTernTables:CryptoSecs
This was hung on my Sector ETFs script to see if I could filter some noise from crypto by applying a GICS (Global Industry Classification Standard) style sector model to the crypto markets.
Crypto classification is certainly a little more nuanced so not completely straightforward.
It was designed to filter a researched and organised view of generally recognised cryptocurrency sectors and their confirmed constituent components.
The main purpose was a shot at displaying live crypto market data on my chart with instantaneous visual analysis, using leader laggard colour logic for performance indication, plus bullish bearish colour logic using the header for instant visual sector strength analysis.
This was never going to be an exhaustive tool of course and amazingly only or two of the sector lists wont fit on your laptop screen without zooming but it’s UI versatility both in custom display and custom threshold functionality is very effective. Viewing a coin on your watchlist with its sector overlayed in the chart brings the optional visual alert function into consideration. All basic but all effective and all customisable
Can't ignore the educational value either it’s teaching by osmosis what the sectors do and which coins go where clues to why.
As an after thought - I added a live stock market filter for 20 sector-specific ETFs like SPY, QQQ, XLV, XLF, allowing the comparison of the live performance of traditional financial sectors to live crypto sector data without leaving your chart.
Not certain how often it will need to be updated and any feedback re the legitimacy and accuracy of its components is kindly welcomed it is up to date at date of publishing.
It’s pretty easy to use, here is a list what you're getting with sector classifications with brief descriptions
CMC 20
CoinMarketCap Top 20: the largest cryptos by market cap. Great starting point to see what the overall market is doing
ETFs
All major U.S.-listed Bitcoin & Ethereum ETFs. Lets you compare crypto performance directly with traditional finance
Layer 0
Foundational interoperability protocols (Polkadot, Cosmos, ICP, etc.). These are the “bridges” that allow different blockchains to communicate
Layer 1
Independent base-layer blockchains that run their own consensus and security (Bitcoin, Ethereum, Solana, Cardano, TON, etc.).
Layer 2
Scaling networks built on top of Layer 1s to increase speed and lower fees (Arbitrum, Optimism, Base, Polygon, zk-rollups, etc.)
Layer 3
Application-specific chains or rollups designed for one purpose (gaming chains, DeFi-specific, social, etc.)
Web3
The “ownership internet”: gaming tokens, NFTs, metaverse land, music/streaming platforms, social tokens, and creator-economy projects
DeFi
Decentralised Finance: lending platforms, decentralized exchanges, derivatives, yield aggregators, and insurance protocols
Decentralised Storage
Blockchain-based alternatives to AWS/Google Cloud (Filecoin, Arweave, Storj, etc.)
Oracles
Data providers that feed off-chain information (prices, weather, sports results) into smart contracts
Privacy
Privacy coins and protocols that obfuscate transaction details (Monero, Zcash, Beam, etc.)
Yield & Lending
Protocols focused purely on lending, borrowing, and yield generation
DEX
Pure decentralized exchanges (Uniswap, SushiSwap, Jupiter, GMX, etc.)
DAO
Governance tokens of major decentralized autonomous organizations (Maker, Lido, Aave, ENS, etc.)
Infrastructure / Middleware
The picks-and-shovels layer: node services, RPC providers, indexing, cross-chain bridges, etc
Real World Assets (RWA)
Tokenised traditional assets: treasuries, real estate, private credit, stablecoins backed by real-world collateral
Restaking & Liquid Restaking
EigenLayer ecosystem and liquid-restaking tokens (eigen, ether.fi, Pendle, etc.). Currently the fastest-growing narrative
Traditional Sector ETFs
Classic U.S. sector ETFs (SPY, QQQ, XLF, XLE, XLV, XLY, etc.). Extra layer of analysis by comparing live stock market conditions with livecrypto market conditions
A list of the UI Toggles
* Sector Dropdown
• Select Sector: Choose the sector to display (e.g., CMC 20, Layer 1, DeFi, etc.)
* Custom Tickers
• Enter Tickers: Input custom coin tickers (e.g., BTCUSD, ETHUSD) to track specific assets
* Show % Change Row
• Toggle On/Off: Display the % change row for each sector/coin
* Show Current Price Row
• Toggle On/Off: Display the current price for each sector/coin
* Show Price-Diff Row
• Toggle On/Off: Display the price difference (current price - previous day's price)
* Show Spacer Row
• Toggle On/Off: Add a spacer row between data rows for clarity
* Table Position
• Select Position: Choose the position of the data table on your chart (Top Left, Top Right, etc.)
Visual Options:
* Show Sector Name
• Toggle On/Off: Display the sector name pane label on chart
* Custom Bull/Bear Threshold
• Toggle On/Off: Set a custom threshold for bullish/bearish sector performance
• Threshold (%): Set the percentage threshold (e.g., 50%) for bullish/bearish classification
* Show Live % in Header
• Toggle On/Off: Display the live percentage change in the table header
* Dynamic Decimal Formatting
• Toggle On/Off: Enable dynamic formatting for numbers display.
* Sort by % Change
• Toggle On/Off: Sort sectors by % change in performance
* Enable Alerts
• Toggle On/Off: Enable alerts based on performance thresholds
* Alert Threshold (%)
• Set Threshold: Define the percentage threshold (e.g.,70%) for triggering alerts
* Cooldown (bars)
• Toggle On/Off: Enable cooldown to prevent alerts from triggering too quickly
• Cooldown Duration: Set the cooldown period in bars (e.g., 10 bars)
* % Threshold Mode
• Toggle On/Off: Enable % Threshold Mode to filter sectors based on a percentage change threshold
• Threshold %: Set the percentage for filtering sectors (e.g., only show sectors with > 5% change)
A lot of toggles probably left once favourites are set but this UI interface does allow experimentation with the utility of channelling raw live data through custom designed filters. Just saying !
I need to include this of course
This indicator provides sector-based organisation and real-time performance visualisation for cryptocurrencies. It is not intended to predict price movements or guarantee outcomes. Crypto assets carry significant risk, including loss of capital. Past performance does not guarantee future results. All data and sector classifications are best-effort and may be incomplete, inaccurate, or outdated. Nothing in this script should be interpreted as financial advice. You are solely responsible for your own trading decisions.
That’s it really, I am currently pleased with how this indicator turned out, if you have a crypto trading toolkit put this in it.

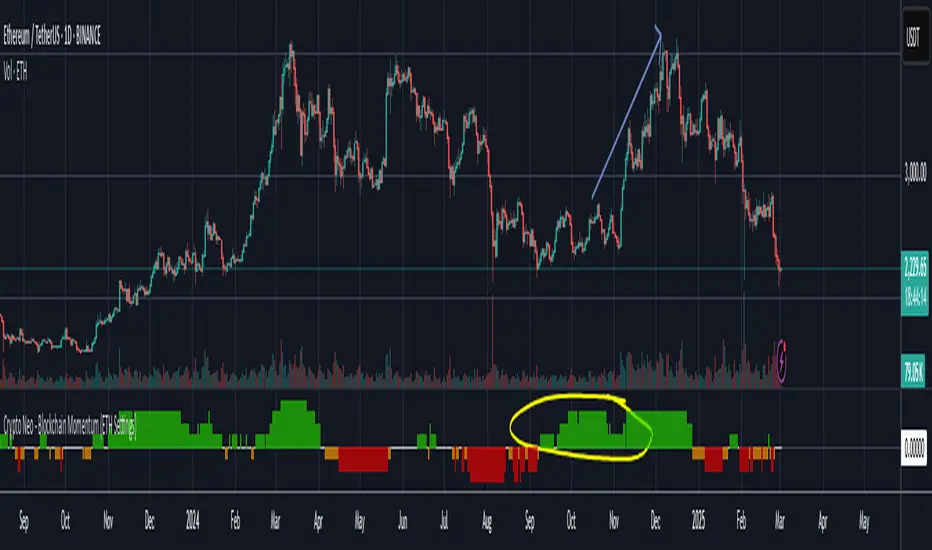
Crypto Neo - Blockchain Momentum (ETH Settings)The Crypto Neo - Blockchain Momentum indicator analyzes Ethereum’s on-chain activity to gauge bullish or bearish trends. It combines multiple on-chain metrics and applies different moving average strategies to assess Ethereum’s momentum.
This indicator is designed to track key blockchain data sources, such as:
Hash Rate
Active Addresses
Transactions per Second
Transfers per Second
Trader Behavior
Long-Term Holders (Cruisers)
Money Flow In/Out
Total Value Locked
It processes these inputs using various Moving Average (MA) types, including SMA, EMA, DMA, to generate a Bullish Momentum Score, which is visually displayed on the chart.
How to Use:
Select MA Type – Choose between SMA, EMA, MIXMA, or DMA to determine how moving averages are applied.
Set MA Lengths – Adjust MA1 Length and MA2 Length to define short-term vs. long-term trend comparison.
Customize Data Sources – Select different on-chain metrics for the indicator to analyze.
Interpret the Bullish Momentum Score:
🟢 Green (Strong Bullish Momentum) – Bullish on-chain signals dominate.
🟡 Yellow (Moderate Bullish Momentum) – Weak bullish trend forming.
⚪ White (Neutral) – No clear trend.
🟠 Orange (Moderate Bearish Momentum) – Weak bearish signals emerging.
🔴 Red (Strong Bearish Momentum) – Bearish on-chain signals dominate.
Important Notes
* This indicator does not generate trading signals but helps interpret blockchain trends for informed decision-making.
* Since it relies on daily on-chain data, it is best used on the 1D timeframe for accurate readings.
* Real-time calculations may vary slightly due to different bar update behaviors.
This indicator is very useful to confirm market turns early. Here are a few an example setups:
1. Back in 2022 on chain metrics started trending down after the market was consolidating at the top. On chain data predicted momentum moving to the downside.
2. Around October 2024, on-chain metrics showed bullish momentum while ETH was consolidating. It led to a rally in November.
Blockchain Fundamentals: Liquidity Cycle MomentumLiquidity Cycle Momentum Indicator
Overview:
This indicator analyzes global liquidity trends by calculating a unique Liquidity Index and measuring its year-over-year (YoY) percentage change. It then applies a momentum oscillator to the YoY change, providing insights into the cyclical momentum of liquidity. The indicator incorporates a limited historical data workaround to ensure accurate calculations even when the chart’s history is short.
Features Breakdown:
1. Limited Historical Data Workaround
Function: The limit(length) function adjusts the lookback period when there isn’t enough historical data (i.e., near the beginning of the chart), ensuring that calculations do not break due to insufficient data.
2. Global Liquidity Calculation
Data Sources:
TVC:CN10Y (10-year yield from China)
TVC:DXY (US Dollar Index)
ECONOMICS:USCBBS (US Central Bank Balance Sheet)
FRED:JPNASSETS (Japanese assets)
ECONOMICS:CNCBBS (Chinese Central Bank Balance Sheet)
FRED:ECBASSETSW (ECB assets)
Calculation Methodology:
A ratio is computed (cn10y / dxy) to adjust for currency influences.
The Liquidity Index is then derived by multiplying this ratio with the sum of the other liquidity components.
3. Year-over-Year (YoY) Percent Change
Computation:
The indicator determines the number of bars that approximately represent one year.
It then compares the current Liquidity Index to its value one year ago, calculating the YoY percentage change.
4. Momentum Oscillator on YoY Change
Oscillator Components:
1. Calculated using the Chande Momentum Oscillator (CMO) applied to the YoY percent change with a user-defined momentum length.
2. A weighted moving average (WMA) that smooths the momentum signal.
3. Overbought and Oversold zones
Signal Generation:
Buy Signal: Triggered when the momentum crosses upward from an oversold condition, suggesting a potential upward shift in liquidity momentum.
Sell Signal: Triggered when crosses below an overbought condition, indicating potential downward momentum.
State Management:
The indicator maintains a state variable to avoid repeated signals, ensuring that a new buy or sell signal is only generated when there’s a clear change in momentum.
5. Visual Presentation and Alerts
Plots:
The oscillator value and signalline are plotted for visual analysis.
Overbought and oversold levels are marked with dashed horizontal lines.
Signal Markers:
Buy and sell signals are marked with green and maroon circles, respectively.
Background Coloration:
Optionally, the chart’s background bars are colored (yellow for buy signals and fuchsia for sell signals) to enhance visual cues when signals are triggered.
Conclusion
In summary, the Liquidity Cycle Momentum Indicator provides a robust framework to analyze liquidity trends by combining global liquidity data, YoY changes, and momentum oscillation. This makes it an effective tool for traders and analysts looking to identify cyclical shifts in liquidity conditions and potential turning points in the market.

Blockchain Fundamentals: Liquidity & BTC YoYLiquidity & BTC YoY Indicator
Overview:
This indicator calculates the Year-over-Year (YoY) percentage change for two critical metrics: a custom Liquidity Index and Bitcoin's price. The Liquidity Index is derived from a blend of economic and forex data representing the M2 money supply, while the BTC price is obtained from a reliable market source. A dedicated limit(length) function is implemented to handle limited historical data, ensuring that the YoY calculations are available immediately—even when the chart's history is short.
Features Breakdown:
1. Limited Historical Data Workaround
- Functionality: limit(length) The function dynamically adjusts the lookback period when there isn’t enough historical data. This prevents delays in displaying YoY metrics at the beginning of the chart.
2. Liquidity Calculation
- Data Sources: Combines multiple data streams:
USM2, ECONOMICS:CNM2, USDCNY, ECONOMICS:JPM2, USDJPY, ECONOMICS:EUM2, USDEUR
- Formula:
Liquidity Index = USM2 + (CNM2 / USDCNY) + (JPM2 / USDJPY) + (EUM2 / USDEUR)
[b3. Bitcoin Price Calculation
- Data Source: Retrieves Bitcoin's price from BITSTAMP:BTCUSD on the user-selected timeframe for its historical length.
4. Year-over-Year (YoY) Percent Change Calculation
- Methodology:
- The indicator uses a custom function, to autodetect the proper number of bars, based on the selected timeframe.
- It then compares the current value to that from one year ago for both the Liquidity Index and BTC price, calculating the YoY percentage change.
5. Visual Presentation
- Plotting:
- The YoY percentage changes for Liquidity (plotted in blue) and BTC price (plotted in orange) are clearly displayed.
- A horizontal zero line is added for visual alignment, making it easier to compare the two copies of the metric. You add one copy and only display the BTC YoY. Then you add another copy and only display the M2 YoY.
-The zero lines are then used to align the scripts to each other by interposing them. You scale each chart the way you like, then move each copy individually to align both zero lines on top of each other.
This indicator is ideal for analysts and investors looking to monitor macroeconomic liquidity trends alongside Bitcoin's performance, providing immediate insights.

Blockchain Fundamentals: Global LiquidityGlobal Liquidity Indicator Overview
This indicator provides a comprehensive technical analysis of liquidity trends by deriving a Global Liquidity metric from multiple data sources. It applies a suite of technical indicators directly on this liquidity measure, rather than on price data. When this metric is expanding Bitcoin and crypto tends to bullish conditions.
Features:
1. Global Liquidity Calculation
Data Integration: Combines multiple market data sources using a ratio-based formula to produce a unique liquidity measure.
Custom Metric: This liquidity metric serves as the foundational input for further technical analysis.
2. Timeframe Customization
User-Selected Period: Users can select the data timeframe (default is 2 months) to ensure consistency and flexibility in analysis.
3. Additional Technical Indicators
RSI, Momentum, ROC, MACD, and Stochastic:
Each indicator is computed using the Global Liquidity series rather than price.
User-selectable toggles allow for enabling or disabling each individual indicator as desired.
4. Enhanced MACD Visualization
Dynamic Histogram Coloring:
The MACD histogram color adjusts dynamically: brighter hues indicate rising histogram values while darker hues indicate falling values.
When the histogram is above zero, green is used; when below zero, red is applied, offering immediate visual insight into momentum shifts.
Conclusion
This indicator is an enlightening tool for understanding liquidity dynamics, aiding in macroeconomic analysis and investment decision-making by highlighting shifts in liquidity conditions and market momentum.

MVRV-Z adjusted EN version (by ilyaevp95)Descriptions:
The MVRV Z-Score indicator is a powerful tool designed by original authors Murad Mahmudov and David Puell for BTC to help traders make informed decisions about their cryptocurrency investments. It is based on the MVRV (Market Value to Realized Value) metric, which measures the relationship between the market capitalization and the realized capitalization of a cryptocurrency. The indicator provides signals for accumulating or selling an asset based on deviations in market capitalization from realized capitalization.
How it works:
Market Capitalization : This is the total value of coins that have been issued at a given point in time. Market capitalization is calculated by multiplying the current price of the asset by the number of coins that have been issued.
Realized Capitalization (Realized Price) : This is the amount of money that has been spent on purchasing a particular asset. In the context of cryptocurrencies, it represents the sum of all transaction values for a specific blockchain. Realized capitalization can be calculated using historical data on transaction prices.
MVRV Metric : The MVRV metric compares market capitalization with realized capitalization, providing a measure of how overvalued or undervalued a cryptocurrency is relative to its historical transaction data. A high MVRV value indicates that the market is overvaluing the asset, while a low MVRV suggests undervaluation.
Z-Score Calculation : The Z-score is a statistical measure that normalizes the deviation of market capitalization from its mean value (realized capitalization) to a standard deviation. This makes it possible to compare assets that have different values and time periods, as it takes into account the volatility of the market.
Note: For accurate Z-score calculation, you need to use the indicator on a chart with a mostly complete historical data set for a specific cryptocurrency.
Signals : Based on the Z-score, the indicator generates signals for accumulation or sale. If the Z-score falls below a certain threshold (negative), it may indicate an opportunity to accumulate the asset. Conversely, if the Z-score rises above a positive threshold, it could suggest a potential sell signal.
The indicator uses a color-coded system to provide traders with visual cues:
Green background indicates a signal to accumulate.
Orange (Red) background indicates a signal to sell.
Deviations exceeding the specified thresholds by 1 and 2 Z (positive direction), 0.5 and 1 Z (negative direction) are highlighted in a brighter color, indicating more extreme deviations.
Note: The signals provided by this indicator should not be considered financial advice. Traders should conduct their own research (DYOR) before making any investment decisions.
Parameters: The indicator provides several parameters for customization:
Blockchain : The blockchain for which the analysis is performed. This allows the user to select the specific blockchain they are interested in analyzing. The default value is BTC.
Z threshold for positive deviations : This parameter sets the threshold above which the deviation will be considered positive. A higher value will result in fewer signals, while a lower value may generate more false signals. The default value is 3.0.
Z threshold for negative deviations : Similar to the previous parameter, this sets the threshold below which the deviation will be considered negative. The default value is 0.
Market Capitalization : There are two types of market capitalization available: Standard and Free float coin capitalization. Free float is calculated by multiplying its current price by the total number of units in free circulation - the number that are not locked in any contracts or other forms of restriction. For DASH, ZEC, BAT and ALGO available only Free float capitalization. The default value is "Standard"
Negative Deviation Filter Mode : When enabled, if the deviation has been positive for a certain number of previous weeks (the default value is 40 weeks), the indicator will not generate a signal to accumulate. This helps to avoid false signals during the start of a bearish market. This may be helpful for volatile coins, whose price can drastically fall below the realized price after the end of a bull market. The default setting is "disabled".
Display Options:
MVRV plot : Displays the MVRV metric for the selected blockchain.
Z-Score plot : Shows the Z-score calculated by the indicator.
Realized Price plot : Provides a visual representation of the realized price of the cryptocurrency on main chart.
S ignal Display : Choose whether to display signals on the main chart or in a separate panel.
Historical mode : Choose whether to show signals for all historical data on the chart or for a certain number of periods. The default setting is "disabled".

CryptoLibrary "Crypto"
This Library includes functions related to crytocurrencies and their blockchain
btcBlockReward(t)
Delivers the BTC block reward for a specific date/time
Parameters:
t (int) : Time of the current candle
Returns: blockRewardBtc

True Market Mean BandsIntroducing the "True Market Mean Bands" (TMMB) , a technical analysis tool designed for Bitcoin. TMMB provides a model of market valuation by integrating the concept of Vaulted Realized Price with dynamic volatility bands, offering traders insights into potential market movements.
Core Concept and Utility:
The TMMB centers around the Vaulted Realized Price, an advanced metric that refines the realized price by accounting for Bitcoin that is "vaulted" - or held out of active circulation. This metric offers a deeper understanding of market valuation by considering not just the last transaction prices but also the long-term holding behaviors of investors.
Innovative Bands:
Building on this core concept, the TMMB introduces multiple bands that reflect market volatility and supply dynamics. These bands are derived using a combination of statistical analysis and customizable multipliers, allowing for adaptation to varying market conditions. The bands include:
Standard Deviation Bands: Adjusted for market volatility, providing a dynamic measure of overbought and oversold conditions.
Vaulted Realized Price Multiplier Bands: These bands use multipliers inspired by the price distribution around the mean, aligning with key psychological and mathematical levels in the market.
Technical Insight:
At the heart of TMMB lies a robust calculation framework that leverages:
Security Function: To fetch relevant market data, ensuring real-time accuracy and relevance.
Customizable Multipliers: Allowing users to adjust the sensitivity of the bands according to their trading strategies.
Statistical Analysis: Utilizing standard deviation and mean calculations to dynamically adapt the bands to market conditions.
Originality and Usefulness:
The TMMB stands out by offering a unique perspective on Bitcoin's market valuation, taking into account long-term holding patterns which are often overlooked in traditional indicators. This approach not only enriches market analysis but also provides traders with actionable insights, potentially enhancing trading strategies.
Application and Value:
TMMB is especially useful for traders and analysts looking for a deeper understanding of market dynamics, beyond surface-level price movements. It offers a valuable tool for identifying potential entry and exit points, assessing market sentiment, and making informed trading decisions.

Blockunity Address Synthesis (BAS)Track the address status of the various cryptoassets and their evolution.
The Idea
The goal is to provide a simple tool for visualizing the evolution of different types of crypto addresses.
How to Use
This tool is to be used as fundamental information. It is not intended for investment or trading purposes.
Elements
Active Addresses
Active Addresses represent the subset of total addresses that made one or more on-chain transaction on a given day.
New Addresses
New Addresses refer to addresses that receive their first deposit in the selected crypto-asset.
Zero Balance Addresses
Zero Balance Addresses are addresses that transferred out (potentially sold) all of their holdings for the selected crypto-asset.
Total Addresses
Total Addresses refer to the overall count of unique addresses that have been created on a blockchain network.
Settings
In the settings, you can :
Adjust line smoothing (in terms of number of days).
Change the lookback period used to calculate the different variations.
Display or not the different address types (for better visualization, Total Addresses should be shown alone).
Show or hide labels and configure their offset.
Lastly, you can modify all table parameters.

Market Activity Risk"Market Activity Risk" (MAR) - Is a dynamic tool designed to structurize the competitive landscape of blockchain transaction blocks, offering traders a strategic edge in anticipating market movements.
By capturing where market participants are actively buying and selling, the MAR indicator provides insights into areas of high competition, allowing traders to make informed decisions and potentially front-run transactions.
At the heart of this tool are blockchain transaction fees , they can represent daily shifts in transaction fee pressures.
By measuring momentum in fees, we can analyze the urgency and competition among traders to have their transactions processed first. This indicator is particularly good at revealing potential support or resistance zones, areas where traders are likely to defend their positions or increase their stakes, thus serving as critical junctures for strategic decision-making.
Key Features:
Adaptable Standard Deviation Settings: Users have the flexibility to adjust the length of the standard deviation and its multipliers, managing the risk bands to their individual risk tolerance.
Color-Coded Risk Levels: The MAR indicator employs an intuitive color scheme, making it easy to interpret the data at a glance.
Multi-Currency Compatibility: While designed with Bitcoin in mind, the MAR indicator is versatile, functioning effectively across various cryptocurrencies including Ethereum, XRP, and several other major altcoins. This broad compatibility ensures that traders across different market segments can leverage the insights provided by this tool.
Customizable Moving Average: The 730-day moving average setting is thoughtfully chosen to reflect the nuances of a typical cryptocurrency cycle, capturing long-term trends and fluctuations. However, recognizing the diverse needs and perspectives of traders, the indicator allows for the moving average period to be modified.
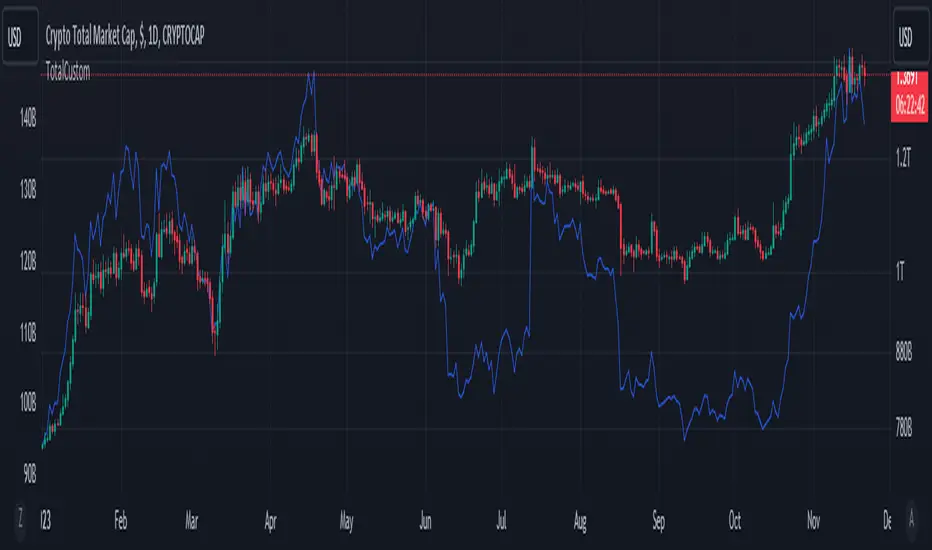
TotalCustomTotalCustom sums our custom altcoin list's market caps together.
Primarily used to compare to the following:
A. price of bitcoin
B. Total 1, Total 2, Total 3
Used in the following way:
When there is a large gap on fixed time frames (i.e. 3 month, 6 month, YTD) between this indicator and the main comparisons, it is generally considered a good time to buy.
Blockchain FundamentalThis indicator is made for traders to harness fundamental blockchain data for better decision-making. Unlike traditional tools, this indicator doesn't depend on standard technical indicators. It offers a novel perspective by focusing on core blockchain metrics like capitalization, miner activity, and other intrinsic data elements. I've designed a distinct scoring logic, exclusive to BF, ensuring it's user-friendly and provides actionable insights for traders at all levels.
Mainly created for Bitcoin , but can be applied to any other crypto assets in cost of losing some metrics in the analysis.
Ethereum chart:
Features:
Customizable Moving Averages:
Choose from an array of moving averages, with the flexibility to adjust the length for a tailored analysis, aiding in pinpointing asset trends.
Blockchain Metrics Integration:
Incorporates a range of blockchain metrics such as Market Cap to Realised Cap ratio, Spent Output Profit Ratio, ATH Drawdown, and more.
Blockchain Metrics Evaluation:
Each metric can be toggled on/off to customize the analysis. Using default settings, traders can use all of the metrics combined.
Every metric is essentially evaluated on a scale from -100 to 100 and then combined with others. If any metric is uncertain about its direction (equals to 0), then the score of it is not accounted in a final calculation.
Kalman Filter:
This indicator offers the option to apply a Kalman filter to the signals, enhancing the smoothness and accuracy of the indicator’s output. This is my approach to mitigate the noise in the final output.
Signal Oscillator:
Displays the aggregated score of all selected blockchain metrics.
Offers visual signals with adjustable upper and lower bounds for easy interpretation based on particular asset observation.
Visual Elements:
Signal Oscillator:
A visual representation of the aggregated blockchain fundamental score.
(White line for a raw calculation, orange line for kalman-filtered one)
Signal Counter:
Displays the count of metrics currently being considered in the fundamental score calculation. (grey line at the middle of an indicator)
Buy/Sell Signal Coloring:
The background color changes to indicate potential buying or selling opportunities based on user-defined bounds.
Usage:
Analysis:
Use the signal oscillator to identify potential market tops and bottoms based on blockchain fundamental data.
Adjust the bounds to customize the sensitivity of buy/sell signals.
Customization:
Enable/disable specific blockchain metrics to tailor the indicator to your analytical needs.
Adjust the moving average type and length for better analysis.
Integration:
Combine with other technical indicators to create a comprehensive trading strategy.
Utilize in conjunction with volume and price action analysis for enhanced decision-making. Every output could be used in traders custom strategies and indicators.

BTC Profitable Wallets StrategyBTC Profitable Wallets Strategy - plots the percentage of profitable BTC wallets and places long orders when the profitable wallet share crosses above 50%, historically a very accurate point to catch the next Bull Run early.
The only setting is a smoothing option using the Moving Average method and length of your choice.
On Chain Data is queried from IntoTheBlock.
This is a 'HODL' strategy, with no exit given. If you'd like to see the historical performance check the Open Profit or place a sell order at the current date.

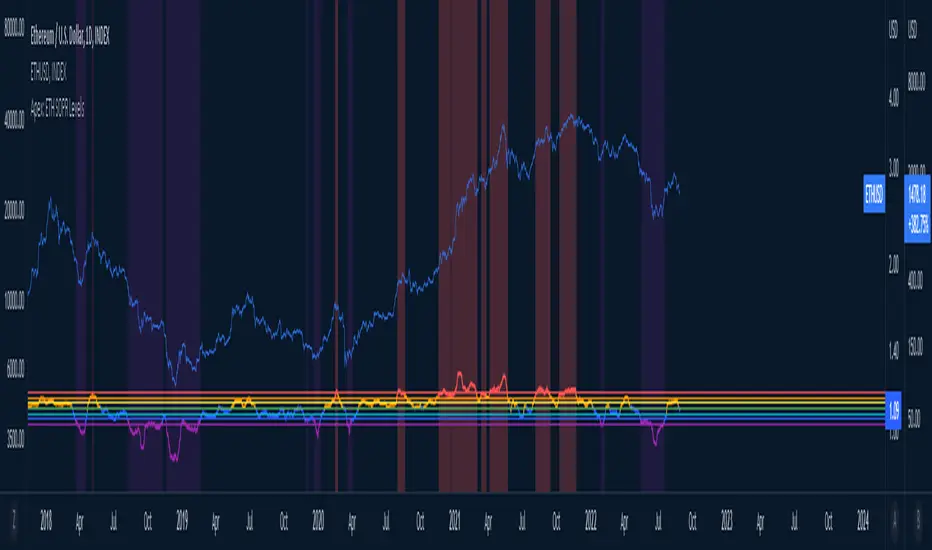
Apex ETH SOPR LevelsThe SOPR (Spent Output Profit Ratio) indicator provides insight into macro market sentiment, profitability, and losses taken over a specific time frame.
It reflects the degree of realized profit for all coins moved on-chain.
This indicator SOPR is for Ethereum only
Personal settings:
Control for the SOPR average for the long or short term (Minimum number is 7)
Control for colors of the SOPR average
Red = High: Greed
Purple = Low: Extreme fear
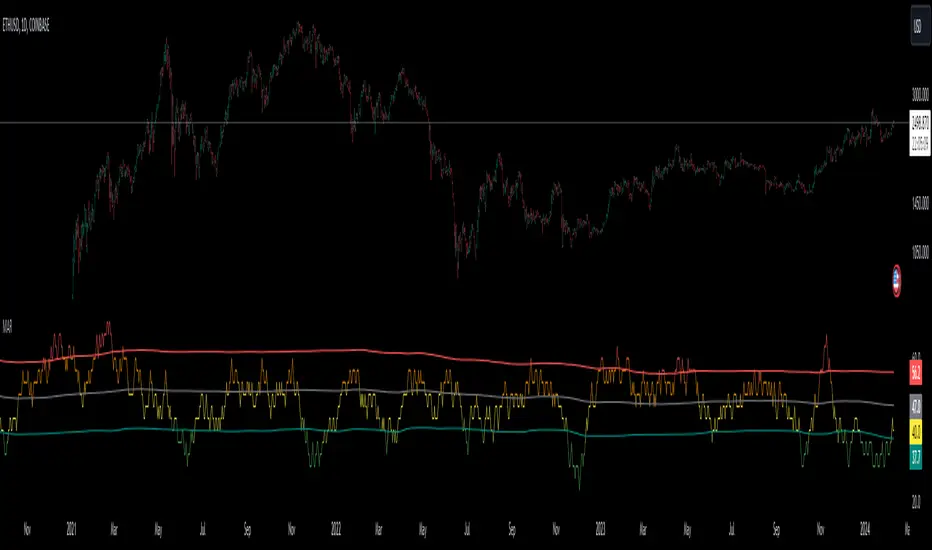
Blockchain Fundamentals - Active Address Sentiment Osc. [CR]Blockchain Fundamentals: Active Address Sentiment Oscillator AASO
Back with another script today, this one is a useful tool in helping to determine bitcoins value. We are looking at 2 data sources: the daily active addresses on the BTC blockchain, and the daily returns of BTC.
THIS INDICATOR WILL ONLY GIVE YOU THE CORRECT RESULTS ON THE DAILY TIMEFRAME
There is an interesting relationship that you can see by comparing the two timeseries. But for us to create a good indicator we first need to normalize the data. So we look at the percent change over the past 28 days for each metric (DAA and price).
THIS INDICATOR WILL ONLY GIVE YOU THE CORRECT RESULTS ON THE DAILY TIMEFRAME
We then calculate standard deviation bands around the DAA metric. We finalize them by averaging the bands over a 28 day period.
When the Price series (yellow line) is higher than the SD bands BTC is considered overvalued or price is overheated. A pullback could be expected soon. When the Price series is below the SD bands BTC is considered undervalued or price is oversold.
THIS INDICATOR WILL ONLY GIVE YOU THE CORRECT RESULTS ON THE DAILY TIMEFRAME
This tool doesnt give signals on the one minute chart or tell you exactly when to buy or sell. BUT what it does do is act as a convenient macro sentiment indicator that is not based completely upon price.
In an attempt to narrow down the really juicy areas, if you seen the background color highlights with white, that means its likely a top or bottom. At the very least on a local sense and many times in a cyclical macro sense as well. It also narrows down the signal to a generally more profitable area.
This indicator is not meant to be used on timeframes other than daily (did I mention that already?). I am lazy and did not code the calculations to be MTF (which is why you have to use on the daily chart). If you want to code this, please forward it on to me and I will post an update with a heartfelt credit to you.

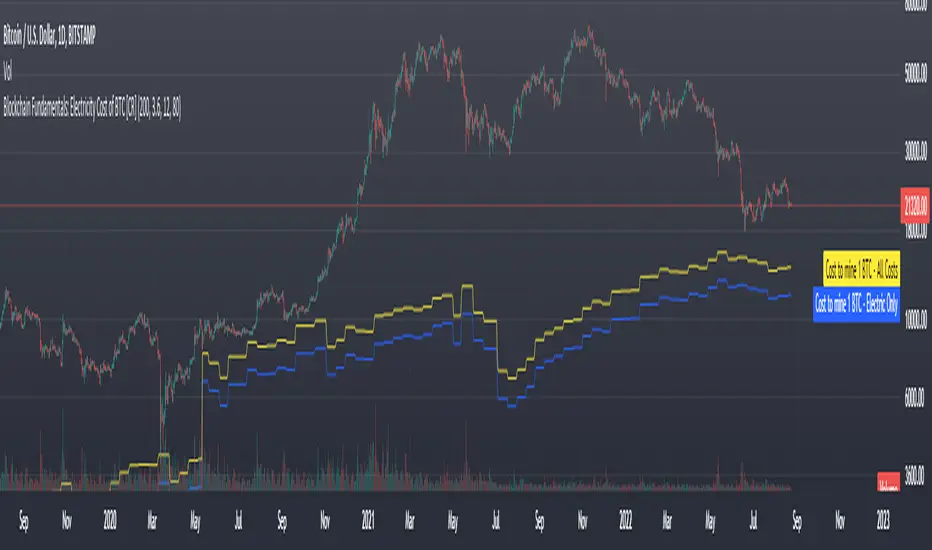
Blockchain Fundamentals: Electricity Cost of BTC [CR] Blockchain Fundamentals: Electricity Cost of BTC
After a hiatus, now a return to publishing tools and scripts for the community. This is my first script in over and year, and I have a number more coming soon as well! (so Stay Tuned!)
This is a simple calculator to estimate the cost of Bitcoin miners to mine one bitcoin. It works on all timeframes (doesnt have to be on daily).
By entering the inputs of total TH's, kWh used, cost of electricity per kWh (in USD cents) we can generate the electricity cost.
But miners also have other costs of operation including HVAC, maintenance, rent, etc. In light of that we include a multiplier that accounts for these extra costs. First, type in what percent of your total operating costs come from the electricity. Then check the enable total cost plot option and you will also see total costs in addition to electricity costs.
Its a simple model and gives anyone curious a starting point for their own testing and research.
Ethereum OnChain Data Indicator - The Quant ScienceEthereum On Chain Data Indicator - The Quant Science™ is a quantitative indicator created for mid-long term analysis.
The indicator uses quantitative statistics to recreate a model that represents the most important data from the on-chain analysis for the Ethereum blockchain.
The on-chain data used to create this model are:
1. Total weekly transactions
2. Total monthly transactions
3. Frequency of transactions per second on a daily scale
4. Frequency of transactions per second on a weekly scale
5. Amount of Ethereum burned on a daily scale
6. Amount of Ethereum burned on a weekly scale
7. Volume of short positions on a daily scale
8. Volume of short positions on a weekly scale
9. Volume of short positions more/less than average on a daily scale
10. Volume of short positions more/less than average on a weekly scale
All these data were extrapolated and manipulated using the mean and standard deviation.
The end result is a powerful tool that enables mid-long term investors and traders to analyze on-chain data through quantitative analysis.
FEATURES
The blue color area refers to the average change in data on a weekly scale. The light blue colored area indicates the monthly changes in the data. It is interesting to observe the correlation relationship between price and times when short-run data increases compared to long-run data and vice versa.
The more intense purple histograms refer to the standard deviation of the mean change in data on an annual scale. Histograms of less intense purple color refer to the standard deviation of the mean variation of data on a monthly scale. It is interesting to observe the ratio of the standard deviation between two different time periods.
This indicator can be used to perform statistical comparative analysis for manual and mid-long term investments. It can also be used to create auto trading strategies when used and integrated within an algorithm.
On-chain data are updated every 24 hours, so the timeframes to be used for analysis with this indicator are: D, 4H, 1H.

NVTNetwork Value to Transactions Ratio (NVT) is defined as the ratio of market capitalization divided by transacted volume.
NVT Ratio can be thought of as an indicator that measures whether the blockchain network is overvalued or not.
If it is upper than red line, it means overvalued.
NVT Golden Cross targets to generate short or long signals by comparing the short-term trend of NVT and the long-term trend of NVT. If the short-term trend is way greater than the long-term trend is, the network can be interpreted as overpriced and will soon revert to mean value, meaning short signal. Similarly, the opposite case may imply a long signal.
Over the red line is short signal and under the green line is long signal.
You can find divergence in this indicator.
There are two sources
cryptocap
glassnode

Bitcoin Blockchain ToolkitA toolkit of all kinds of bitcoin market data, but mostly on-chain data.
In the settings you can select which metrics to show.
Metrics included:
Index: the BXBT spot dollar index
Mcap: bitcoin market cap data calculated by Tradingview
Dominance: bitcoin dominance vs altcoins
Volatility: the Bitmex BVOL volatility tracker
Hashrate: the bitcoin hashrate in giga hashes per second
Difficulty: how difficult it is for miners to find a hash
Miner revenue: bitcoins mined per day + transaction fees * market price
Cost per transaction: miner revenue divided by number of transactions
Transaction volume: total value of transaction output per day
Total transactions: unique transactions per day
Transaction fees: total BTC value of transactions per day
Unique addresses: number of unique addresses used per day

Bitcoin Cost Per Transaction (QUANDL:BCHAIN/CPTRA)Simple script that graphically represents the Bitcoin Cost Per Transaction.
Blockchain data made available at QUANDL.
Its logic is simple, search the data in the QUANDL database and plot it on the chart.

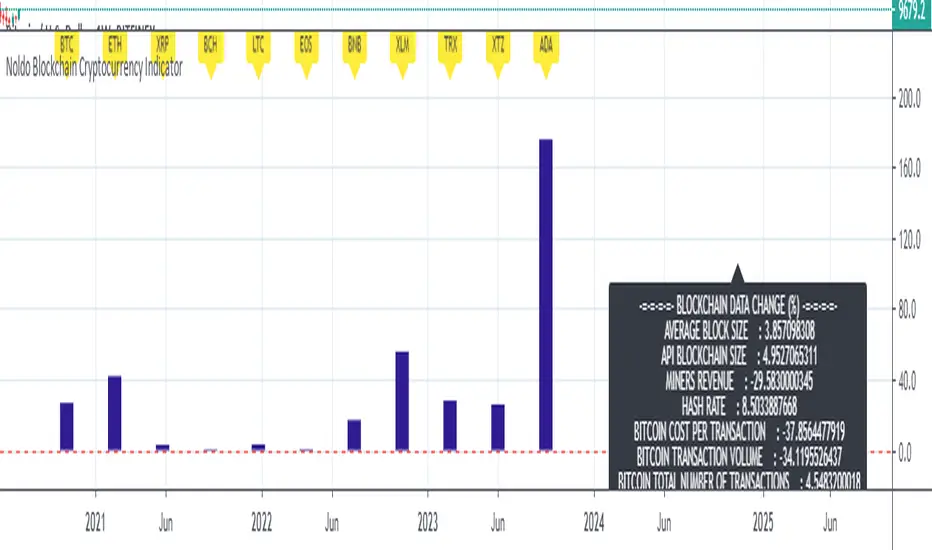
Noldo Blockchain Cryptocurrency Indicator
Hello, this script has the same logic as Noldo CFTC COT Forex Indicator :
And Noldo CFTC COT Commodities Indicator :
*
Script briefly calculates the period length between two signals of Pivot Reversal Strategy when new signal arrives and allows us to see relative Blockchain data and price changes of Major Cryptocurrencies over that automatic length.
This saves us from the hassle and time wasting of searching for a reference point.
Usage
This script works only on all Bitcoin / U.S Dollar pairs and futures.
It only works on 1W graphics.
ICOT data are pulled via Quandl
NOTE :
Since blockchain data is very votalile, 7-day ema values are adjusted to take into account.
Regards.
Bitcoin Block Height (Total Blocks)Bitcoin Block Height by RagingRocketBull 2020
Version 1.0
Differences between versions are listed below:
ver 1.0: compare QUANDL Difficulty vs Blockchain Difficulty sources, get total error estimate
ver 2.0: compare QUANDL Hash Rate vs Blockchain Hash Rate sources, get total error estimate
ver 3.0: Total Blocks estimate using different methods
--------------------------------
This indicator estimates Bitcoin Block Height (Total Blocks) using Difficulty and Hash Rate in the most accurate way possible, since
QUANDL doesn't provide a direct source for Bitcoin Block Height (neither QUANDL:BCHAIN, nor QUANDL:BITCOINWATCH/MINING).
Bitcoin Block Height can be used in other calculations, for instance, to estimate the next date of Bitcoin Halving.
Using this indicator I demonstrate:
- that QUANDL data is not accurate and differ from Blockchain source data (industry standard), but still can be used in calculations
- how to plot a series of data points from an external csv source and compare it with another source
- how to accurately estimate Bitcoin Block Height
Features:
- compare QUANDL Difficulty source (EOD, D1) with external Blockchain Difficulty csv source (EOD, D1, embedded)
- show/hide Quandl/Blockchain Difficulty curves
- show/hide Blockchain Difficulty candles
- show/hide differences (aqua vertical lines)
- show/hide time gaps (green vertical lines)
- count source differences within data range only or for the whole history
- multiply both sources by alpha to match before comparing
- floor/round both matched sources when comparing
- Blockchain Difficulty offset to align sequences, bars > 0
- count time gaps and missing bars (as result of time gaps)
WARNING:
- This indicator hits the max 1000 vars limit, adding more plots/vars/data points is not possible
- Both QUANDL/Blockchain provide daily EOD data and must be plotted on a daily D1 chart otherwise results will be incorrect
- current chart must not have any time gaps inside the range (time gaps outside the range don't affect the calculation). Time gaps check is provided.
Otherwise hardcoded Blockchain series will be shifted forward on gaps and the whole sequence become truncated at the end => data comparison/total blocks estimate will be incorrect
Examples of valid charts that can run this indicator: COINBASE:BTCUSD,D1 (has 8 time gaps, 34 missing bars outside the range), QUANDL:BCHAIN/DIFF,D1 (has no gaps)
Usage:
- Description of output plot values from left to right:
- c_shifted - 4x blockchain plotcandles ohlc, green/black (default na)
- diff - QUANDL Difficulty
- c_shifted - Blockchain Difficulty with offset
- QUANDL Difficulty multiplied by alpha and rounded
- Blockchain Difficulty multiplied by alpha and rounded
- is_different, bool - cur bar's source values are different (1) or not (0)
- count, number of differences
- bars, total number of bars/data points in the range
- QUANDL daily blocks
- Blockchain daily blocks
- QUANDL total blocks
- Blockchain total blocks
- total_error - difference between total_blocks estimated using both sources as of cur bar, blocks
- number_of_gaps - number of time gaps on a chart
- missing_bars - number of missing bars as result of time gaps on a chart
- Color coding:
- Blue - QUANDL data
- Red - Blockchain data
- Black - Is Different
- Aqua - number of differences
- Green - number of time gaps
- by default the indicator will show lots of vertical aqua lines, 138 differences, 928 bars, total error -370 blocks
- to compare the best match of the 2 sources shift Blockchain source 1 bar into the future by setting Blockchain Difficulty offset = 1, leave alpha = 0.01 =>
this results in no vertical aqua lines, 0 differences, total_error = 0 blocks
if you move the mouse inside the range some bars will show total_error = 1 blocks => total_error <= 1 blocks
- now uncheck Round Difficulty Values flag => some filled aqua areas, 218 differences.
- now set alpha = 1 (use raw source values) instead of 0.01 => lots of filled aqua areas, 871 differences.
although there are many differences this still doesn't affect the total_blocks estimate provided Difficulty offset = 1
Methodology:
To estimate Bitcoin Block Height we need 3 steps, each step has its own version:
- Step 1: Compare QUANDL Difficulty vs Blockchain Difficulty sources and estimate error based on differences
- Step 2: Compare QUANDL Hash Rate vs Blockchain Hash Rate sources and estimate error based on differences
- Step 3: Estimate Bitcoin Block Height (Total Blocks) using different methods in the most accurate way possible
QUANDL doesn't provide block time data, but we can calculate it using the Hash Rate approximation formula:
estimated Hash rate/sec H = 2^32 * D / T, where D - Difficulty, T - block time, sec
1. block time (T) can be derived from the formula, since we already know Difficulty (D) and Hash Rate (H) from QUANDL
2. using block time (T) we can estimate daily blocks as daily time / block time
3. block height (total blocks) = cumulative sum of daily blocks of all bars on the chart (that's why having no gaps is important)
Notes:
- This code uses Pinescript v3 compatibility framework
- hash rate is in THash/s, although QUANDL falsely states in description GHash/s! THash = 1000 GHash
- you can't read files, can only embed/hardcode raw data in script
- both QUANDL and Blockchain sources have no gaps
- QUANDL and Blockchain series are different in the following ways:
- all QUANDL data is already shifted 1 bar into the future, i.e. prev day's value is shown as cur day's value => Blockchain data must be shifted 1 bar forward to match
- all QUANDL diff data > 1 bn (10^12) are truncated and have last 1-2 digits as zeros, unlike Blockchain data => must multiply both values by 0.01 and floor/round the results
- QUANDL sometimes rounds, other times truncates those 1-2 last zero digits to get the 3rd last digit => must use both floor/round
- you can only shift sequences forward into the future (right), not back into the past (left) using positive offset => only Blockchain source can be shifted
- since total_blocks is already a cumulative sum of all prev values on each bar, total_error must be simple delta, can't be also int(cum()) or incremental
- all Blockchain values and total_error are na outside the range - move you mouse cursor on the last bar/inside the range to see them
TLDR, ver 1.0 Conclusion:
QUANDL/Blockchain Difficulty source differences don't affect total blocks estimate, total error <= 1 block with avg 150 blocks/day is negligible
Both QUANDL/Blockchain Difficulty sources are equally valid and can be used in calculations. QUANDL is a relatively good stand in for Blockchain industry standard data.
Links:
QUANDL difficulty source: www.quandl.com
QUANDL hash rate source: www.quandl.com
Blockchain difficulty source (export data as csv): www.blockchain.com
