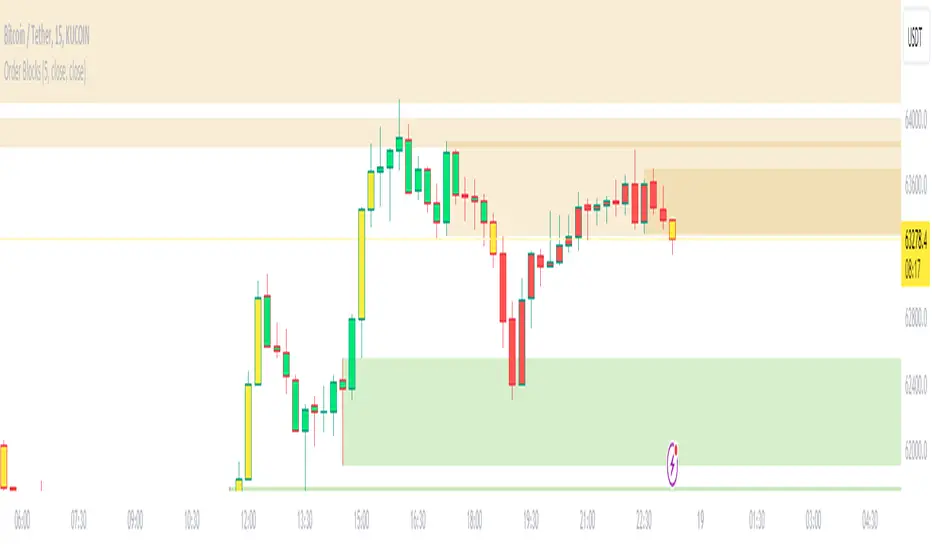
Order BlocksThis script analyses candle stick patterns and draws order blocks in real time, it is designed to be very easy to use and works on all markets.
With a simple sensitivity configuration to control the range of candles in scope for analysis, the order blocks are automatically drawn and removed in real time if price action closes through an order block.
Phân tích Đồ thị Nến
M.Right Candlestick Patterns & Bulkowski Percentages 1.0Hello Traders!
As a fan of Bulkowski, I figured I'd release this for everyone's benefit as well.
The legendary candlestick pattern expert, Thomas Bulkowski, has over 35 years of trading and analysis experience and is the absolute go-to expert when it comes to candlestick pattern identification.
Bulkowski Candlestick Percentages from his site and books.
Source: Built in "All Candlestick Patterns"
In this version,
--> Added 8 Candles and removed some that are statistically insignificant and others that Bulkowski doesn't use (can add back if requested).
--> Added 2 Colors for Bullish and Bearish Continuations.
----> Assigned Colors Tested performance to Continuations.
--> Built-in Variables and Candles adjusted slightly to conform to Bulkowski pattern principles.
--> Moved inputs back to ABC order.
--> Decided to leave the theoretical performance positioning for the signal (i.e. Top for theoretically bearish ). However..
----> I adjusted the signal color to match Bulkowski's tested performance.
--> Removed Plot Close (obsolete)
--> Hover over signal to see both Theoretical and Tested Performance.
Figured I'd help give an edge to the @TradingView Community like so many before me have been able to.
Please feel free to add comments, share insight, and of course, like!
Cheers,
Mike

Classic Candlestick on Range ChartHello traders!
This is my first script to share with everyone! As of right now the range candles on Tradingview are lacking the option to see range charts using the classic candlesticks. This script allows you to overlay a regular candlestick or heikin-ashi candlestick on a range chart!! Unfortunately, the only bar that cannot be a candlestick is the current bar. Once that bar has completed its range then it will update to a regular candlestick.
Install / Use instructions!
-For the best visual appearance it is important to set the transparency of up bars and down bars to 0. This setting is found in the main chart settings under SYMBOL. However, if you want to see the current unfinished range bar you need to set the "projection up bars" and "projection down bars" to the color you prefer.
-To change the colors of the candlesticks is found under the indicator settings like any other script!

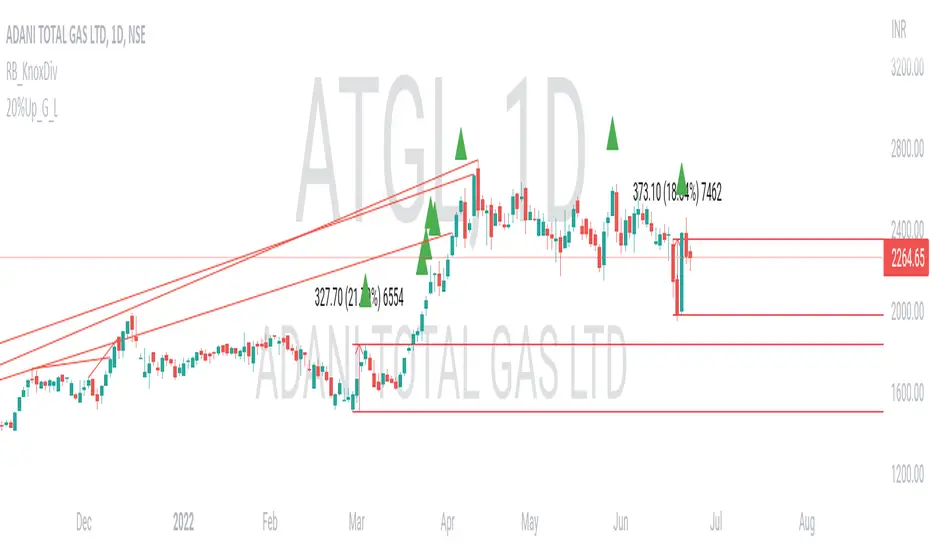
20% up with all continuously green candle: Lovevanshi It can be used to get the indication for 20% up movement among all continuously green candles formed in past. It is suitable for Indian company stock for short term trading plans.
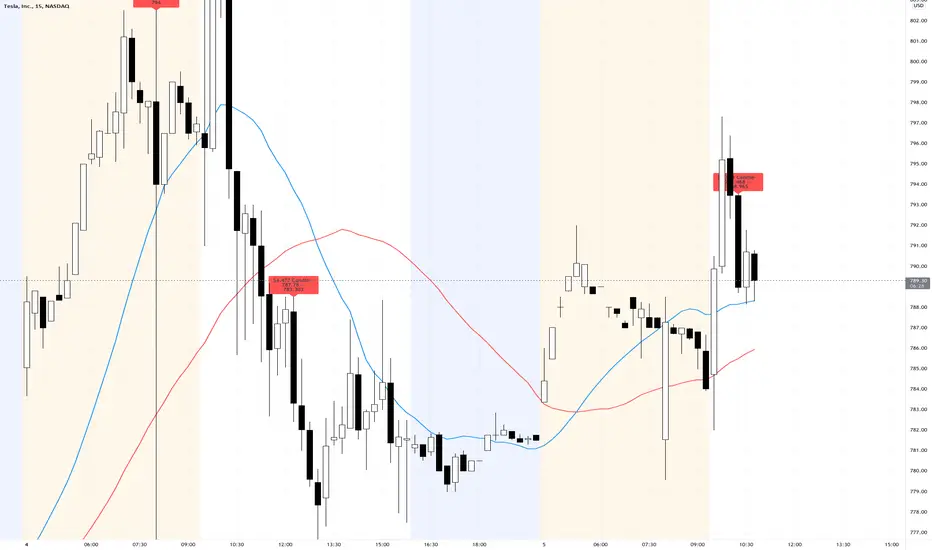
TSLA $4 Red CandleThose who trade TSLA often have come to know that a $4ish red candle on the 15min chart is normally a sign of a trend reversal to the downside by the market makers. To help identify these with ease this script will label any candles that close red with a $4.00 -> $4.99 price gap.
4 SMAs & Inside Bar (Colored)SMAs and Inside Bar strategy is very common as far as Technical analysis is concern. This script is a combination of 10-20-50-200 SMA and Inside Bar Candle Identification.
SMA Crossover:
4 SMAs (10, 20, 50 & 200) are combined here in one single indicator.
Crossover signal for Buy as "B" will be shown in the chart if SMA 10 is above 20 & 50 and SMA 20 is above 50.
Crossover signal for Sell as "S" will be shown in the chart if SMA 10 is below 20 & 50 and SMA 20 is below 50.
Inside Bar Identification:
This is to simply identify if there is a inside bar candle. The logic is very simple - High of the previous candle should be higher than current candle and low of the previous candle should be lower than the current candle.
If the previous candle is red, the following candle would be Yellow - which may give some bullish view in most of the cases but not always
If the previous candle is green, the following candle would be Black - which may give some bearish view in most of the cases but not always
Be Cautious when you see alternate yellow and black candle, it may give move on the both side
Please comment if you have any interesting ideas to improve this indicator.

Price Action: Inside Bar BoxesThis script automatically draws rectangles around bars inside IB pattern.
Note :: because Pinescript does not allow changes to already drawn charts on historical bars, checkbox "show only last box" doesn't work for arrows

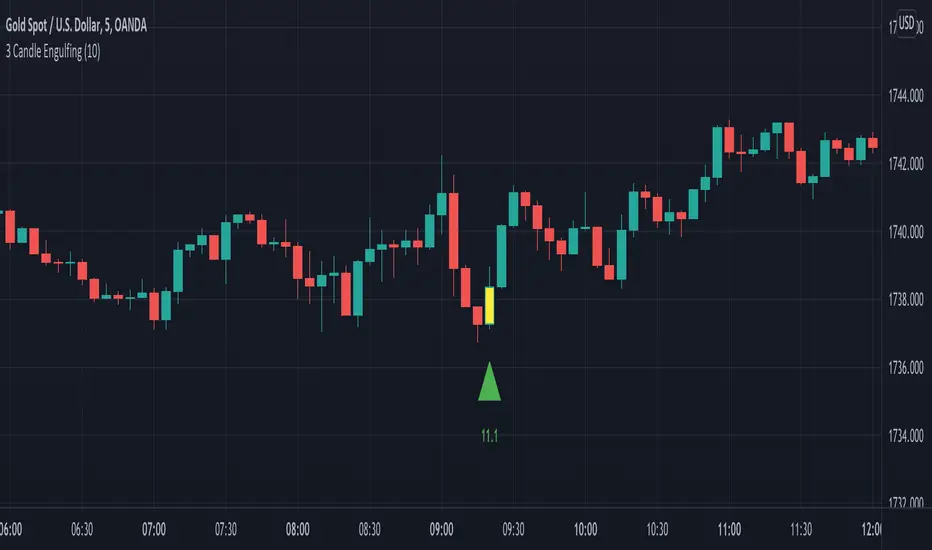
3 Candle EngulfingThree Line Strike Candlestick Pattern (3 candle Engulfing pattern) to help you detect sniper entry point mostly for (forex)
You can use this as an indicator to detect an entry point for your trade.
Please cross-check the Macro and Micro trend and don't go against the trend. Also use other indicators to confirm your entry.
You can set the engulfing minimum pips value (Default is set to 10 pips)
How it works:
Yellow candle with an up green triangle means a long entry
White candle with a down green triangle means a short entry
Special Time PeriodWith this indicator, you can choose candles in the period you want on your chart.
How ?
• If your chart is 5 minutes, the duration should be greater than 5 on this indicator.
If you do not do it this way, there will be gaps in the price, it will not give the right result.
• If you want to see it in minutes, you must enter a direct numerical value. For example, to see 2 hours, you must enter the number 120. Because 2 hours is 120 minutes.
Like the warning above, if you want to plot a 2-hour chart with this indicator, a maximum of 1 hour should be selected on your main chart.
• Resolution, eg. '60' - 60 minutes, 'D' - daily, 'W' - weekly, 'M' - monthly, '5D' - 5 days, '12M' - one year, '3M' - one quarter
• For example, if you want to see the 2-day chart, you should have a maximum of 1 day chart open on your home screen and write "2D" to the indicator value.
• You will get much better results if the period on your main chart and the period on this indicator are multiples of each other.
• In the image below, the period on the main chart is 30 minutes, but the period on the indicator is 90
• Click on the facing brackets at the top right of the legend and your chart will enlarge.

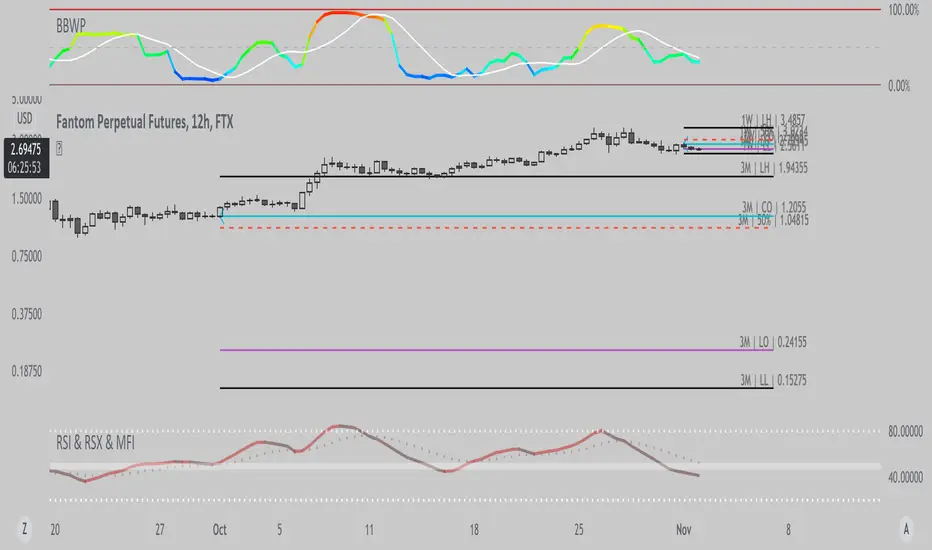
ROS [Range of Swag]Creates any multitimeframe level and marks opens, highs lows and midpoints
Comes with labels (hidable)
Works on Bar-by-bar replay
Customizable color!
The default 3 ranges are weekly, monthly, and quarterly in that order.
If you want to change the labels change it in the code... or just hide them.
Big thanks to @spacemanbtc @Kriswaters for the code (levels and session breaks) respectively.
Will be looking to improve it
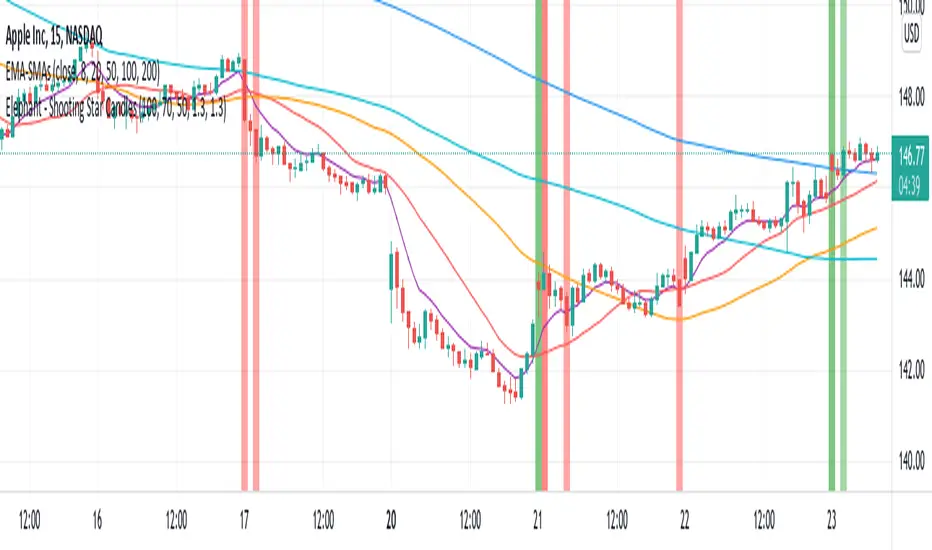
Elephant - Shooting Star CandlesThis script aims to show elephant and shootingstar candles. Body for elephant are at least 70% of the whole candle. Shootingstar have a body of 35% times the lenht of the full candle. Both are searched with 1.3 Standard Deviations as noise within 100 bars. Colors are ploted if closes above/below 200 SMA
15m Candle ToolShows historical 15min candles for the 1m, 3m , and 5m time frames.
Counts down the time until the current 5m, 15m, and 1H candles close.
Recommended use on the 1m, 3m , and 5m TimeFrames!!!
Legend:
Vertical Lines (Left to Right)
-15m Candle wick (solid line) *
-Close of current 5m candle (red dotted)
-Close of current 15m candle (blue dashed)
- Close of current 1H candle (green solid)
Horizontal Lines (Top to Bottom)
- Previous 15m high (top of wick) *
- Subdivisions of the low to high of the previous 15m candle (.25, .50, .75) (WHITE LINES, .50 is extended)
- inter candle average of the highs within the previous 15m candle (solid green)
- average of the inter candle highs and lows (grey dashed)
- inter candle average of the lows within the previous 15m candle (solid red)
- Previous 15m low (bottom of wick) *
Previous Candle Body *
* = Changes color based on the bar color.

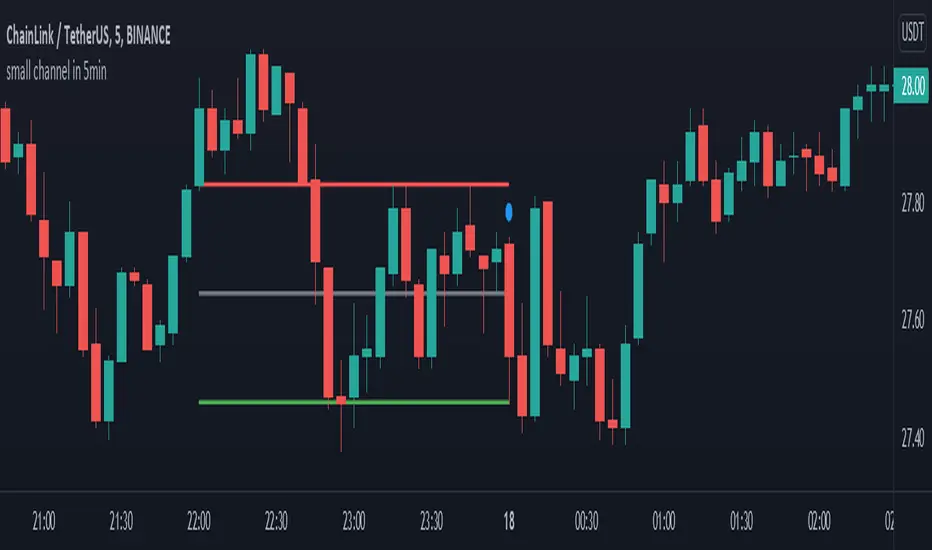
small channel in 5minThis indicator designed for 5min time-frame.
it detects a candlestick pattern in one hour time-frame and draw a channel based on the detected pattern, where two candles and are covered by the third one , in 5 min time-frame.
the bottom, middle and top of the channel are colored by green, gray and red respectively. this channel may help user to use it as a possible support and resistance region.
(the pattern is defined in line 11 to 13.)
enjoy it
Bar StatisticsThis script calculates and displays some bar statistics.
For the bar length statistics, it takes every length of upper or lower movements and calculates their average (with SD), median, and max. That way, you can see whether there is a bias in the market or not.
Eg.: If for 10 bars, the market moved 2 up, then 1 down, then 3 up, then 2 down, and 2 up, the average up bars length would be at 2.33, while the average for the down length would be at 1.5, showing that upper movements last longer than down movements.
For the range statistics, it takes the true range of each bar and calculates where the close of the bar is in relation to the true low of it. So if the closing of the bar is at 10.0, the low is at 9.0, and the high is at 10.2, the candle closed in the upper third of the bar. This process is calculated for every bar and for both closing prices and open prices. It is very useful to locate biasses, and they can you a better view of the market, since for most of the time a bar will open on an extreme and close on another extreme.
Eg.: Here on the DJI, we can see that for most of the time, a month opens at the lower third (near the low) and closes at the upper third (near the high). We can also see that it is very difficult for a month to open or close on the middle of the candle, showing how important the first and the last day are for determining the trend of the rest of the month.

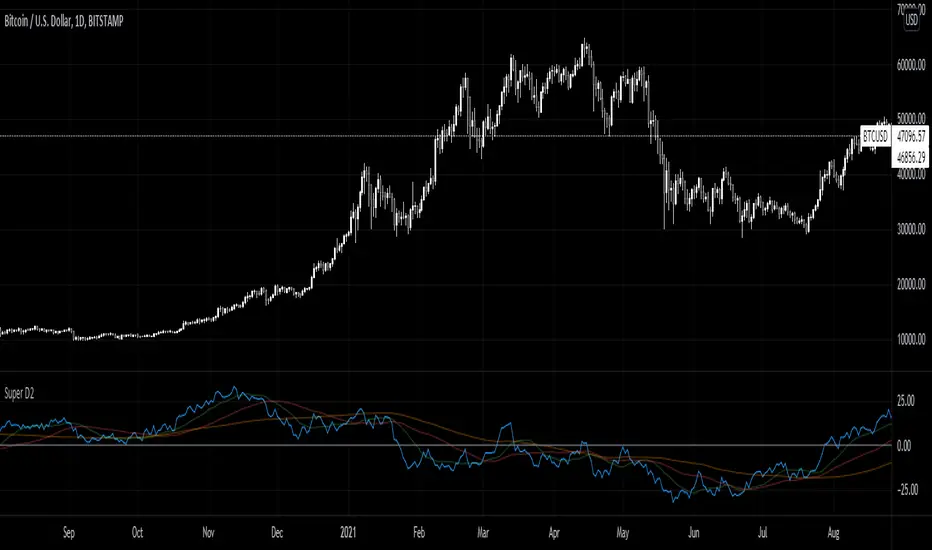
Super D2Momentum Indicator based on previous candle structure over past 40 periods
- Blue is momentum score
- Green = 15 ema
- Red = 50 sma
- orange = 100 sma
The indicator looks at the previous candles differences between open, close, high, and low to determine momentum. A high close relative to open or low indicates very strong momentum for example.
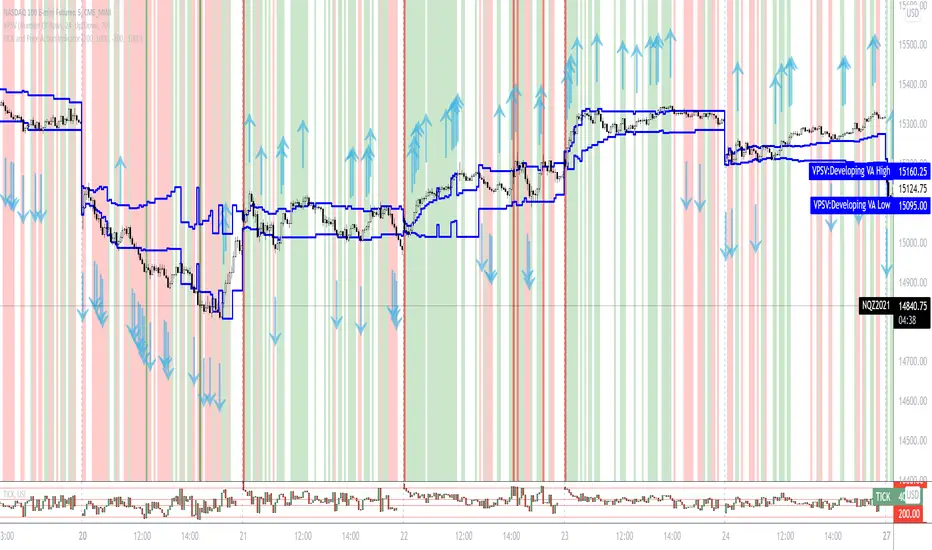
TICK and Price Action Indicator for NQ 5 minuteThis indicator for 5 minute NQ charts utilises TICK index and price action.
Where TICK opens beyond +1000/-1000 this is an overbought/oversold signal.
Similarly, when TICK closes below -200 it is a sell signal, and above +200 it is a buy signal.
This indicator colours the NQ bars based on the closing/opening values of the previous TICK.
It also draws arrows where price action (close above previous high, close below previous low) is in concordance with TICK behaviour.
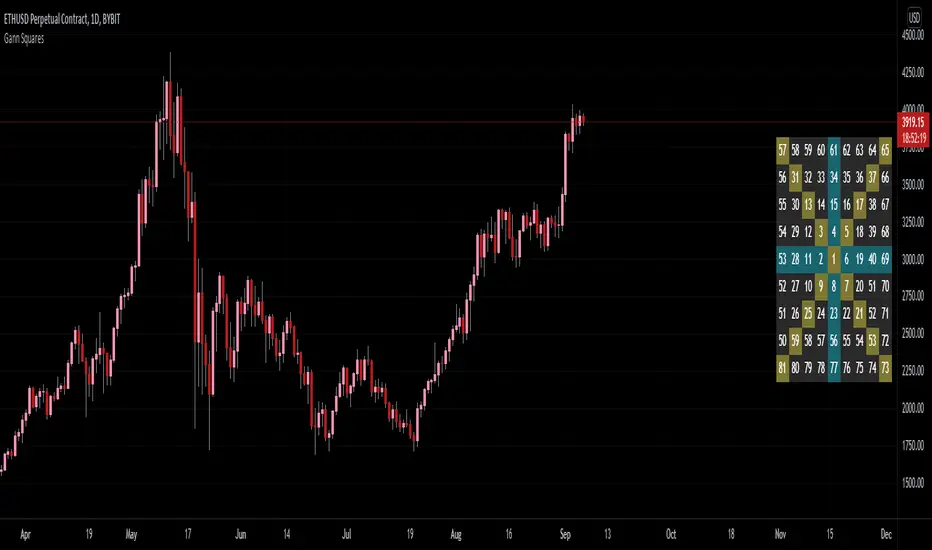
Gann Square of 9Gann's Square's are some of the best known tools created by Gann. His most well known square was his Square of 9.
The reason for this was because of the symmetry 9 had with itself. Gann was able to balance both price and time with this symmetry.
- 9 is the last single-digit and largest number
- You can add anything to 9 and it will give you a natural number
- (9 + 3 = 12); 1 + 2 = 3... (9 + 9 = 18); 1 + 8 = 9... etc.
- Multiplying any number by 9 will have the natural number be 9
- (9 * 6 = 54); 5 + 4 = 9... (9 * 3 = 27); 2 + 7 = 9... etc.
For these reason, Gann claimed that 9 has everything within itself.
Here I have created an on-chart square of 9 including the cardinal and ordinal cross points colored. In the settings you are able to customize the starting value of the table as well as the period movement. In most cases, 81 is not high enough to be useful in charting cases, so I'd recommend printing out your own Gann Square of 9 that goes as high as you need it to go.
THIS IS NOT TRADING ADVICE ; please use your own technical analysis before making any decisions based off of public indicators. Learn more about Gann's Squares before attempting to use them as this script was not meant to give you answers, only the table.
[CP]Pivot Boss Candlestick Scanner - No Repainting This indicator is based on the high probability candlestick patterns described in the ’Secrets of a Pivot Boss’ book.
The indicator does not suffer from repainting.
I have kept this indicator open source, so that you can take this indicator and design a complete trading system around it.
Although the patterns have some statistical edge in the markets, blindly using them as Buy/Sell Indicators will certainly result in a heavy loss.
I like some of these setups more than others, and I have listed them in the order of my likeness.
The first one I like the most, the last one, I like the least.
The patterns are universal and work well in both intraday, daily and even larger timeframes.
Signals in the example charts are manually marked by,
Hammer - profitable short signal
Rocket - profitable long signal
X - unprofitable long or short signal
GENERAL USER INPUTS:
These settings exist as the indicator uses ‘Labels’ to mark the patterns and Pine Script limits a maximum of 500 labels on a chart.
If you want to go back in the past and check how the indicator was doing, set the Start and End dates both and check the ’Use the date range above to mark the Candlestick Setups?’ option.
EXTREME REVERSAL SETUP:
This is by far my favorite setup in the lot. Classic Mean Reversion setup.
The logic, as explained in the book, goes like this,
1. The first bar of the pattern is about two times larger than the average size of the candles in the lookback period.
2. The body of the first bar of the pattern should encompass more than 50 percent of the bar’s total range, but usually not more than 85 percent.
3. The second bar of the pattern opposes the first.
The setup works extremely well in high beta stocks like Vedanta VEDL.
Feel free to play with the settings in order to better align this pattern with your favorite stock.
Check out the examples below,
No indicator is perfect, failed patterns are marked with an X.
OUTSIDE REVERSAL SETUP:
My second favorite setup, it is quite good at catching intraday trends.
Here’s the logic,
1. The engulfing bar of a bullish outside reversal setup has a low that is below the prior bar’s low and a close that is above the prior bar’s high. Reverse the conditions for bearish outside reversal.
2. The engulfing bar is usually 5 to 25 percent larger than the size of the average bar in the lookback period.
Settings for this pattern simply reflect these conditions. Feel free to modify them as you wish.
The pattern is pretty powerful and will sometimes help you catch literally all the highs and lows of the market, as shown in the examples of Vedanta VEDL and RELIANCE stocks below.
As usual, this pattern is not PERFECT either.
DOJI REVERSAL SETUP:
Doji candles signify market indecision and this pattern tries to profit off these market conditions.
Logic:
1. The open and close price of the doji should fall within 10 percent of each other, as measured by the total range of the candlestick.
2. For a bullish doji, the high of the doji candlestick should be below the ten-period simple moving average. Vice-versa for bearish.
3. For a bullish doji setup, one of the two bars following the doji must close above the high of the doji. Vice-versa for bearish.
Feel free to modify the settings and optimize according to the stock you are trading.
Don't optimize too much :)
This pattern works brilliantly well on larger intraday timeframes, like 15m/30m/60m.
This pattern also has a higher propensity to give false indications than the two described above.
Doji reversal typically helps to catch larger trend reversals. Check out the examples below from RELIANCE and NIFTY charts,
Note that the RELIANCE chart below is the same as shown for the Outside Reversal Setup above, notice the confluence of Outside
Reversal and Doji Reversal on the 31st August.
Confluence of patterns usually increases the probability of success.
RELIANCE 15m Chart - Pattern can catch nice trends on higher timeframes
NIFTY 15m Chart
WICK REVERSAL SETUP:
This pattern tries to capture candlesticks with large wick sizes, as they often indicate trend reversal when coupled with significant support and resistance levels.
Logic:
1. The body is used to determine the size of the reversal wick. A wick that is between 2.5 to 3.5 times larger than the size of the body is ideal.
2. For a bullish reversal wick to exist, the close of the bar should fall within the top 35 percent of the overall range of the candle.
3. For a bearish reversal wick to exist, the close of the bar should fall within the bottom 35 percent of the overall range of the candle.
This pattern must always be coupled with important support resistance levels, else there will be a lot of false signals.
The chart below is the same NIFTY chart as above with the Wick Reversal candles marked as well.
You can see that there are a lot of false signals, but the price also indicates ’pausing’ at important levels by printing a wick reversal setup.
You can use this information to your advantage when riding a trend.
FINAL WORDS:
Settings for various patterns simply reflect the logic described.
You will probably need to tweak and optimize the pattern settings for the stock that you are trading.
Higher Beta/Higher Volatility stocks are a great choice for these patterns.
Using these patterns at critical support and resistance levels will result in dramatically high accuracy.
Be creative and try to develop a proper system around this indicator, with rules for position sizing, stop loss etc.
You do not have to trade all the patterns. Even trading just one pattern with a proper system is good enough.
DO NOT USE THIS INDICATOR AS A BUY/SELL SYSTEM, YOU WILL LOSE MONEY.
Feel free to drop any feedback in the comments section below, or if you have any unique candlestick patterns that you would like me to code.

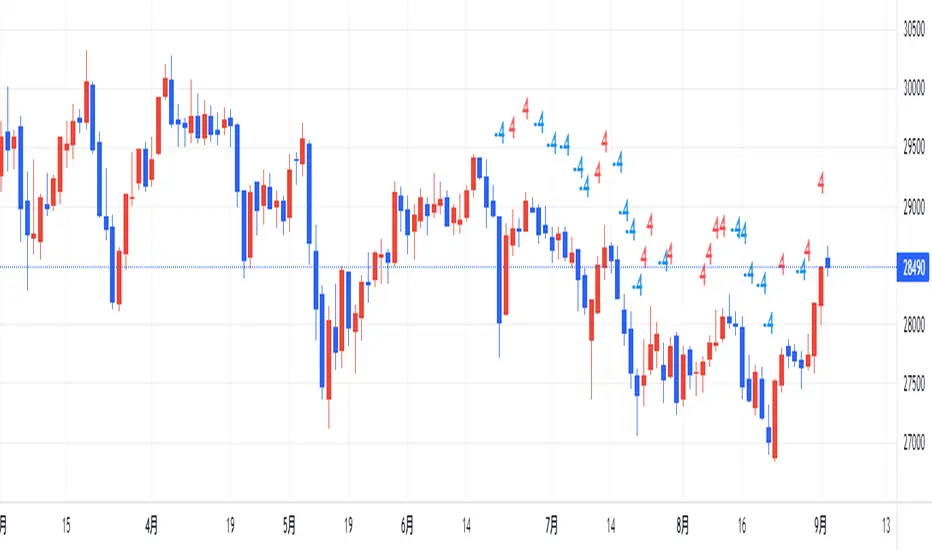
counting(kojiro koshi's idea)This is an indicator that expresses the strength of a candlestick in numbers.
The criteria are as follows
Candlestick is bullish:+1,bearish:-1,(If the value is more than twice the ATR, the score is 2 and -2, respectively.)
Close is higher than the previous value: +1, lower: -1
High is higher than the previous value: +1, lower: -1
Low is higher than the previous value: +1, lower: -1
gap up: +1, gap down: -1
This Display only if the total number of points is greater or less than 4.
小次郎講師のカウンティングの内、4以上と―4以下を表示してみました。
(-3~+3は重要ではないのと、多過ぎて見づらいため)
陽線 +1, 陰線 -1、大陽線+2、大陰線-2
終値・高値・安値は上昇で+1・下降で-1です
大陽線・大陰線・窓開けの基準は私のオリジナルです。
大陽線・大陰線の基準をATRの2倍、窓開けはATRの50%以上にしてみました。
トレビューの仕様で54本しか表示できませんが、
5行目のinputの数字を変えてもらうと54の数字分左に移動できます。
個人的には1~10を代入したインジケーターを表示したりして、
過去チャートに表示できるようにしてプラクティスに使用してます。
是非、感想と間違いの御指摘をお願いします。(素人なので)
MTF WatchList Charts [Anan]█ OVERVIEW
I am happy to present this script with a nice idea!
You can now customize a watchlist with your preferred time frame and any symbol from any market.
The main purpose is to be aware of any moves and watch a brief overview of the chart.
█ FEATURES
- 8 customizable symbols with the option to show/hide anyone
- Multi time frame support
- 3 Types of charts (Candles / Heikin Ashi / Line)
- Displaying up to 10 candles for every chart
- Customizable chart colors
- Option to Show/hide Price
- Option to Show/hide Price Line
- Option to change Labels and Text Size
- Show Symbol name and used time frame
- Option to change gaps between charts
- Hover over on the top of any candle to see (Open/High/Low/Close) Prices
█ SCREENSHOTS
-----------------------------------------------
Special thanks to @dgtrd for inspiration and for the amazing framework used here ( HTF Candles by DGT )
Special thanks to Pine Chat @fareidzulkifli @Bjorgum @JohnBaron @fpainchaud

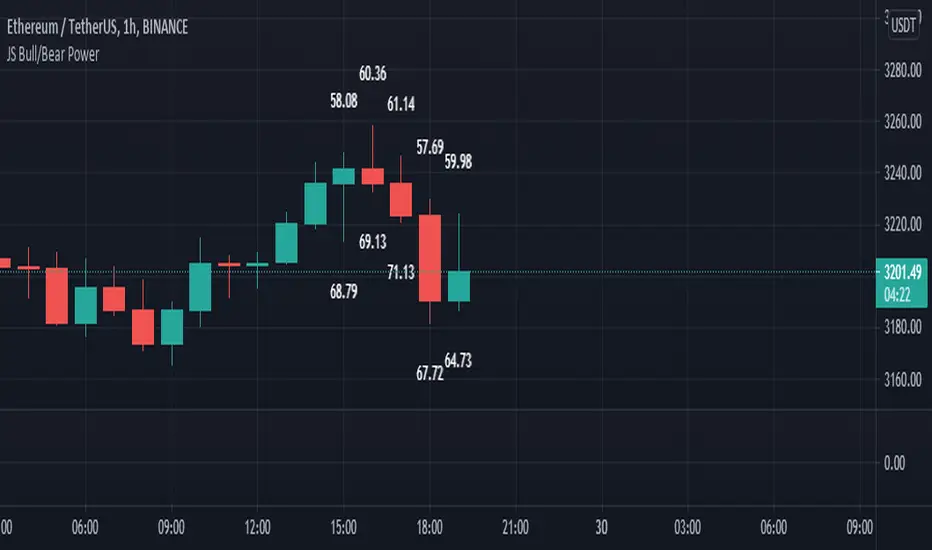
JS Bull/Bear PowerI created this Indicator for all chart lovers.
This Indicator measures the wick parts of candles and sum it up. Wick part of candle is a sign of strength that's why it measures the 60 bars of candles wick. then sum it up and converted it in percentage. The output is indicated in the last 10 candles. that's how simple this indicator is but very useful to analyze the strength of every candles.
The upper numbers is the bear power.
The lower numbers is the bull power.
Happy Trading
MTF Candlestick Patterns Screening [tanayroy]This script displays all candle patterns found in multi-time frames for a given lookback period. Candle pattern screening logic is taken from TradingView’s built-in script. The script works with 5m, 15m, 30m, 1HR, 2HR, 4HR, D, W, M timeframe. Works best with 5m chart.
Options available for trend detection, lookback period, and selecting candle pattern.
Please like, comment, and follow.

Ehlers Instantaneous Phase Dominant Cycle [CC]The Instantaneous Phase Dominant Cycle was created by John Ehlers (Stocks & Commodities V. 18:3 (16-27)) and this is one of many similar indicators that I will be publishing from Ehlers in the next few months that calculate the current dominant cycle period. The cycle period can be used in multiple ways but generally this means that if the stock is currently at a low then the current cycle period will tell you when the next lowest low will get hit or vice versa. This is also useful for using this cycle period as an input for other indicators to provide a very good adaptive length. Let me know how you wind up using these indicators in your daily trading. I have included the same buy and sell signals from my recent Hilbert Transform and so buy when the line turns green and sell when it turns red.
Let me know if there are any other indicators you would like to see me publish!
