MA MTF Momentum HistogramMy own interpretation indicator which i call multi time frame moving averages momentum with NO LAG EMA support (Optional).
The indicator is calculated by subtracting the long-term EMA from the short-term EMA .
This pretty much resembles the MACD moving averages calculation but without the smoothing of the histogram.
Can also be used to find divergences.
The background shows the main trend with higher time frame which can be set in the settings.
Aimed to use with Higher time frame (Double or more) but can also work with lower time frame.
How to use the indicator?
==Histogram==
Green: Momentum of asset is positive and increasing.
Lighter Green: Momentum of asset is still positive but decreasing and can revert to negative momentum.
Red: Momentum of asset is negative and increasing.
Lighter Red: Momentum of asset is still negative but increasing and revert to positive momentum.
==Background Color - Main Trend==
Green: HTF (Higher time frame) momentum is positive.
RED: HTF momentum is negative.
Feel free to comment and Follow to stay updated with upcoming scripts: www.tradingview.com
NOTE: BARS ARE COLORED BY DEFAULT WITH HISTOGRAM COLORS! (Can be changed in settings)
Phân kỳ

CSRS v2Candlesticked RSI v2 for price action traders!
See the True Momentum.
6 chart type, smooth RSI , add signal lines, find divergences, special alerts
This is 2nd version with major upgrade
Improved and more powerful
fully customizable.
features:
See RSI in 6 type of chart(Candles, Hollow Candles, Siwi Candles, Heikin Ashi, HL Bar, Line)
Monitor Up to 3 RSI , each one at desired resolution, source and length
Smooth each one of chart separately to remove noises
Add up to 3 signal line to primary chart in your desired source and type( SMA , EMA , WMA , HMA )
Find divergences which has special parameters
Gradient color adjustment of line chart
Add alert for reaching to important levels and detected divergences

ArcTan Oscillator [LuxAlgo]The following indicator is a normalized oscillator making use of the arc tangent sigmoid function (ArcTan), this allows to "squarify" the output result, thus visually filtering out certain variations originally in the oscillator. The magnitude of this effect can be controlled by the user. The indicator contains a gradient that shows the possibility of a reversal, with red colors indicating that a reversal might occur.
Settings
Length : Period of the oscillator
Pre-Gain : Changes the amplitude of the oscillator before passing through the ArcTan function, this allows to amplify/reduce the "squarification" effect introduced by this function. In order to make it easier for the user, the setting is in a (-10,10) range, with negative values reducing the amplitude and positive one increasing it.
Src : Source input of the indicator
Usage
The oscillator can be used to determine the direction of the trend by looking at its sign, if the oscillator is positive, market is up-trending, else down-trending, based on this usage the user might not be interested to look at every variations produced by the oscillator, this is where the hyperbolic tangent function and pre-gain setting can be useful, by using an high value of pre-gain the user will be able to only focus on the sign of the oscillator.
Here pre-gain is set to 5, we can see that the oscillator is now easier to visualize. However, the use of sigmoid functions remove useful information for a trader that needs to find divergences, this is where using a negative value of the pre-gain setting will result useful.
Here pre-gain is set to -5.
The indicator makes use of a gradient to show potential reversals, this gradient is determined by the correlation between the oscillator and the price (this is a way to measure potential divergences). If the color is closer to red it means that a potential reversal might occur, it is possible to say in which direction price might go by looking at the sign of the oscillator, so if the gradient is red and the oscillator is negative price might rise. The gradient is not affected by the pre-gain setting.

Divergence Indicator (any oscillator)A modification of the TV builtin "Divergence indicator" (Version 10) that can be applied to any indicator, and can be plotted on price as well.
Usage:
Add your favorite oscillator, RSI, Klinger, TSI, CMF, or anything else to a chart.
Click the little ... (More) on the oscillator.
Then add this indicator "Divergence Indicator (any oscillator)" on your oscillator of choice.
Click the settings on this indicator and make sure the source is set to the right plot from your oscillator.
Watch for it to plot divergences...
Add this indicator a second time on the price chart (and select the same oscillator plot), but check the box "plot on price (rather than on indicator)""
See you divergence plotted on price (as well as on the oscillator)

MESA Adaptive Moving Average - MTF and Divergence analysisThe latest iteration of the MESA Adaptive Moving Average - rewritten to make use of Pinescript v4 Arrays.
Explanation of settings and example use cases:
Fast Limit: Lower values will reduce the reactivity of the MA to rapid price changes.
- For instance, if you want to ignore price spikes on a low timeframe, then reduce Fast Limit
Slow Limit: Lower values will reduce the reactivity of the MA to slow price changes.
- For instance, if you want the MA to ignore small retracements during a trend, then reduce Slow Limit
Show MESA for next higher timeframe: Display the MA of the next standard timeframe that TV offers.
- Displays 3min if the chart timeframe is 1min. Displays D if the chart timeframe is 4H. Does not work with custom timeframes.
Show MESA for custom higher timeframe: Display a secondary MESA plot with a custom timeframe, selectable via the Custom Timeframe drop-down. Overrides the previous setting, if enabled. This functionality is experimental since it provides a higher sample rate than would normally be available. Take precautions making entries using only Custom Timeframe MESA.
- For instance, you made a decision on the 4H chart using MESA and are now watching the 15min to time a trade entry. Enable and select "4H" from the drop-down menu
Show Divergence between MESA Timeframes: Since divergence can differ greatly between assets, we form a baseline by continuously tracking the difference between the chart MA and higher timeframe MA. We note the maximum divergence in each direction (bullish and bearish). A white circle is plotted when divergence is close to the historical maximum. When a record-breaking divergence occurs, a yellow circle is plotted. You can tweak these indications by adjusting the Divergence Threshold %
- Multi-timeframe divergence is typically a weak indication of trend exhaustion, especially if Volume is not present.
Show Divergence between Source & MESA: Again, divergence can differ greatly between assets. This time, we form a baseline by continuously tracking the difference between the chart MA and Source (usually Close). We note the maximum divergence in each direction (bullish and bearish). A purple triangle is plotted when divergence is close to the historical maximum. When a record-breaking divergence occurs, a lime-green triangle is plotted. You can tweak these indications by adjusting the Divergence Threshold %
- Price divergence is a strong indicator of over-extension. It works well for timing reversals on intraday timeframes.
Source: The input data to perform MESA calculations on.
I've really enjoyed trading with this indicator, especially when combined with my previous two tools:
Empirical Suite : factors Trend, Price momentum, Volume, and Volatility
Squeeze Zone : provides a visual representation of volatility squeezes and attempts to predict breakout directions
Use this indicator to get a sense of overall trend, from any chart timeframe, as well as indications of over-extensions and exhaustion.

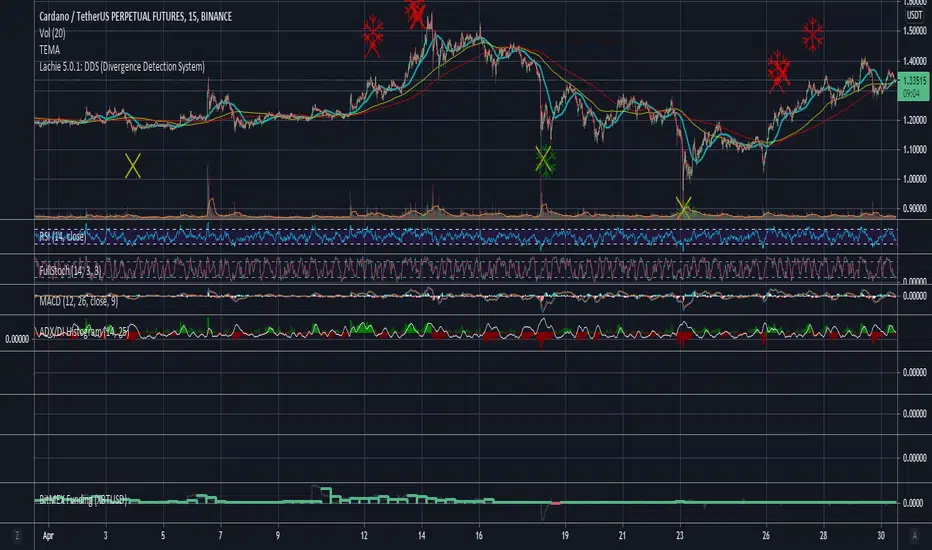
Lachie 5.0.1.2: DDS (Divergence Detection System)Introduction:
The purpose of this indicator is to assist users in detecting bullish and bearish divergence. This is purely for educational purposes and should only be used as an indicator to invest further time in TA.
This indicator is a further release of my previous indicator Lachie 3.0: DDS (Divergence Detection System).
How to interpret:
When a unique event occurs in the market the logic of the code will trigger:
-Bullish Divergence: Yellow X = divergence detected/forming, Orange X = strong confirmation, Green snow flake = targets end of divergence (fails sometimes)
-Bearish Divergence: Red X = Divergence detected/forming, Red snow flake = attempts to hit end of divergence/peaks
The chart may draw several characters in one location usually adding to the strength of the divergence.
What should I do when a character is painted on my chart:
As this is an educational indicator, I can only recommend that once a character(s) is drawn you should pay further attention to the currency/stock (do further Technical Analysis ). Treat this indicator as a hunting dog, looking for areas for you to investigate. You don’t give your dog the gun so please do not link it to automation and get tilted when something doesn’t go quite your way.
What time frames is this indicator best on:
This indicator was designed on a 1 hour chart. However, it does perform quite well on the daily, 4 and 6 hour charts. Its performance is reduced on 15 and 5 min since previous release (Lachie 3.0: DDS (Divergence Detection System)).
FAQ:
Should I Buy/Long when I see a bullish indicators?
I will not recommend any purchases without first proper TA. Majority of the time the indicator will correctly fin the bottom however in extreme down trends the code will display fake characters. Upon proper TA you will see how these are fake, but if you rely on a signal, you may get caught out.
Should I Sell/Short when I see a bearish indicators?
Only on 125x leve..... nope, please use this for educational purposes until full versions is released.
I am getting too many characters on my chart?
Although this was worked on heavily since previous release you may still encounter numerous characters in one place, for now this is quite normal and can happen when:
-High strength divergence.
-In a down trend occasionally the logic cannot correct interpret the weakness in the market.
Is this indicator applicable to any market?
Yes, although the indicator was developed based on Crypto Currency markets, the indicator is usable and in most instances more accurate on traditional markets.
Will there be future updates released?
As the code ages and further development is made, updates including increase accuracy for automation and signals may be released. This is really released for educational support. These updates may be released under a separate indicator listing.
This is an earlier derivative of current indicator with bullish and bearish divergence with higher accuracy (signal) script.
For access (vendor requirement):
Please contact me via private message on Trading View.
Images of Indicator:
Previous versions:
Lachie 3.0: DDS (Divergence Detection System)
Created and owned by Lachlan Schahinger. (2019)
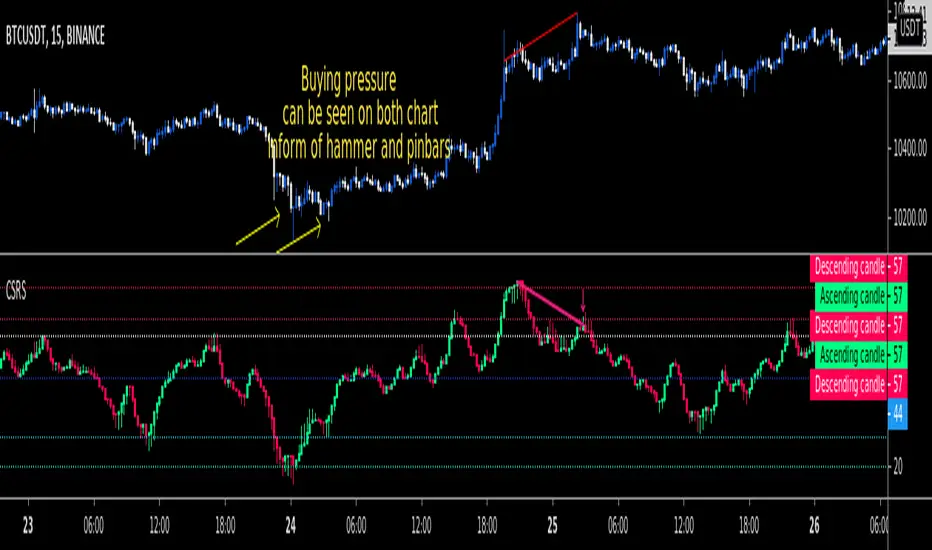
CSRSCandlesticked RSI for price action traders!
See the True Momentum.
You can smooth RSI to remove noises and also find divergences.
fully customizable.
GLANTALL AT A DEEP GLANCE
Monitor the whole market at a glance
Give your analysis double-dimensional depth
With the help of this assistant , you can quickly aware about the various dimensions of the market and improve the quality of your trading experience.
Everything is clear in the picture so I will avoid further explanation.
All functions are controllable and highly customizable
Get instantly and accurate report of
Volume
Volume changes
Volume is higher or lower than average
Volume significant increase
2 oscillators of your choice, each one at 4 time frame of your choice, at the same time (Stoch, RSI, StochRSI, MFI, StochMFI)
Selected oscillators changes and direction
Selected oscillators divergences with full coordinate
Bollinger bands
Bollinger bands middle line changes
Bollinger bands width changes and direction
Amount of volatility
4 moving averages as type as your choice at a same time (SMA, EMA, WMA, HMA)
Mark up the moving averages as dynamic support or resistance
Crosses of the 4 averages as type as your choice at a same time (SMA, EMA, WMA, HMA) (completely separately than above mentined MAs) with full coordinate
More than 500 line code.. but Clean and Clear !
Gifts to all of you dear ones.

Price Divergence AccumulatePrice divergence is a good indicator to detect a trend change.
But only check the divergence value is not enough, the time range of how long the trend continues also needs to be measured.
This indicator accumulated Price Divergence until it turns from plus to minus or minus to plus.
From this Accumulated Price Divergence
1. The upper-level (long term) trend should be supported by the lower-level (short term) trend.
if the peaks of the lower-level trend become lower and lower, it is indicating the upper-level trend might get an adjustment.
2. At the beginning of the upper-level trend
The 1st lower-level trend peak might exceed the upper-level trend. But often we see it will be corrected and 2nd lower-level trend will be underneath the upper-level trend.

[Max] Volume Entropy Divergence FilteredAn indicator that represent in 3 line my Volume Entropy Divergence Heatmap indicator.
I've use a very basic sum with some weights like this : Long therm > Mid therm > short Therm, But short and mid therm can still have influence.
Some people did request this indicator to be able to use the heatmap in there indicators with the new tradingview link function. There still a problem that will be the subject of a future update, when the divergence is to high it's often mean that instead of a divergence, we have a continuation or a parabolic.
This indicator still also need a location checker to try to don't short the bottom.
There is 3 lines, 2 are the sum of the negative/positive divergences.
The third one is the result off a karman volatility filter, with differents weigths for each line off the heatmap, it can easily used to find reversals.
You have some options to play with the volatility filter, the defaults settings are the ones I think is the best.
This script will still private for the same reasons raised in the original heatmap.
My policy : If you can provide me nice updates, I will give you the source code, if within 3 month I don't use it anymore it will pass in public.
If you have any improvement idears I will be please to ear them.
Have a nice day !
Max

Divergence+ [MS]Divergence indicator for any asset and any time frame that shows bullish and bearish regular (dotted) and hidden (dashed) divergences.
Simple to use, just add to your chart and select the size of divergences you want to see.
Scalping? Use a lower number.
Swing trading? Use a higher number.
Set alerts on when divergences appear.
Settings
• Set the divergence size
• Show hidden divergences
• Show signals with divergences
Use the link below or PM us to obtain access to this indicator.

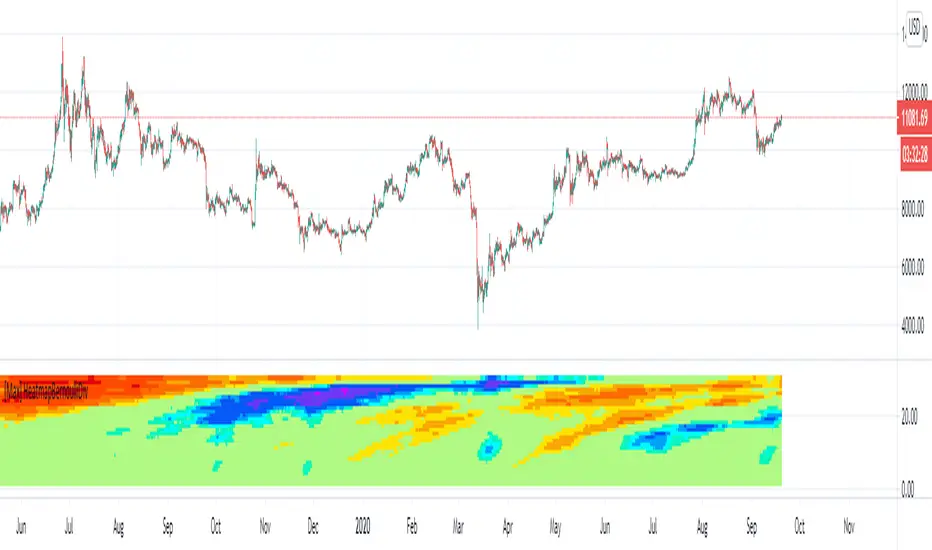
[Max] Volume Entropy Divergence HeatmapA divergence between volume and price indicator, based on custom filter function.
Each lines represent a length on wich the divergence is calculated. It goes to 60 len a the base to 2000 at the high. ( You have to decrease the timeframe if your looking on a new chart).
Colors represent a level of the oscillator who is calculated for each lengths.
What can you find, reversals, confirmation of continuation, divergences between volume and price,.. (if you find other usages I will be happy to hear it and share the code).
I recommand to be attentive to lower timeframes and confirm with higher ones and be attentive between different kind of clouds there is.
You are in charge to figure out how to use it, if you have some doubts on something you can DM me but I will not teach my way to use it.
It provide for me nice transformations, nice enough to share this indicator in private.
Big thanks to @midtownsk8rguy for the heatmap color function.
Have a nice daytrading all !
VWAP OscillatorToday I'm proposing a simple VWAP oscillator script to trade buy and sell waves more easily.
You trade this similar to how you trade Awesome Oscillator, so if you want an explanation just look up YT videos.
In addition to that, this will also show volume squeezes, please note that this is a makeshift way and not real volume squeeze phenomena of volume profile and tape. None the less, it is quite good at allowing you to ride out good trending waves and locate weak price action due to volume squeeze. You can turn off bar coloring from settings if you don't want this.
For ease of reading, I've also applied Allenstars Dynamic zones on this indicator so you can easily locate where the reading is entering in long and where it is in sell, this is compared to selected sample size. I've already selected the most common setting for that, so you don't really need to fiddle with it unless you find something better.
This indicator can be used to trade divergences as well, in fact, I feel it is better for that compared to RSI/MACD, the usual suspects.
Past performance is not assurance of future performance and this idea is published for only educational purposes, author taken no responsibility for your profit or loss.
Neglected Volume by DGTVolume is one piece of information that is often neglected, however, learning to interpret volume brings many advantages and could be of tremendous help when it comes to analyzing the markets. In addition to technicians, fundamental investors also take notice of the numbers of shares traded for a given security.
What is Volume?
The volume represents all the recorded trades for a security that occurs in a given time interval. It is a measurement of the participation, enthusiasm, and interest in a given security. Think of volume as the force that drives the market. Volume substantiates, energizes, and empowers price. When volume increases, it confirms price direction; when volume decreases, it contradicts price direction.
In theory, increases in volume generally precede significant price movements. However, If the price is rising in an uptrend but the volume is reducing or unchanged, it may show that there’s little interest in the security, and the price may reverse.
A high volume usually indicates more interest in the security and the presence of institutional traders. However, a rapidly rising price in an uptrend accompanied by a huge volume may be a sign of exhaustion.
Traders usually look for breaks of support and resistance to enter positions. When security break critical levels without volume, you should consider the breakout suspect and prime for a reversal off the highs/lows
Volume spikes are often the result of news-driven events. Volume spike will often lead to sharp reversals since the moves are unsustainable due to the imbalance of supply and demand
note : there’s no centralized exchange where trades are recorded, so the volume data represents what happens at a particular exchange only
In most charting platforms, the volume indicator is presented as color-coded bars, green if the security closes up and red if the security closed lower, where the height of the bars show the amount of the recorded trades
Within this study, Relative Volume , Volume Weighted Bars and Volume Moving Average are presented, where Relative Volume relates current trading volume to past trading volume over long period, Volume Weighted Bars presents price bars colored based on short period past trading volume average, and Volume Moving Average is average of volume over shot period
Relative Volume is presented as color-coded bars similar to regular Volume indicator but uses four color codes instead two. Notable increases of volume are presented in green and red while average values with back and gray, hence adding ability to emphasis notable increases in the volume. It is kind of a like a radar for how "in-play" a security is. Users are allowed to change the threshold, default value is set to Fibonacci golden ration standard deviation away from its moving average.
Volume Weighted Bars, a study of Kıvanç Özbilgiç, aims to present if price movements are supported by Volume. Volume Weighted Bars are calculated based on shot period volume moving average which will reflect more recent changes in volume. Price actions with high volume will be displayed with darker colors, average volume values will remain as they are and low volume values will be indicated with lighter colors.
Volume Moving Average, Is short period volume moving average, aims to display visually the volume changes. Please not that Relative Volume bars are calculated based on standard deviation of long volume moving average.
What Else?
Apart from the volume itself, your ability to assess what volume is telling you in conjunction with price action can be a key factor in your ability to turn a profit in the market. It makes little sense to analyze the volume alone. To correctly interpret the volume data, it shall be seen in the light of what the price is doing. there are a lot of other indicators that are based on the volume data as well as price action. Analysing those volume indicators has always helped traders and investors to better understand what is happening in the market.
Here are the ones adapted with this study. Some of them used as a source for our aim, some adapted as they are with slight changes to fit visually to this study and please note that the numerical presentation may differ from their regular use
• On Balance Volume
• Divergence Indicator
• Correlation Coefficient
• Chaikin Money Flow
Shortly;
On Balance Volume
The On Balance Volume indicator, is a technical analysis indicator that relates volume flow to changes in a security’s price. It uses a cumulative total of positive and negative trading volume to predict the direction of price. The OBV is a volume-based momentum oscillator, so it is a leading indicator — it changes direction before the price
Granville, creator of OBV, proposed the theory that changes in volume precede price movements in a measurable way. He believed that volume was the main force behind major market moves and thought of OBV’s prediction of price changes as a compressed spring that expands rapidly when released.
It is believed that the OBV shows the interactions between the institutional and retail traders in the market
If the price makes a new high, the OBV should also make a new high. If the OBV makes a lower high when the price makes a higher high, there’s a classical bearish divergence — indicating that only the retail traders are buying. Another type of bearish divergence occurs when the price remains relatively quiet and fails to make a higher high but the OBV soars higher than the previous high — indicating that the institutional traders are accumulating short positions. On the other hand, if the price makes a lower low and the OBV makes a higher low, there is a classical bullish divergence, showing that the institutional traders don’t believe in that move
With this study, Momentum and Acceleration (optional) of OBV is calculated and presented, where momentum is most commonly referred to as a rate and measures the acceleration of the price and/or volume of a security. It is also referred to as a technical analysis indicator and oscillator that is able to determine market trends.
Additionally, smoothing functionality with Least Squares Method is added
Divergences especially, should always be noted as a possible reversal in the current trend, so the divergence indicator is adapted with this study where the Momentum of OBV is assumed as Oscillator with similar usages as to RSI. Divergence is most often used to track and analyze the momentum in an asset’s price and the odds of a price reversal within the current trend. The divergence indicator warns traders and technical analysts of changes in a price/volume trend, oftentimes that it is weakening or changing direction.
Correlation Coefficient
The correlation coefficient is a statistical measure of the strength of the relationship between the relative movements of two variables. A correlation of -1.0 shows a perfect negative correlation, while a correlation of 1.0 shows a perfect positive correlation. A correlation of 0.0 shows no linear relationship between the movement of the two variables. In other words, the closer the Correlation Coefficient is to 1.0, indicates the instruments will move up and down together as it is mostly expected with volume and price. So the Correlation Coefficient Indicator aims to display when the price and volume (on balance volume) is in correlation and when not. With this study blue represent positive correlation while orange negative correlation. The strength of the correlation is determined by the width of the bands, to emphasis the effect horizontal lines are drawn with values set to 0.5 and -0.5. the values above 0.5 (or below -0.5) shows stronger correlation.
Chaikin Money Flow , provide optionally as a companion indicator
The Chaikin money flow indicator (CMF) is a volume indicator that measures the money flow volume over a chosen period. The money flow volume is a measure of the volume and where the price closed relative to the trading session’s range. It comes from the idea that buying pressure is indicated by a rising volume and recurrent closes in the upper part of the session’s price range while selling pressure is demonstrated by an increasing volume and repeated closes in the lower part of the price range.
Both buying and selling pressures are accompanied by an increase in volume, but the location of the closing prices are in accordance with the direction of price
Special thanks to @InvestCHK and @hjsjshs , who have enormously contributed while preparing this study
related studies:
Disclaimer:
Trading success is all about following your trading strategy and the indicators should fit within your trading strategy, and not to be traded upon solely
The script is for informational and educational purposes only. Use of the script does not constitute professional and/or financial advice. You alone have the sole responsibility of evaluating the script output and risks associated with the use of the script. In exchange for using the script, you agree not to hold dgtrd TradingView user liable for any possible claim for damages arising from any decision you make based on use of the script

Divergence shortterm swing daytrading I've added a few lines to Mawreez' RSI Divergence Detector.
I edited the visual and filtered the signals in same direction of the current candle.
this indicator shows long and short signals based on divergences. It's better not to trade against powerful trend.

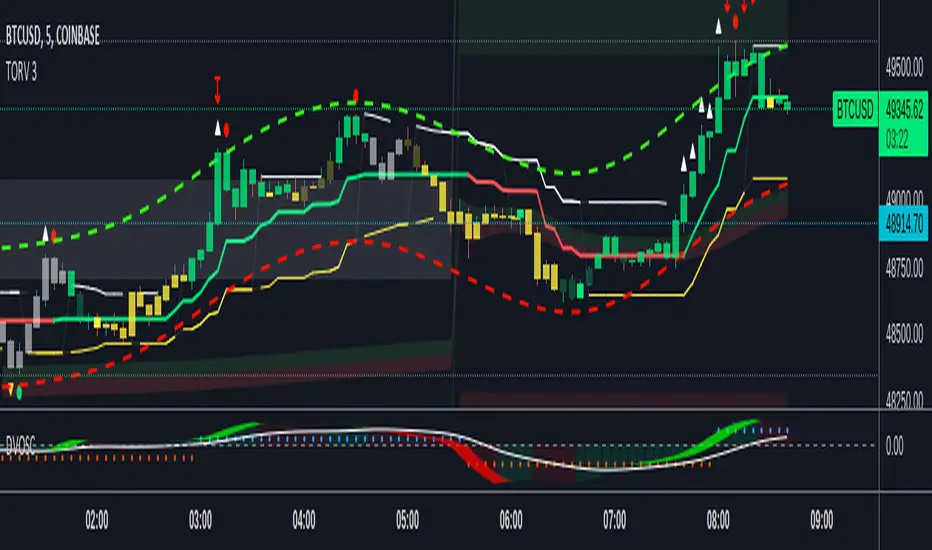
Patreon Bull Bear OscillatorThe Patreon bull-bear oscillator (PBBO) was carefully designed to give as much information as possible to the user without sacrificing readability. With it, you can detect the direction of trends, detect whether the market is ranging or trending, tell if a given signal is false, and easily spot divergences, in fact, the PBBO is the only indicator of the trend trading tier that was designed to spot potential reversals.
The indicator comes with alerts.
Settings
Length: Control the sensitivity to price variations, with a higher value aiming to detect longer-term trends.
Control Line Divisor: Divisor of the control line
Src: Source input of the indicator
Pre-Smoothing: If true, smooth "Src" before calculating the PBBO
Smooth: Period of the moving average used for pre-smoothing
Pre-Smoothing Method: Determine the type of moving average to be used during the pre-smoothing step. Available options are: EMA, TMA (triangular moving average), HULL, LSMA (least squares moving average)
Filter Alerts Based On The Control Line: Add an additional condition for the alerts.
Detecting The Direction Of A Trend
The indicator display three lines, one bull line (in blue), one bear line (in red), and a control line (in green). A bullish market is detected when the bull line is over the bear line, while a bearish market is detected when the bear line is over the bull line.
When one of the lines is declining, it means that the current trend is weakening, showing the potential for a retracement or reversal.
Filter Out False Signals With The Control Line
The PBBO is still subject to all the price variations you will see on your chart, and as such can return false signals, it is important to tell if a bullish/bearish market is significant before making a move, and this is what the control line aims to do.
The control line divisor can provide a way to control the position of the control line, with lower values of the divisor requiring even more significant moves in order to trigger a signal. A value of 2 for the control line divisor is recommended in order to filter out false signals.
Detecting Whether Market Is Trending Or Ranging
Telling when the market is trending is primordial in trend trading, and many indicators that aim to return this information have been proposed. The PBBO is also able to give such information. First, you can look at the bull and bear lines, if both are equal to 0, it means the market is ranging.
You can also use the control line to tell whether the market is trending or not, with a bull/bear line above the control line telling the market is trending.
Spotting Divergences With The PBBO
Spotting divergences is a simple way to detect potential reversals, and it was important for me to start working on an indicator able to detect them while trying to make everything super simple for the user.
With the PBBO you don't need to look at both the price and oscillator lines in order to detect divergences, you can simply look at the peaks made by the bull or bear line, if a peak is lower than a previous one, then a reversal might occur.
Above, we can see that the bull line made several peaks during the up-trend, with the last peak being lower than the previous one, we thus detect a bearish divergence and could expect a reversal. If the same case scenario occur but with peaks made by the bearish line then we detected a bullish divergence.
It can be difficult to tell whether a divergence is significant or not, it can also be hard for beginners to tell which peaks they must look at. A good rule of thumb would be to check if both peaks are coming from two different movements, this is done by seeing if the first peak has reached 0 before the second one occurred.
The control line is also useful to tell when peaks are significant or not, with peaks that are higher than the control line being more significant.
Alerts
By default, a buy alert is given once the bull line is greater than the bear line, and vice versa for a sell alert, the setting "Filter Alerts Based On The Control Line" allows you to only have an alert when the bull/bear line is greater than the control line.
Gaining Access To The Indicator
Only my Patrons can get access to this indicator, you can go to my Patreon page by clicking on the link in my signature. Note that you will also have access to the Patreon trailing stop and Patreon moving average.

SRSI HLOCDecided to add some flare to my SRSI
Added a candle concept to RSI and thus gives you more context to what PA is doing. Same concepts apply as would a normal candle on a chart.
I also have a bollinger type band that should be used as such
Wicks near band extremes can be a sign of reversal.
i also changed the Kick Ass signals to fire with a little more frequency
ALSO PLEASE CHECK OFF THE BORDER IT WILL MAKE THE CANDLES MORE VISIBLE
DM how to get access

Toguro1000's CCI (Anti Fake-Divergence)TUTORIAL
1 - Look for divergence.
2 - Check the anti-fake div bar color. (White means you are good to go, colored means there is a high probability that the divergence will not play (fake divergence).

Multi Oscillator Divergence IndicatorTradingview Built-in Divergence Indicator with RSI is extended for Price Divergence with
- RSI
- MACD
- Sochastic
- Money Flow
- Demand Index
- Chaikin Money Flow
Thanks to tradingview for providing this unique indicator.

Ema-Weighted-GainStrategy Inputs: Capital=$10,000, Pyramiding=3, Default Quantity=1
Please note that the strategy buys when the WMA (Blue line) cross under zero and sell above it, your experience is very important in using this indicator. Do not follow the buy/sell signals. Read the plot as I explain in the Uses Section and make your own conclusion on how to use it.
Description,
This Strategy uses multiple Ema’s to calculate Weighted HPR's.
I have calculated the weight numbers based on Fibonacci.
Uses:
NOTE!! (Please Do not take those uses to be 100% Guaranteed. User your experience and judgment to decide your trade).
Zoom out to see all the arrows
White line (MA)
Blue line (WMA)
First
Ride Trends,
1-Downtrend: short
a-MA IS going down
b-Entry: WMA cross above or near the MA (White Arrows).
2-Uptrend:long
a-MA is going up
b-Entry: WMA goes below MA or Near it(Green Arrows).
Second
Trend Reversal
1-buy entry.
WMA at zero, or very close to it, in pullback (Yellow Arrows).
2-short entry
WMA at zero, or very close to it, in a bounce (Orange Arrows).
Third
Divergence as explained in the Red Arrows.
Conclusion,
Red Arrows= Divergence
Green Arrows= Buy entry (The stock is in uptrend)
Yellow Arrows= Buy entry (the stock is in downtrend and could reverse)
White arrows= short entry (the stock is in downtrend)
Orange arrows=short entry (the stock in uptrend and can reverse)
If you are interested, send a private message

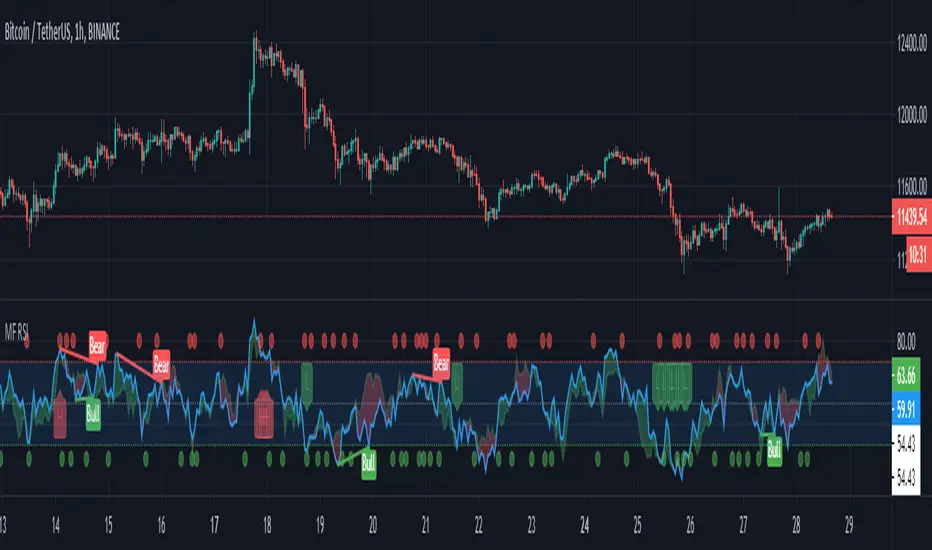
MF RSIUsing built-in code from Divergence Indicator I've created the MF RSI indicator.
A great way to combine two great indicators and divergence.
A alert condition is available on a potential reversal MFI crosses RSI on overbought or oversold.
MACD++ Strategy [SystemAlpha]This is a strategy based on MACD Oscillator. Instead of using just the normal crossovers, we use trend filters, trailing stop loss and take profit targets. This strategy was developed for crypto, forex and stocks on daily timeframe but feel free to experiment on 15 minutes or higher using heikin ashi or normal candles
In this strategy you have a choice of:
Trend Filters:
- Average Directional Index ( ADX ) – buy when price is trend is up and sell when trend is down.
- Moving Average (MA) – buy when price close above the defined moving average and sell when price close below moving average
- Parabolic SAR – buy when SAR is above price is above price and sell when SAR is below price.
- All - Use ADX , MA and SAR as filters
For MA Filter , you can use the “TF MA Type” and "TF MA Period" parameter to select Simple or Exponential Moving Average and length.
Stop Loss:
- Average True Range (ATR) – ATR % stop as trailing stop loss.
- Parabolic SAR ( SAR ) – Parabolic SAR adapted as trailing stop loss.
For ATR , you can use the “ATR Trailing Stop Multiplier” parameter to set an initial offset for trailing stop loss.
Take Profit Target:
- Average True Range (ATR) – ATR % stop as trailing stop loss.
- Standard % – Percent as target profit
For ATR , you can use the “ATR Take Profit Multiplier” parameter to set an initial offset for trailing stop loss.
Additional feature include:
- Regular and Hidden Divergence display and alerts
STRATEGY ONLY:
- Set back test date range
- Set trade direction - Long, Short or Both
- Use timed exit - Select method and bars
- Method 1: Exit after specified number of bars.
- Method 2: Exit after specified number of bars, ONLY if position is currently profitable.
- Method 3: Exit after specified number of bars, ONLY if position is currently losing.
TradingView Links:
Alerts:
MACD:
How to use:
1. Apply the script by browsing through Indicators --> Invite-Only scripts and select the indicator
2. Once loaded, click the gear (settings) button to select/adjust the parameters based on your preference.
3. Wait for the next BUY or SELL signal to enter the trade!
Disclaimer:
The indicator and signals generated do not constitute investment advice; are provided solely for informational purposes and therefore is not an offer to buy or sell a security; are not warranted to be correct, complete or accurate; and are subject to change without notice.

MACD+ Alerts [SystemAlpha]This is the alert companion of the MACD+ Strategy . Instead of using just the normal crossovers, we use trend filters, trailing stop loss and take profit targets. This strategy was developed for crypto, forex and stocks on daily timeframe but feel free to experiment on 15 minutes or higher using heikin ashi or normal candles.
In this alert you have a choice of:
Trend Filters:
- Average Directional Index ( ADX ) – buy when price is trend is up and sell when trend is down.
- Moving Average (MA) – buy when price close above the defined moving average and sell when price close below moving average
- Parabolic SAR – buy when SAR is above price is above price and sell when SAR is below price.
- All - Use ADX , MA and SAR as filters
For MA Filter , you can use the “TF MA Type” and "TF MA Period" parameter to select Simple or Exponential Moving Average and length.
Stop Loss:
- Average True Range (ATR) – ATR % stop as trailing stop loss.
- Parabolic SAR ( SAR ) – Parabolic SAR adapted as trailing stop loss.
For ATR , you can use the “ATR Trailing Stop Multiplier” parameter to set an initial offset for trailing stop loss.
Take Profit Target:
- Average True Range (ATR) – ATR % stop as trailing stop loss.
- Standard % – Percent as target profit
For ATR , you can use the “ATR Take Profit Multiplier” parameter to set an initial offset for trailing stop loss.
Additional feature include:
- Regular and Hidden Divergence display and alerts
Alerts:
When creating alerts use “Once Per Bar Close” parameter for Long and Short and “Once Per Bar” for Close, Trailing Stop, Take Profit and Divergence.
TradingView Links:
Strategy:
MACD:
How to use:
1. Apply the script by browsing through Indicators --> Invite-Only scripts and select the indicator
2. Once loaded, click the gear (settings) button to select/adjust the parameters based on your preference.
3. Wait for the next BUY or SELL signal to enter the trade!
Disclaimer:
The indicator and signals generated do not constitute investment advice; are provided solely for informational purposes and therefore is not an offer to buy or sell a security; are not warranted to be correct, complete or accurate; and are subject to change without notice.
