RSI [SystemAlpha]This is a RSI indicator enhanced with:
- Show Buy and Sell Alert
- Fill on oversold and overbought levels
- Show Regular and Hidden divergence
- Show Divergence Labels
- Generate Alerts: Buy/Sell and Divergence
Phân kỳ

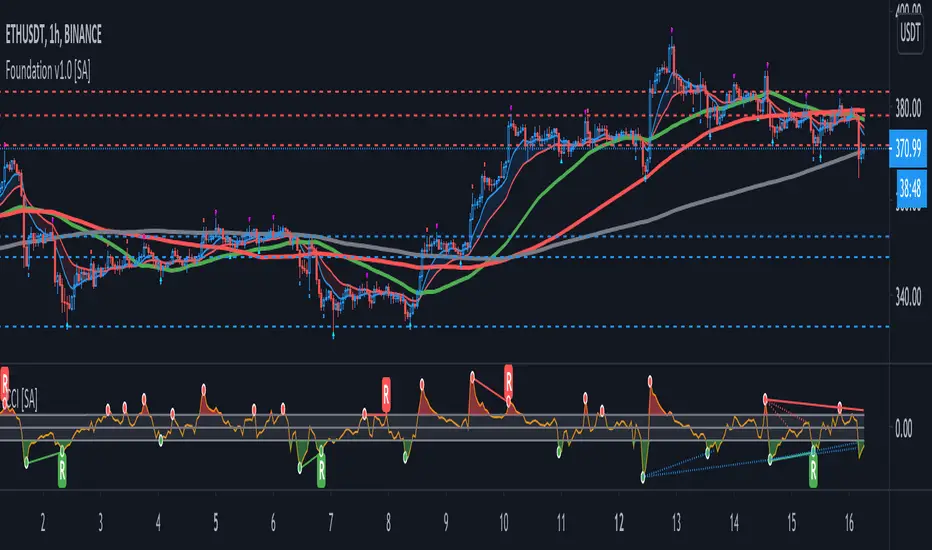
CCI [SystemAlpha]This is a CCI indicator enhanced with:
- Show Buy and Sell Alert
- Fill on oversold and overbought levels
- Show Regular and Hidden divergence
- Show Divergence Labels
- Generate Alerts: Buy/Sell and Divergence
MACD [SystemAlpha]This is MACD indicator enhanced with:
- Show MACD and Signal Only or Histogram Only or Both
- Show Buy and Sell Alert - MACD Cross
- Show Bar Color
- Show Regular and Hidden divergence
- Show Divergence Labels
- Generate Alerts: Buy/Sell and Divergence

HFT Divergence Hunter BacktesterDefault Settings are meant to be used in BTC /USDT chart on 5 min time frame on Binance Futures . If you want to use for another asset on another time frame YOU MUST CHANGE THE SETTINGS
This is a divergence finding strategy developed by HFT Research. It is a highly customizable strategy and provides endless opportunities to find profitable trades in the market.
Default Settings are meant to be used in BTC /USDT chart on 5 min time frame on Binance Futures . If you want to use for another asset on another time frame YOU MUST CHANGE THE SETTINGS
This is a divergence finding indicator developed by HFT Research. It is a highly customizable indicator and provides endless opportunities to find profitable trades in the market.
Use Envelope , this is the main decision maker in this strategy. The idea behind is that you choose the length of the moving average and set an offset % to create an upper and lower band. If you click on “display envelope” you will be able to visually see the band you have created. This way, you get to scalp the market as the price is diverging and moving away from the moving average. As the famous saying goes, moving averages act like magnets and prices always visits them back. Using this ideology, we aim to capitilize on the price swings that move away from the chosen moving average by x%.
STARC Bands ;
These are two bands that are applied above and below a simple moving average of an asset’s price. The upper band is created by adding the value of the average true range (ATR) or a multiple of i. The lower band is created by subtracting the value of the ATR from the SMA . The channel can provide traders with ideas on when to buy or sell. During an overall uptrend, buying near the lower band and selling near the top band is favorable. However, from our testing results it does fairly poorly in crypto markets while it does pretty well in traditional markets.
Use RSI ;
One of the most commonly used indicators in the trading world. The idea is simple, buy when its oversold and sell when its overbought. You can use RSI as a secondary confirmation of the dips. It can be turned on and off.
Use MFI
MFI stands for Money Flow Index and it is an oscillator like RSI . However, it does track the price in a different fashion than RSI providing a reliable option. It uses the price and volume data for identifying overbought and oversold signals in an asset.
Use Fisher Transform
Even though, it has a funny name, Fisher is actually a very decent and reliable indicator. It converts the prices into a Gaussian normal distribution channel. Therefore, the indicator detects when the prices have moved to an extreme, based on recent price action.
Use VWAP
VWAP stands for volume weighted average price . It is an extremely useful indicator when trading intra-day. It does reset every trading session which is at 00:00 UTC . Instead of looking at x number of candles and providing an average price, it will take into consideration the volume that’s traded at a certain price and weigh it accordingly. It will NOT give entry signals but act as a filter. If the price is above VWAP will filter out the shorts and other way around for longs.
Use ADX
Average directional index is a powerful indicator when one is assessing the strength of a trend as well as measuring the volatility in the market. Unfortunately, the worst market condition for this strategy is sideways market. ADX becomes a useful tool since it can detect trend. If the volatility is low and there is no real price movement, ADX will pick that up and will not let you get in trades during a sideways market. It will allow you to enter trades only when the market is trending.
Use Super trend Filter
The indicator works well in a trending market but can give false signals when a market is trading in a range.
It uses the ATR ( average true range ) as part of its calculation which takes into account the volatility of the market. The ATR is adjusted using the multiplier setting which determines how sensitive the indicator is.
Use MA Filter
Lookback: It is an option to look back x number of candles to validate the price crossing. If the market is choppy and the price keeps crossing up and down the moving average you have chosen, it will generate a lot of “noisy” signals. This option allows you to confirm the cross by selecting how many candles the price needs to stay above or below the moving average. Setting it 0 will turn it off.
MA Filter Type: There is a selection of moving averages that is available on TradingView currently. You can choose from 14 different moving average types to detect the trend as accurate as possible.
Filter Length: You can select the length of your moving average. Most commonly used length being 50,100 and 200.
Filter Type: This is our propriety smoothing method in order to make the moving averages lag less and influence the way they are calculated slightly. Type 1 being the normal calculation and type 2 being the secret sauce .
Reverse MA Filter: This option allows you to use the moving average in reverse. For example, the strategy will go long when the price is above the moving average. However, if you use the reserve MA Filter, you will go short when the price is above the moving average. This method works best in sideways market where price usually retraces back to the moving average. So, in an anticipation of price reverting back to the moving average, it is a useful piece of option to use during sideway markets.
Use MACD Filter
MACD here will act as a filter rather than an entry signal generator. There are a few different ways to use this MACD filter. You can click on the Use MACD filter and it will use filter out the shorts generated in a bullish territory and longs generated in the bearish territory. It will greatly reduce the number of trades the strategy will trade because MACD is a lagging indicator. By the time MACD turns bullish or bearish , most of the other indicators will have already generated the signals. Therefore, resulting in less trades. You can use MACD filter as MA oscillator meaning that it will only look at the MA lines in MACD to filter out trades. Alternatively, you can use it with the histogram (Signal lines) meaning that it will only look at the histogram whether its below or above the zero line in order to filter out the trades.
TP (%)
Place your desired take profit percentage here. Default is 1.5%
Move SL At Entry x% Profit
This is when the strategy will move your SL to the entry point if the position reaches x% profit. It can also generate a signal which can be automated to adjust the SL on the exchange.
SL (%)
Place your desired stop loss percentage here. Default is 1%
The backtester assumes the following;
- 1000$ capital
- 0.06% commission based on binance
- 1% risk meaning 100% equity on cross leverage
- Backtest results are starting from 2020
If you want to get access to this indicator please DM me or visit our website.

LB Squeeze Momentum DivergencesThis study tries to highlight LazyBear Squeeze Momentum divergences
as they are defined by
TradingLatino TradingView user
Squeeze momentum green peaks are connected by a line
Associated prices to these green peaks are also connected
If both lines have a different slope orientation
then there is a divergence.
It only shows two last divergence lines and angles.
The original chart screenshot shows some divergence lines
on the top or main chart
these were drawn manually
because you cannot write to two different charts
from the same pine script study (Well, not in August 2020 anyways)
It's aimed at BTCUSDT pair and 4h timeframe.
HOW IT WORKS
Simple geometric mathematics are used
to calculate the two lines degrees
Then both degrees are compared
to show if both lines agree ( // or \\ )
or if they disagree ( /\ or \/ )
SETTINGS
(SQZDiver) Show degrees : Show degrees of each Squeeze Momentum Divergence
lines to the x-axis.
(SQZDiver) Show desviation labels : Whether to show
or not desviation labels for the Squeeze Momentum Divergences.
(SQZDiver) Show desviation lines : Whether to show
or not desviation lines for the Squeeze Momentum Divergences.
(ADX) Smoothing
(ADX) DI Length
(ADX) key level
(ADX) Print : Whether to show
or not scaled ADX line
(SQZMOM) BB Length
(SQZMOM) BB MultFactor
(SQZMOM) KC Length
(SQZMOM) KC MultFactor
(SQZMOM) Use TrueRange (KC)
(SQZMOM) Print : Whether to show
or not Squeeze Momentum indicator.
WARNING
Some securities and timeframes might output degrees
too next to zero.
The code might need to be tweaked to meet your needs.
USAGE
One strategy is to sell when you are in a long entry
when you find out that the price slope is upwards ( / )
while the lb smilb slope is downwards: ( \ )
E.g. You will see:
/
\
on the indicator.
Why?
Because it might signal you that the price is
going to correct downwards soon.
FEEDBACK 1
Please let me know if there is any
other strategy based on the red side of
LB Squeeze Momentum
so that I might add support for it in the future.
FEEDBACK 2
Calculating degrees in a chart
with a different x-axis scale
is a nightmare
that's why I did not a range settings
so that values next to zero are
converted into zero
and thus showing an horizontal line.
Feedback is welcome on this matter.
EXTRA 1
If you turn off showing the divergence lines
and if you turn off showing the divergence labels
you almost get what TradingLatino user uses
as its default momentum indicator.
EXTRA 2
Optionally this indicator can show you
a rescaled ADX (it only works properly on 2020 Bitcoin charts)
ABOUT COLOURS
TradingLatino user has both dark green and light green
inverted compared to this LB SQZMOM chart.
CREDITS
I have reused and adapted some code from
'Squeeze Momentum Indicator' study
which it's from TradingView LazyBear user.
I have reused and adapted some code from
'Directional Movement Index + ADX & Keylevel Support' study
which it's from TradingView console user.

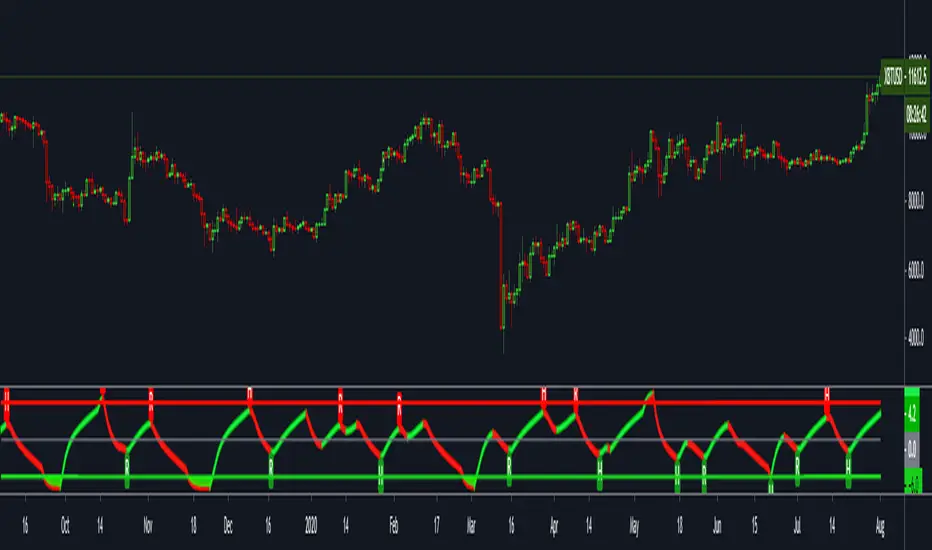
Bull vs Bear Power by DGTElder-Ray Bear and Bull Power
Dr. Alexander Elder cleverly named his first indicator Elder-Ray because of its function, which is designed to see through the market like an X-ray machine. Developed in 1989, the Elder-Ray indicator can be applied to the chart of any security and helps traders determine the strength of competing groups of bulls and bears by gazing under the surface of the markets for data that may not immediately be ascertainable from a superficial glance at prices
The Elder-Ray indicator is comprised by three elements – Bear Power, Bull Power and a 13-period Exponential Moving Average.
As the high price of any candle shows the maximum power of buyers and the low price of any candle shows the maximum power of sellers, Elder uses the 13-period EMA in order to present the average consensus of price value. Bull power shows whether buyers are capable of pushing prices above the average consensus of value. Bear power shows whether sellers are capable of pushing prices below the average consensus of value. Mathematically, Bull power is the result of subtracting the 13-period EMA from the high price of the day, and Bear power is the result of subtracting the 13-period EMA from the low price of the day.
What does this study implements
Attempts to customize interpretation of Alexander Elder's Elder-Ray Indicator (Bull and Bear Power) by
• adding additional insights to support/confirm Elder’s strategy with different indicators related with the Elder’s concept
• providing different options of visualization of the indicator
• providing smoothing capability
Other Indicators to support/confirm Elder-Ray Indicator:
Colored Directional Movement Index (CDMI) , a custom interpretation of J. Welles Wilder’s Directional Movement Index (DMI) , where :
DMI is a collection of three separate indicators ( ADX , +DI , -DI ) combined into one and measures the trend’s strength as well as its direction
CDMI is a custom interpretation of DMI which presents ( ADX , +DI , -DI ) with a color scale - representing the trend’s strength, color density - representing momentum/slope of the trend’s strength, and triangle up/down shapes - representing the trend’s direction. CDMI provides all the information in a single line with colored triangle shapes plotted on the top. DMI can provide quality information and even trading signals but it is not an easy indicator to master, whereus CDMI simplifies its usage.
Alexander Elder considers the slope of the EMA, which gives insight into the recent trend whether is up or down, and CDMI adds additional insight of verifying/confirming the trend as well as its strength
Note : educational content of how to read CDMI can be found in ideas section named as “Colored Directional Movement Index”
different usages of CDMI can be observed with studies “Candlestick Patterns in Context by DGT", “Ichimoku Colored SuperTrend + Colored DMI by DGT”, “Colored Directional Movement and Bollinger Band's Cloud by DGT”, and “Technical Analyst by DGT”
Price Convergence/Divergence , if we pay attention to mathematical formulations of bull power, bear power and price convergence/divergence (also can be expressed as price distance to its ma) we would clearly observe that price convergence/divergence is in fact the result of how the market performed based on the fact that we assume 13-period EMA is consensus of price value. Then, we may assume that the price convergence/divergence crosses of bull power, or bear power, or sum of bull and bear power could be considered as potential trading signals
Additionally, price convergence/divergence visualizes the belief that prices high above the moving average or low below it are likely to be remedied in the future by a reverse price movement
Alternatively, Least Squares Moving Average of Price Convergence/Divergence (also known as Linear Regression Curve) can be plotted instead of Price Convergence/Divergence which can be considered as a smoothed version of Price Convergence/Divergence
Note : different usages of Price Convergence/Divergence can be observed with studies “Trading Psychology - Fear & Greed Index by DGT”, “Price Distance to its MA by DGT”, “P-MACD by DGT”, where “Price Distance to its MA by DGT” can also be considered as educational content which includes an article of a research carried on the topic
Options of Visualization
Bull and Bear Power plotted as two separate
• histograms
• lines
• bands
Sum of Bull and Bear Power plotted as single
• histogram
• line
• band
Others
Price Convergence/Divergence displayed as Line
CDMI is displayed as single colored line of triangle shapes, where triangle shapes displays direction of the trend (triangle up represents bull and triangle down represent bear), colors of CDMI displays the strength of the trend (green – strong bullish, red – strong bearish, gray – no trend, yellow – week trend)
In general with this study, color densities also have a meaning and aims to displays if the value of the indicator is falling or growing, darker colors displays more intense move comparing to light one
Note : band's upper and lower levels are calculated by using standard deviation build-in function with multiply factor of 0.236 Fibonacci’s ratio (just a number for our case, no any meaning)
Smoothing
No smoothing is applied by default but the capability is added in case Price Convergence/Divergence Line is assumed to be used as a signal line it will be worth smoothing the bear, bull or sum of bear and bull power indicators
Interpreting Elder-Ray Indicator, according to Dr. Alexander Elder
Bull Power should remain positive in normal circumstances, while Bear Power should remain negative in normal circumstances. In case the Bull Power indicator enters into negative territory, this implies that sellers have overcome buyers and control the market. In case the Bear Power indicator enters into positive territory, this indicates that buyers have overcome sellers and control the market. A trader should not go long at times when the Bear Power indicator is positive and he/she should not go short at times when the Bull Power indicator is negative.
13-period EMAs slope can be used in order to identify the direction of the major trend. According to Elder, the most reliable buy signals are generated, when there is a bullish divergence between the Bear Power indicator and the price (Bear Power forms higher lows, while the market forms lower lows). The most reliable sell signals are generated, when there is a bearish divergence between the Bull Power indicator and the price (Bull Power forms lower highs, while the market forms higher highs).
There are four basic conditions, required to go long or short, with the use of the Elder-Ray method alone.
In order to go long:
1. The market is in a bull trend, as indicated by the 13-period EMA
2. Bear Power is in negative territory, but increasing
3. The most recent Bull Power top is higher than its prior top
4. Bear Power is going up from a bullish divergence
The last two conditions are optional that fine-tune the buying decision
In order to go short:
1. The market is in a bear trend, as indicated by the 13-period EMA
2. Bull Power is in positive territory, but falling
3. The most recent Bear Power bottom is lower than its prior bottom
4. Bull Power is falling from a bearish divergence
The last two conditions are optional, they provide a stronger signal for shorting but they are not absolutely essential
If a trader is willing to add to his/her position, he/she needs to:
1. add to his/her long position, when the Bear Power falls below zero and then climbs back into positive territory
2. add to his/her short position, when the Bull Power increases above zero and then drops back into negative territory.
note : terminology of the definitions used herein are as per TV dictionary
Trading success is all about following your trading strategy and the indicators should fit within your trading strategy, and not to be traded upon solely
Disclaimer : The script is for informational and educational purposes only. Use of the script does not constitute professional and/or financial advice. You alone have the sole responsibility of evaluating the script output and risks associated with the use of the script. In exchange for using the script, you agree not to hold dgtrd TradingView user liable for any possible claim for damages arising from any decision you make based on use of the script

FTSXFisher transform & RSX for reversal points in price.
Potential price reversals are regular divergences and potential trend continuations are hidden divergences, OB/OS levels are shown with red and green lines.
Trading Psychology - Fear & Greed Index by DGTPsychology of a Market Cycle - Where are we in the cycle?
Before proceeding with the question "where", let's first have a quick look at "What is market psychology?"
Market psychology is the idea that the movements of a market reflect the emotional state of its participants. It is one of the main topics of behavioral economics - an interdisciplinary field that investigates the various factors that precede economic decisions. Many believe that emotions are the main driving force behind the shifts of financial markets and that the overall fluctuating investor sentiment is what creates the so-called psychological market cycles - which is also dynamic.
Stages of Investor Emotions:
* Optimism – A positive outlook encourages us about the future, leading us to buy stocks.
* Excitement – Having seen some of our initial ideas work, we begin considering what our market success could allow us to accomplish.
* Thrill – At this point we investors cannot believe our success and begin to comment on how smart we are.
* Euphoria – This marks the point of maximum financial risk. Having seen every decision result in quick, easy profits, we begin to ignore risk and expect every trade to become profitable.
* Anxiety – For the first time the market moves against us. Having never stared at unrealized losses, we tell ourselves we are long-term investors and that all our ideas will eventually work.
* Denial – When markets have not rebounded, yet we do not know how to respond, we begin denying either that we made poor choices or that things will not improve shortly.
* Fear – The market realities become confusing. We believe the stocks we own will never move in our favor.
* Desperation – Not knowing how to act, we grasp at any idea that will allow us to get back to breakeven.
* Panic – Having exhausted all ideas, we are at a loss for what to do next.
* Capitulation – Deciding our portfolio will never increase again, we sell all our stocks to avoid any future losses.
* Despondency – After exiting the markets we do not want to buy stocks ever again. This often marks the moment of greatest financial opportunity.
* Depression – Not knowing how we could be so foolish, we are left trying to understand our actions.
* Hope – Eventually we return to the realization that markets move in cycles, and we begin looking for our next opportunity.
* Relief – Having bought a stock that turned profitable, we renew our faith that there is a future in investing.
It's hard to predict with certainty where we exactly are in the market cycle, we can only make an educated guess as to the rough stage based on data available. And here comes the study "Trading Psychology - Fear & Greed Index"
Factors taken into account in this study include:
1-Price Momentum : Price Divergence/Convergence versus its Slow Moving Average
2-Strenght : Rate of Return (RoR) also called Return on Investment (ROI) is a performance measure used to evaluate the efficiency of an investment, net gain or loss of an investment over a specified time period, the rate of change in price movement over a period of time to help investors determine the strength
3-Money Flow : Chaikin Money Flow (CMF) is a technical analysis indicator used to measure Money Flow Volume over a set period of time. CMF can be used as a way to further quantify changes in buying and selling pressure and can help to anticipate future changes and therefore trading opportunities. CMF calculations is based on Accumulation/Distribution
4-Market Volatility : CBOE Volatility Index (VIX), the Volatility Index, or VIX, is a real-time market index that represents the market's expectation of 30-day forward-looking volatility. Derived from the price inputs of the S&P 500 index options, it provides a measure of market risk and investors' sentiments. It is also known by other names like "Fear Gauge" or "Fear Index." Investors, research analysts and portfolio managers look to VIX values as a way to measure market risk, fear and stress before they take investment decisions
5-Safe Haven Demand : in this study GOLD demand is assumed
What to look for :
*Fear and Greed Index as explained above,
*Divergencies
Tool tip of the label displayed provides details of references
Conclusion:
As investors, we always get caught up in the day to day price movements, and lose sight of the bigger picture. The biggest crashes happen not when investors are cautious and fearful, it's when they're euphoric and expecting financial instruments to continue going higher. So as we continue investing, don’t forget to stop and ask yourself, where in the chart do you think we are right now? The Market Psychology Cycle shines light on how emotions evolve, fear and greed index can come in handy, provided that it is not the only tool used to make investment decisions. It is easy to look back at market cycles and recognize how the overall psychology changed. Analyzing previous data makes it obvious what actions and decisions would have been the most profitable. However, it is much harder to understand how the market is changing as it goes - and even harder to predict what comes next. Many investors use technical analysis (TA) to attempt to anticipate where the market is likely to go. Investors are advised to keep tabs on fear for potential buying the dips opportunities and view periods of greed as a potential indicator that financial instruments might be overvalued.
Warren Buffett's quote, buy when others are fearful, and sell when others are greedy
Trading success is all about following your trading strategy and the indicators should fit within your trading strategy, and not to be traded upon solely
Disclaimer : The script is for informational and educational purposes only. Use of the script does not constitute professional and/or financial advice. You alone have the sole responsibility of evaluating the script output and risks associated with the use of the script. In exchange for using the script, you agree not to hold dgtrd TradingView user liable for any possible claim for damages arising from any decision you make based on use of the script

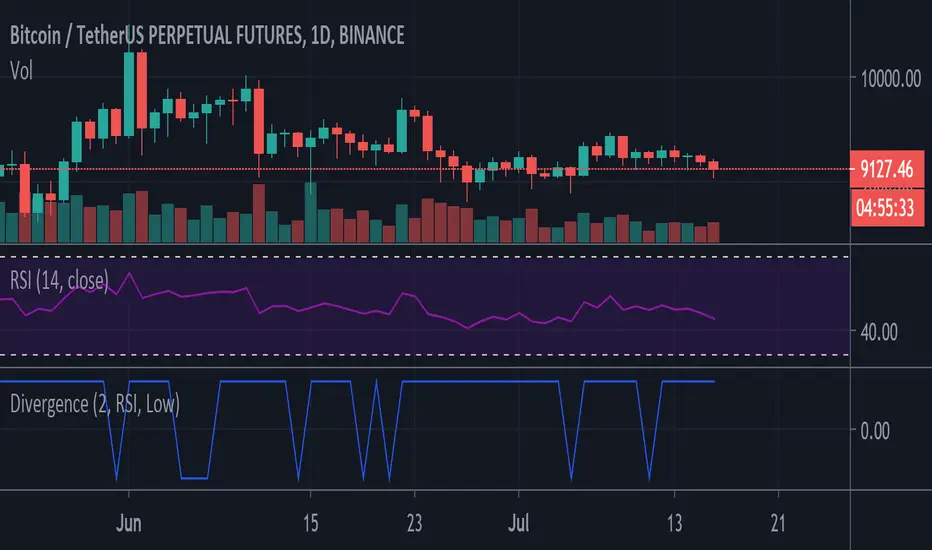
DivergenceDivergence detector. Determines divergence between Price, and any other Indicator, RSI, Vol, etc... Returns a "-1" if there is a divergence and returns a "+1" if no divergence
WaveTrend Momentum (Zeiierman)█ Overview
WaveTrend Momentum (Zeiierman) reveals the underlying rhythm of market movement through positive and negative momentum waves that visualize both sides of trend behavior. This dual-wave structure makes it easy to see how impulses and retracements interact in real time, helping you distinguish between a normal pullback within strength and the early signs of a trend losing momentum.
The indicator layers its waves with higher-timeframe trend alignment and adaptive context filters, mapping when momentum expands, when it fades, and where a pullback is approaching exhaustion or renewed trend strength is likely to emerge.
⚪ Why This One Is Unique
Unlike conventional wave oscillators, this design uses dual, phase-managed wave construction with adaptive scaling across symbols and timeframes. At its core is a three-mode Trend Strength engine (Adaptive, Stability, Structure) that dynamically adjusts to market conditions, supported by higher-timeframe regime sourcing and a dedicated impulse-and-divergence framework.
█ Main features
⚪ WaveTrend Momentum Waves
The foundation of the indicator lies in its ability to build positive and negative momentum waves that visualize both sides of market movement. This dual-wave structure makes it easy to identify trend direction, impulses, retracements, and exhaustion in real time, showing how momentum evolves within broader market phases. The waves can be used directly to gauge trend strength and direction, helping traders stay aligned with prevailing momentum or recognize when a shift is forming.
⚪ Extreme Moves
Extreme Zones highlight points where momentum reaches statistically stretched conditions, areas where price action often pauses, rebalances, or reverses. These zones help traders anticipate potential exhaustion before it becomes visible on price, improving timing for entries, exits, and scaling decisions.
⚪ Impulse Moves
Impulse Markers identify bursts of directional momentum, moments when trend energy expands sharply. These points often align with breakouts, accelerations, or continuation signals, helping traders focus on active opportunities rather than noise or consolidation.
⚪ Trend Strength
The Trend Strength Line adapts dynamically to shifting market regimes. It can operate in three modes: Adaptive, Stability, and Structure, each offering a different sensitivity level to trend changes. This feature helps confirm whether the trend is building, stabilizing, or losing strength, and serves as a foundation for bias filtering or trade direction confirmation.
⚪ Higher-Timeframe Trend Alignment
Integrates a higher-timeframe trend reference directly into the analysis, giving each wave context. This alignment clarifies when local pullbacks occur in harmony or conflict with the broader trend, making it easier to distinguish temporary corrections from true reversals.
⚪ Divergence Engine
A fully integrated divergence detection system that automatically spots both regular and hidden divergences between price and momentum. By surfacing early signs of trend weakening or continuation potential, it gives traders a structured way to detect subtle momentum shifts before they manifest in price.
█ How to Use
⚪ Trend Trading
WaveTrend Momentum excels as a trend-following framework by combining wave direction, Trend Strength, and higher-timeframe alignment to reveal when momentum is expanding or contracting within the broader market phase.
Note: To get trend waves, consider increasing the Wave Transition value to above 40.
Bullish WaveTrend Trend: When the positive momentum waves are above the neutral midpoint, the market is trending upward. Minor downward retracements within this structure often resolve back into trend continuation once buying pressure reasserts itself, particularly when the higher-timeframe context confirms a bullish regime.
Bearish WaveTrend Trend: When the negative wave dominates and remains below the midpoint, downside momentum controls the market. Minor upward retracements within this structure often resolve back into trend continuation once selling pressure reasserts itself, particularly when the higher-timeframe context confirms a bearish regime.
Bullish Trend Strength Line: A Trend Strength Line positioned above the midline indicates a bullish trend. A rising line reflects growing momentum and persistent buying pressure. The steeper the slope, the stronger the current regime. As long as the line continues to rise alongside positive waves, the trend remains structurally intact.
Bearish Trend Strength Line: A Trend Strength Line positioned below the midline indicates a bearish trend. A declining line reflects increasing selling pressure and persistent downside momentum. The steeper the slope, the stronger the current bearish regime. As long as the line continues to fall alongside negative waves, the trend remains structurally intact.
⚪ Momentum Trading
Momentum trading focuses on capturing the energy and force behind price movement, identifying whether the market is accelerating, losing steam, or preparing for a reversal. Momentum shifts can reveal temporary exhaustion, trend-strength continuation, or breakout acceleration before price action fully confirms it.
The indicator includes several features designed to detect and visualize momentum:
Waves: The core element of the indicator. The size and slope of the waves reflect the strength of momentum. Expanding waves indicate strong directional pressure, while contracting waves suggest cooling or consolidation.
Extreme Zones: When waves reach or exceed the extreme levels, the market enters statistically stretched conditions, signaling potential exhaustion or reversal zones. However, these events can also occur during strong trends, indicating continued strength in that direction. Market context is essential to determine whether an extreme should be interpreted as a reversal signal or as confirmation of trend momentum.
Impulse Markers: Highlight sudden bursts of momentum, often associated with breakouts or continuation events. Like Extreme Zones, Impulse Markers can appear within both reversals and strong trending phases. Context from price structure and higher timeframes helps identify whether the impulse reflects a trend-strength expansion or the final surge before exhaustion.
You can use any of these features to identify:
Breakouts: When Impulse or Extreme Markers align with expanding waves.
Reversals: When momentum reaches extreme levels followed by a fade in strength, it signals potential exhaustion before a structural shift. However, strong trends can also produce temporary fades that quickly recover, so context is key to distinguishing between true reversals and brief pauses within the trend.
⚪ Pullback Trading
Pullbacks represent short pauses or retracements within a prevailing trend. The combination of the Wave, Impulse Markers, and the Trend Strength Line helps identify when a pullback is maturing and when continuation is likely to resume.
Bullish WaveTrend and Trend Strength Pullback
In an uptrend, a brief dip in the negative wave, paired with a bullish Trend Strength, typically signals a healthy pullback rather than a reversal. When the negative wave begins to turn upward again, it confirms momentum recovery and potential for continuation.
Bearish WaveTrend and Trend Strength Pullback
In a downtrend, a short-lived rise in the positive wave while Trend Strength remains negative usually signals a counter-trend rally within weakness. As the positive wave fades and the negative wave expands again, downside continuation becomes more probable.
⚪ Divergence Trading
Divergence trading focuses on identifying moments when price and momentum move out of sync, signaling a potential shift in market direction or a slowdown in trend strength. These divergences often appear before reversals, consolidations, or major transitions in structure, making them a valuable early warning tool for traders.
The integrated Divergence Engine automatically detects these imbalances between price action and momentum. When price continues to move in one direction but momentum begins to fade, it suggests that the underlying strength driving the move is weakening.
█ How It Works
⚪ Wave Construction
The momentum wave is derived from phase-managed price smoothers, then normalized and bounded to express both positive and negative momentum within a single coherent structure.
Calculation: Composite moving frameworks with phase management, nonlinear rescaling, and amplitude companding to stabilize wave height and maintain consistent sensitivity.
⚪ Extremes
An auxiliary equilibrium tracker measures deviations from a dynamic mean to identify statistically stretched conditions in which momentum may begin to rebalance.
Calculation: Robust deviation mapping of a smoothed equilibrium series with adaptive thresholds for regime-consistent extremes.
⚪ Trend Strength Core
A tri-mode core measures directional persistence and adapts dynamically to changing market regimes, with optional higher-timeframe sourcing for context.
Calculation: Return-aggregated momentum with envelope gating (Adaptive), stability-biased curvature tracking (Stability), and structure-driven range midpoint logic (Structure).
⚪ Range & Regime Filter
A volatility-adjusted filter produces a smoothed state line and internal bias zones, allowing the indicator to contextualize momentum behavior within current volatility conditions.
Calculation: Volatility-normalized range synthesis with slow/fast quantization modes and optional smoothing to mitigate market chop.
⚪ Impulse Detection
Detects short-term bursts of directional energy and marks them as impulse events. These impulses highlight when momentum rapidly expands, often signaling breakouts, accelerations, or the end of low-volatility phases.
Calculation: Nonlinear impulse-response mapping that emphasizes higher-order rate changes while filtering out micro-noise.
⚪ Divergence Engine (Regular & Hidden)
Compares price swings against the wave’s momentum structure to identify early disagreement between price and internal strength.
Calculation: Swing-logic comparators analyze price relative to normalized wave amplitude to detect momentum shifts and potential divergence setups.
-----------------
Disclaimer
The content provided in my scripts, indicators, ideas, algorithms, and systems is for educational and informational purposes only. It does not constitute financial advice, investment recommendations, or a solicitation to buy or sell any financial instruments. I will not accept liability for any loss or damage, including without limitation any loss of profit, which may arise directly or indirectly from the use of or reliance on such information.
All investments involve risk, and the past performance of a security, industry, sector, market, financial product, trading strategy, backtest, or individual's trading does not guarantee future results or returns. Investors are fully responsible for any investment decisions they make. Such decisions should be based solely on an evaluation of their financial circumstances, investment objectives, risk tolerance, and liquidity needs.
Tập lệnh trả phí

Divergence Sniper (Acc/Dist/Vol/MF @iam516)Volume + Money Flow + Accumulation Distribution Divergence Formula
1. Layer on top of price
2. Disable 'Hide Pivots'
3. Use Blue stripes (pivots) to identify areas of reversals. These are combined vol/mf/acc/dist divergences and points of exhaustion for either side. When the peaks are at the top, a blue pivot would indicate overbought, at the bottom oversold.
Green and Red stripes indicate areas of confirmed divergences / main areas of pivots, however, the blue stripes are more precise for scalping and work near perfectly. In strong trends, sometimes you will get 2 or even 3 pivots in a row before the price reverses, so I wouldn't suggest using the very first availble pivot to enter a position in a strong trend. In accumulative/range type scenarios, 1st blue pivots usually give you the perfect entry. In strong trend / impulsive move scenarios, I would wait for either a 2-drive or a 3-drive divergence (2nd or 3rd blue stripe to appear) to snipe an entry.
4. I suggest enabling all kinds of custom time frames: 1,2,3,4,5,6,7,8,9,10 minutes, 15 minutes, 20 minutes, 25 minutes. For medium time frames, I suggest adding 4 hours, 6 hours, 8 hours, 10 hours. For high time frames, add 4 day, 5 day, 6 day. For anything above, add 2 months and 5 months besides monthly and quarterly.
5. Default colors of peaks are green, you can customize them to make them match your chart's color scheme. I prefer light grey on top of black.
Good luck, let me know if you have any questions

Volume Divergence by MMIt's a simply volume indicator. You should watch for breaks on both volume uptrend and volume downtrend. It uses fibonacci numbers to build smoothed moving average of volume.
Also you can check divergences for trend reversal and momentum loss.

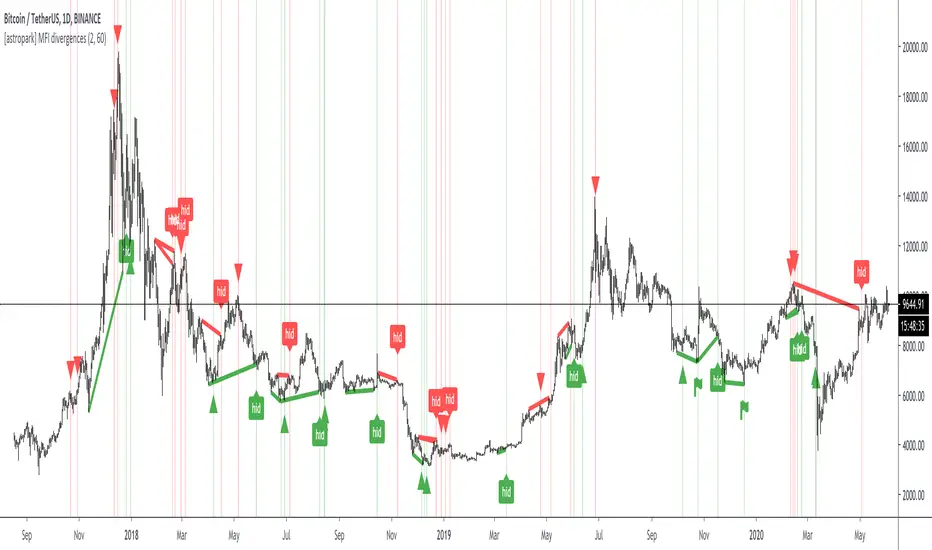
[astropark] MFI divergencesDear Followers,
today a new great Scalper Tool , based on a custom version of Money Flow (MFI) oscillator, which works on both Candlesticks, Heiking Ashi and Renko charts , from 1 second Renko chart and above (on non Renko charts, the higher, the better of course!), both on FOREX, Cryptocurrencies, Stocks and Commodities!
This tool has some cool features:
it works on all timeframes , on both Renko, Heikin Ashi and Candlesticks chart
it shows you both bullish and bearish divergences with a triangle up or down respectively
when it finds a strong bullish/bearish divergence , a flag will be displayed instead of a triangle
it shows you both hidden bullish and bearish divergences with a label "hid"
This script will let you set all notifications you may need in order to be alerted on each triggered divergence.
You may like to use it together with my Renko OBV Divergences indicator (which works on Candlesticks and Heiking Ashi too)
and my Renko RSI Divergences indicator (which works on Candlesticks and Heiking Ashi too)
On Bitmex/ByBit/Binance Bitcoin/USD chart best Renko settings is Traditional Renko chart with 11$ box size, while 0.5$ box size is suggested on Ethereum/USD pair.
This is a premium indicator , so send me a private message in order to get access to this script.
{INDYAN} RSI + MACDModded RSI and MACD for intraday use. If rsi above 60 and macd is above zero line then go for buy and if rsi is below 40 and macd below zero line then go for sell side. use it in small timeframe i.e. 3 minute or less.
better for scalp trading
Happy Trading
Love INDYAN
#It can be used best with INDYAN Go With Trend

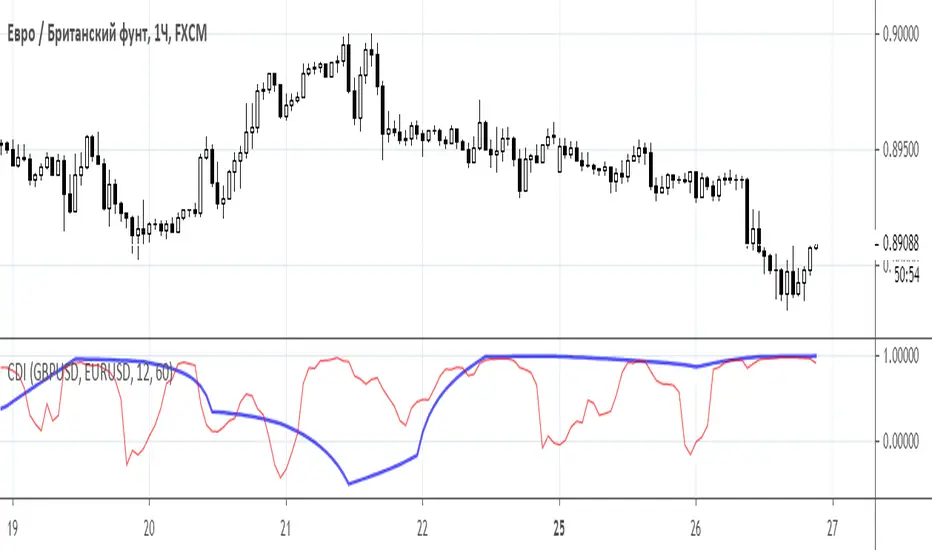
Convergence/divergence indicatorConvergence/divergence indicator (CDI)
Class : arbitrage oscillator
Trading type : intraday trading
Time frame : 1 hour
Purpose : trading on divergence
Level of aggressiveness : standard
Arbitrage - several logically related transactions aimed at profit from the difference in prices for the same or related assets at the same time in different markets.
Pair trading is a trading strategy based on trading a pair of financial instruments that have some fundamental or statistical relationship, expressed in the fact that the price ratio of these instruments tends to return to a certain average value in the long term.
“Convergence/divergence indicator (CDI)” using correlation analysis from different time frames provides information about statistical relationship between pair of assets.
Correaltion - a statistical relationship between two variables, showing that a larger value (in the case of positive, direct correlation) or a smaller (in the case of negative, inverse correlation) corresponds to a larger value of one value in a certain part of the cases.
The correlation coefficient is a statistical measure of the strength of the relationship between the relative movements of two variables.
The values range between -1.0 and 1.0.
A correlation of -1.0 shows a perfect negative correlation, while a correlation of 1.0 shows a perfect positive correlation.
A correlation of 0.0 shows no linear relationship between the movement of the two variables.
“Convergence/divergence indicator (CDI)” a) allows to find assets where pair arbitrage is possible and determines the moments in time and prices when the conditions for pair arbitrage are ideal.
“Convergence/divergence indicator (CDI)” evaluates the statistical relationship between pair of assets in a particular period of time and, if it is available, seeks for the divergence in price fluctuations of these “identical” assets.
“Convergence/divergence indicator (CDI)” displays the current value and dynamics of the Pearson correlation coefficient for a pair of selected assets based on daily (thick blue line) and hourly (thin red line) data.
Basic parameters:
- asset 1 (name of the trading instrument 1);
- asset 2 (name of the trading instrument 2);
- period_d (number of periods used to calculate daily correlation).
- period_h (number of periods used to calculate hourly correlation).
To gain the access to this indicator, please, send a private message to Trade24Fx.
LuxAlgo® - Oscillator Matrix™Oscillator Matrix™ is an all-in-one indicator that incorporates 6+ unique components designed for interoperability & confluence with one another to provide a powerful trend following & reversal detection experience.
Users can create various ways to utilize the indicator's features together such as looking for excess money flowing into the market alongside strong reversal signals appearing or getting real-time divergence signals alongside a lack of money flowing into the market to predict upcoming trends.
This indicator is described as an 'Oscillator Matrix' as it's made up of many different components that can create a systematic approach to analyzing markets alone, however, the indicator also can serve as a great secondary piece to a user's primary analysis with or without our other LuxAlgo Premium indicators.
🔶 FEATURES
Below we describe each component of Oscillator Matrix™ in order of each's significance for the most confluent analysis possible.
Money Flow - Easily see the amount of buying or selling liquidity entering the market by analyzing the green & red waves and how they react with their thresholds to achieve further insight. Best to analyze first before considering any signals the indicator can generate.
Thresholds - Dynamic levels that align above/below the Money Flow to show at which level significant buying or selling is actually taking place.
Overflow - Small lighter waves that occur within the Money Flow's display when excess buying or selling activity is occurring to accurately predict upcoming reversals.
Hyper Wave - An oscillator ribbon in green/grey that provides highly reactive trend following signals & powerful divergence detection.
Real-Time Divergences - Real-time divergence labels that appear on the Hyper Wave oscillator's adaptive ribbon. A highly effective approach to a concept that's not typically done for oscillators. Users can also increase the sensitivity of divergences within the settings.
Reversal Signals - Small dots on the upper or lower boundaries represent high frequency points that indicate possible reversals or a warning signal to upcoming larger reversal signals which are indicated separately by the large triangular arrows on the top & bottom of the indicator's panel.
Confluence Zones - Allows the Money Flow & Hyper Wave oscillator to be used together to display easily interpretable shades of bullish & bearish activity. Brighter, more vibrant colors indicate strong bullish or bearish confluence between these 2 features.
Confluence Meter - An optional display at the current bar to easily find the current level of confluence between all features within Oscillator Matrix™ indicated by the arrow pointing to bullish or bearish levels. (Disabled by default)
Generally, we recommend using these features in order from first to last, whereas analyzing components of the Smart Money Flow category prior to considering other features in your analysis is most productive to ensure you find proper confluence alongside any signal that is generated.
🔶 USAGE
In the image below, we can see 5 points of interest to a user analyzing Oscillator Matrix™ based on various different behaviors.
Point 1 : Here we can see a large reversal signal arrow at the bottom of the panel. These signals, like all signals in LuxAlgo Premium & any indicator in general are not meant to be used as buy/sell signals themselves.
What makes this signal particularly more of interest opposed to other reversal signals that may not play out right away is the Money Flow that corresponding as weak. We can tell the Money Flow is weak because it is not near the red threshold level.
This indicates to us that there is not real selling pressure occurring and that the market could easily reverse in these conditions.
Point 2 : In this specific area we can notice the Money Flow in green is moving upwards alongside the green threshold level. This combination indicates a high probability there is a lot of real buying volume coming into the market, opposed to the previous example (point 1) where the Money Flow was not near the threshold level.
We can also notice the Hyper Wave Oscillator is printing a green dot while above the 50 value on Oscillator Matrix™ panel, further indicating a likely bullish impulse to come.
Point 3 : There are multiple indications here showing us the market may potentially be reversing. The most notable being the larger red reversal arrow, however, as we mentioned previously these cannot be used by themselves.
A further indication is that on the Money Flow we can see Overflow has occurred by the lighter small wave that has appeared & is now turning downwards. This indicates that an excess of buyers have come into the market & are likely to be washed out with a move to the downside.
We can see this happen once again about 8 candles later paired with a high frequency reversal signal (red dot) which marked a local high before the larger impulse down.
Point 4 : You can notice during the recent 25 or so candles the high frequency reversal points (green & red dots) have been highly effective for indicating potential local highs & lows in real-time.
There was a previous real-time bullish divergence detected while Money Flow was strongly in the red and this did indicate a small move upwards, however, with the Money Flow still holding in the red, another high frequency reversal dot, and then as the Money Flow begins to decrease further, we see a clean local top detected here at point 4.
Point 5 : As the lower Confluence Zone moved into the bright red, we saw a large move to the downside and a large bullish reversal signal printed in real-time as well.
Just like point 1, we have a very clear indication the selling has stopped as we further analyze the Money Flow is nowhere near it's true Activity Line.
This analysis combined gave us a further indication of a larger reversal which played out with no lag at all as all reversal signals are fully predictive separate from the Hyper Wave oscillator itself, which can be used as a further trend following approach alongside signals & money flow.
🔶 NAVIGATING MARKET CONDITIONS
In the image above we can see another example with 6 new points of interest marked in green & red shaded areas, all accompanied by a list of possible interpretations of the indicator.
The importance of this usage example is to demonstrate the ability to focus on certain components of the indicator during specific market conditions. For any indicator attempting to catch reversals, trending market conditions will be a detriment to its usability.
The same amount of the components within Oscillator Matrix™ will support trending market conditions as there are components to support ranging market conditions. The indicator further aims to provide clear abilities to detect when the market is likely trending or ranging.
With an understanding of the components within the Smart Money Flow section particularly such as the Overflow & Thresholds, it's possible to develop a more significant understanding of when to consider the market is trending vs when to consider the market may be ranging.
By doing this, we can potentially determine at certain points when to 'filter out' reversal signals or to just consider them merely indications of local tops/bottoms opposed to significant tops/bottoms.
Analyzing a significant Overflow particularly is useful to consider a trend potentially coming to an end. For example, at point 5 in the image above we had a clear downtrend only until there was a very considerable amount of Overflow that begun a real reversal.
We recommend studying the outlined chart above & the list of indications at each shaded area to develop a deep understanding of how to navigate varying market conditions & spot various points of confluence during reversals.
🔶 CONCLUSION & ACCESS
This indicator is an extremely comprehensive approach to an oscillator that allows users to further develop a systematic approach to trading and can be paired great alongside other forms of technical analysis such as our LuxAlgo Signals & Overlays indicator.
Although we believe this indicator to be useful, it's critical to understand that past performance is not necessarily indicative of future results and there are many more factors that go into being a profitable trader.
You can see the Author's instructions below to get instant access to Oscillator Matrix™ & our LuxAlgo Premium suite.

Mawreez' RSI Divergence DetectorThe idea behind this indicator is to have an expression for the amount of divergence on a given chart at every point in time . To achieve this, it adds up the magnitudes any valid divergence of any kind; bullish, bearish or their hidden variants. Where a valid divergence consists of a line on the source series (almost always the closing price), and a line on an oscillator (here: the RSI). The slopes of said lines must have opposite signs, that is to say, one line must be sloping up while the other slopes down. Said lines may not cross their respective series.
The length of the RSI is configurable (default length: 14). The lengths of the divergences are configurable (default: minimum length 3 and maximum length 28 - the latter being twice the default length of the RSI).
This indicator will detect divergences which are still building up. Be duly warned: upcoming divergences may still get invalidated. Another case that one should be very mindful of is that an upcoming divergence may still increase in magnitude before it plays out. Possibly over several more timesteps, there may even be entire additional drives.
The value of this indicator indeed reflects the magnitude of divergence on a chart. However, there is no reason to think the magnitude of a divergence affects the likelihood of said divergence playing out.
The color of the indicator indicates the kind of divergence. The default colors are
green for bullish divergence,
maroon (dark red) for bearish divergence,
lime/light green for hidden bullish divergence,
dark pink for hidden bearish divergence.
Please let me know if you would like to see a version of this indicator that plots both the RSI and this histogram. I will do this for personal use, but I am being a bit of a purist with this publication.
In fact, please don't hesitate to make any comment or to give any kind of suggestion.

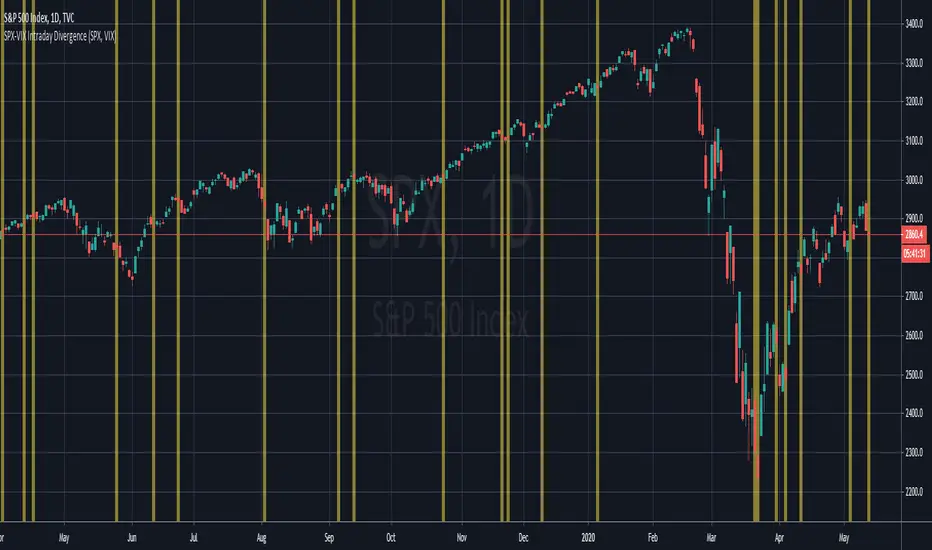
SPX-VIX Intraday DivergenceAs a long-term buyer/short-seller, you will always find different ways to enter the market , moving average crossovers, breakouts , overbought/oversold conditions being some of the classy methods. However, they are decreasingly effective... 😢
Recently I have realized that analysis beyond the technical indicators will bring trading to the next level because I will be able to confirm my trading signals without relying too much on basic price actions and patterns which are easily manipulated by big banks and institutions. 👍
Today I will introduce you to my divergence indicator making use of SPX and VIX. Unlike MacD or RSI divegence , which would involve normative judgement , it will take account of the unusual move by SPX alongwith the VIX , to the exploit chances that options market, where most experienced investors participated in has a preceding insight into the equity market about the upcoming moves.
I have divided signals into two groups.
Bullish divergence - SPX Down , VIX also Down 👇
Bearish divergence - SPX Up , VIX also Up 👆
I hope this script will enable us to take advantage of the options market activities , to provide a REAL divergence signal, and be used coupled with our own chart patterns or other price signals, and more importantly to score more and more winning trades!!!
If you want more useful scripts from me, please like and share my posts. And don't forget to follow my account to grab the latest ideas and tools! 😘
BKN DivergencesThis divergence script is unique in that it is not linked to any one indicator. When you first add the indicator to your chart you'll notice that no plots show up.
First, add an indicator, moving average, volume, or other tool to your chart.
Open the Divergence indicator settings and select the source you want to use to detect divergences. Your options for this selection are pretty limitless. Just about any tool that can be added to your chart can be selected as the source for detecting divergences.
You'll be able to set alerts for hidden or regular divergences, both bearish and bullish in nature.
***IMPORTANT***
Please don't comment below to request access to this indicator. All access requests should be sent via direct message here or on my linked Twitter account.

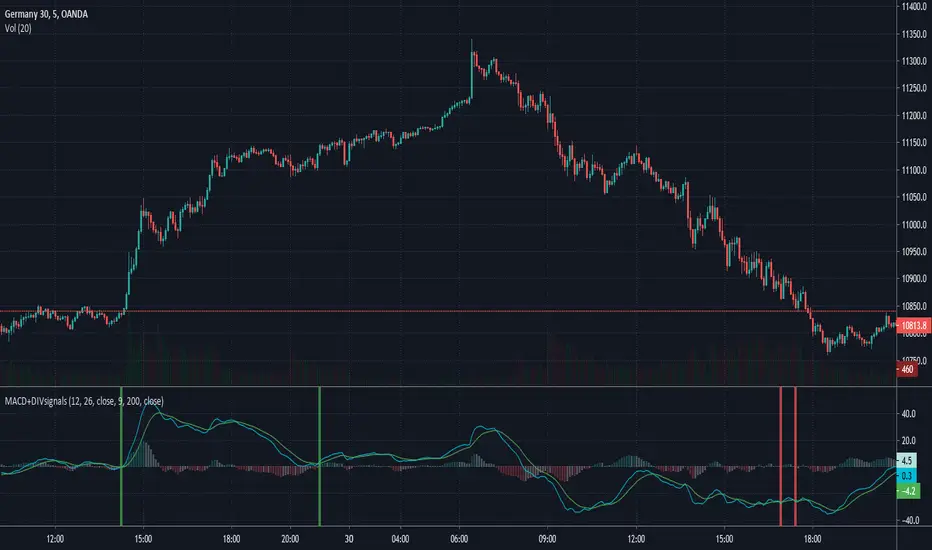
MACD with divergence signalsIts an MACD indicator which highlights places where macd and signal line cross and hidden divergence ocures.
Logic behind it is to check if we have hidden divergence when crossing of that two lines and if above EMA200 (signal for BUY - green) or if below EMA200 (signal for SELL - red).
You can change lenght of EMA but i think 200 is a simpliest trend indicator.
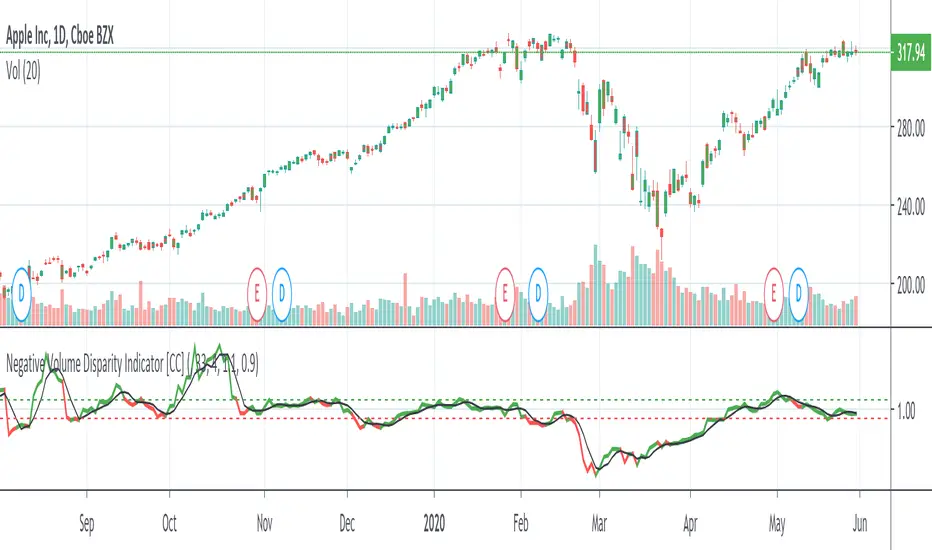
Negative Volume Disparity IndicatorThe Negative Volume Disparity Indicator was created by Phillip C. Holt (Stocks & Commodities V. 14:6 (265-269)). This converts the classic Negative Volume indicator into Bollinger Bands and calculates the percentage of where the value lies within the Bollinger Bands. Buy when the nvdi rises above its signal line and sell when it falls below the signal line.
The OBVDI was a special request so I figured I would add this one as well. Let me know what other indicators you would like me to write scripts for!
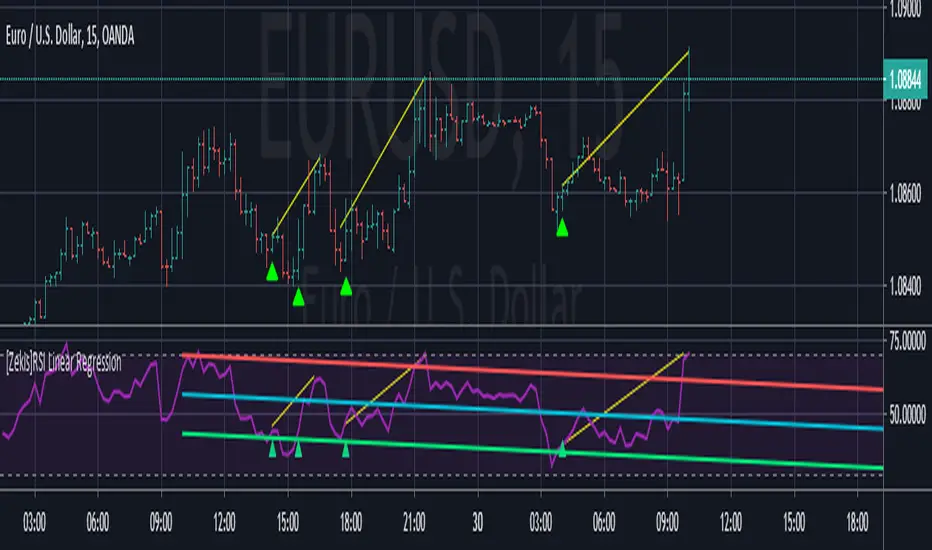
[Zekis]RSI Linear RegressionA very useful combination between RSI and linear regression that shows a clear trend.
It is not recommended to be used for entry/exit points as it is.
It's very powerful for trend analysis and divergences.
Linear regression is a tool for statistical analysis that attempts to show a relationship between two variables. Linear regression looks at various data points and plots a trend line. Linear regression can create a predictive model showing trends of data.
Can be used with any time frame, mtf is also added
Alerts are added for RSI crossing the channel lines
RSI Divergence Indicator strategyThis strategy is based on RSI divergence indicator.
RSI period setting 5
Go Long when Bull or Hidden Bull is shown
Exit when RSI goes above 75 OR when bear condition appears