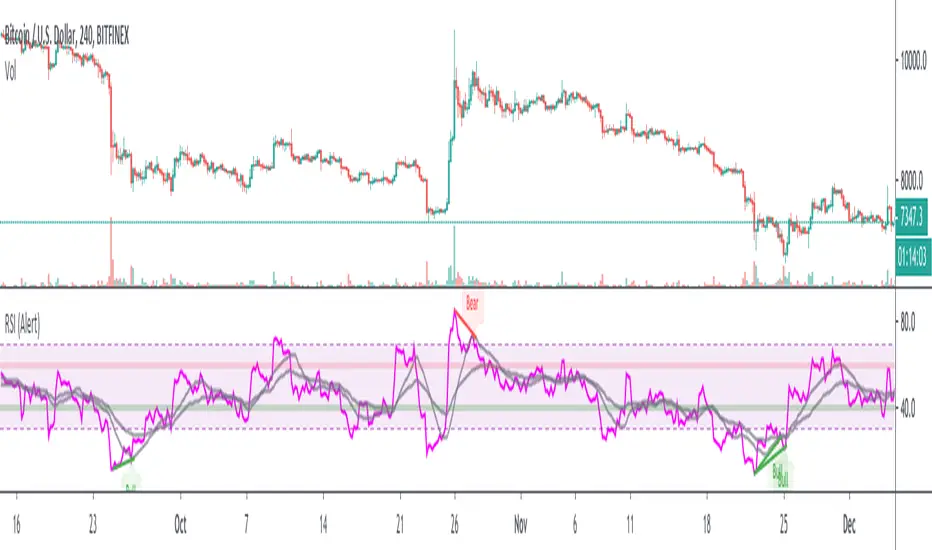
RSI w/ MAs & Divergences (Alert)This script fires off real-time RSI Divergence alerts.
To best use the RSI Divergence indicators, adjust the following settings accordingly.
• RSI Bullish Divergence Under: 20 – 45 (lower for larger volatility and more bearish markets)
• RSI Bearish Divergence Above: 55 – 80 (higher for larger volatility and more bullish markets)
Key Notes:
1. Set "Once Per Bar" instead of "Once Per Bar Close" alert.
The strategy already uses prior bar close (instead of current bar close) for calculation. This ensures that the signals will stay as they are after fired off, even when the current bar price is still changing.
2. It's OKAY to see the "alert may trigger differently than expected" warning.
Reason why you are seeing this warning is because we used a function called valuewhen() in our strategy. This function does not look at the entire history of data and has several limitations. For instance, on a 30min resolution, at the end of 2018, the function will be able to find past occurrences of BTC exceeding 16k. However, the function won't be able to find such occurrences at the end of 2019. Since our strategy is only concerned with very recent events, these limitations will not impact our results or cause repainting. You can find out more about this in the TradingView Wiki .
Phân kỳ
RSI w/ MAs & DivergencesTo best use the RSI Divergence indicators, adjust the following settings accordingly.
• RSI Bullish Divergence Under: 20 – 45 (lower for larger volatility and more bearish markets)
• RSI Bearish Divergence Above: 55 – 80 (higher for larger volatility and more bullish markets)
THIS SCRIPT DOES NOT REPAINT AND IS COMPLETELY FREE.

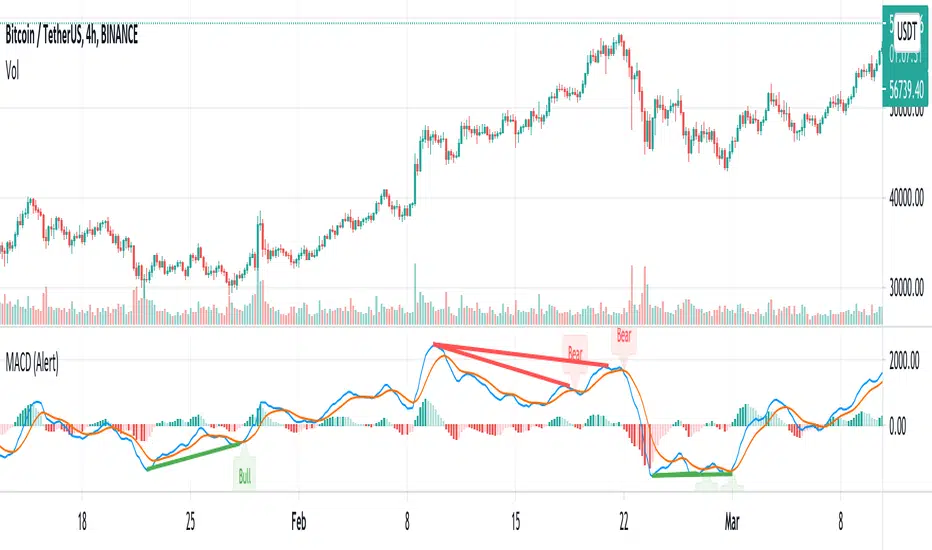
MACD w/ Divergences (Alert)To best use the MACD Divergence indicators, adjust the following settings accordingly.
• MACD Bullish Divergence Under: <0 (lower for larger volatility and more bearish markets)
• MACD Bearish Divergence Above: >0 (higher for larger volatility and more bullish markets)
Key Notes:
1. Set "Once Per Bar" instead of "Once Per Bar Close" alert.
The strategy already uses prior bar close (instead of current bar close) for calculation. This ensures that the signals will stay as they are after fired off, even when the current bar price is still changing.
2. It's OKAY to see the "alert may trigger differently than expected" warning.
Reason why you are seeing this warning is because we used a function called valuewhen() in our strategy. This function does not look at the entire history of data and has several limitations. For instance, on a 30min resolution, at the end of 2018, the function will be able to find past occurrences of BTC exceeding 16k. However, the function won't be able to find such occurrences at the end of 2019. Since our strategy is only concerned with very recent events, these limitations will not impact our results or cause repainting. You can find out more about this in the TradingView Wiki .
MACD w/ DivergencesTo best use the MACD Divergence indicators, adjust the following settings accordingly.
• MACD Bullish Divergence Under: <0 (lower for larger volatility and more bearish markets)
• MACD Bearish Divergence Above: >0 (higher for larger volatility and more bullish markets)
THIS SCRIPT DOES NOT REPAINT AND IS COMPLETELY FREE.
Goodluck Trading!

RealTime Wave Divergence SignalsThis indicator comes from the same algo family as our CryptoWave Pro and SmartWave, but focuses on real time divergence detection.
Unlike the divergence detection in CryptoWave Pro (and pretty much all divergence scripts here on TradingView), this one does not have a 2 bar delay.
The pros of this is that you can catch moves much earlier, but also the main con being that at times you will get faked out.
Using proper risk and trade management this can work out to be a great strategy to use for either manual or automated trading.
Signals produced are entries for Longs and Shorts, but can also be used as exits if you wish.

Multy DIVRSI, Stoch/RSI, Volume, divergence Detector confluence between the 3 conditions .
What is confluence Divergence :
The word divergence itself means to separate and that is exactly what we are looking for today. Typically RSI and Stoch /RSI and Volume will follow price as the BTCUSD declines so will the indicator. Divergence occurs when price splits from the indicator and they begin heading in two different directions.
How to use :
Use the orange circle Plot means Regular Bearish divergence confluence condition
Use the green circle Plot means Regular Bullish divergence Confluence condition

WaveTrend Oscillator + Divergence + Direction Detection +AlertsMake this version of the famous WaveTrend indicator has the following characteristics:
- WaveTrend direction detection
- Customizable overbought and oversold level (set by default just like the original version)
- Possibility to modify the length of the channel (set by default same as the original version)
- Possibility of modifying mobile period (set by default same as the original version)
- Show ONLY overbought sales.
- Show all sales.
- Show ONLY purchases in oversold.
- Show all purchases.
- See histogram.
- See half signal.
- Paint Bars.
- Modification of colors.
Alerts:
The indicator has the following alerts:
- Sales in oversold
- All Sales
- Purchases in oversold
- All Purchases
- Purchases / Overbought sales / Sales
- All Sales / Purchases
- Change WT Direction
NOTE: This single indicator should not be taken as a trading strategy is only a tool for the trader that gives a sense of depth market and potential opportunities for purchase / sale which must be evaluated in the context generally used this indicator to look for positions in areas of overbought / sell, also for detecting differences, other aspects such as the direction of Wavetrend, levels, histogram, etc, also provide useful information.
Release Notes: Add a field to change reaction and color change direction WT, is set to 1 as fast (default), better greater number address filter but is slower.
Release Notes: Add a Hidden Divergences detector and Regulars (bulls and the bears), from setup can activate them, also can turn off the labels and leave only the lines, configure it to your liking.
NOTE: SCRIPT IN SPANISH

Double MACD Buy and SellIndicator for strategy that was used in a Forex competition and was a winner. Use double MACD with custom settings, search video on YouTube:
Learn Five Powerful MACD Trading Strategies
Add some tools to analyze the market context a little more:
- Detector of regular and hidden divergences.
- Atlas Zone (detects consolidation that is about to generate a movement)
- Choppines zone configurable (detects if the market is stable or not)
Visualization of entries in trend and counter-trend according to the rules described in the video.
Buy and sell alerts.
Note: I do not recommend using only this indicator as an investment strategy, it is another tool that must be complemented with a market study by the trader.
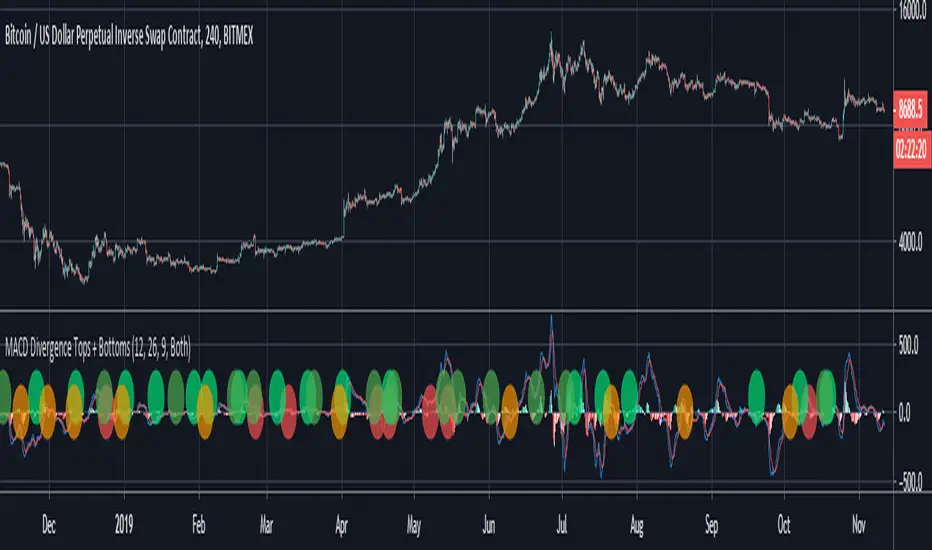
MACD Divergence Tops + BottomsMACD Indicator which plots local peaks and troughs in divergence.
"Classic" Divergence is specified as:
- A higher price, with reduced MACD high --> Potential Sell Point
- A lower price, with higher MACD low --> Potential Buy Point
"Alternative" Divergence is specified as:
- A higher MACD high, with reduced price --> Potential Sell Point
- A lower MACD low, with higher price --> Potential Buy Point
MACD Divergence should be used in combination with other indicators. This indicator identifies local tops and bottoms, with potential for macro trend shifts.
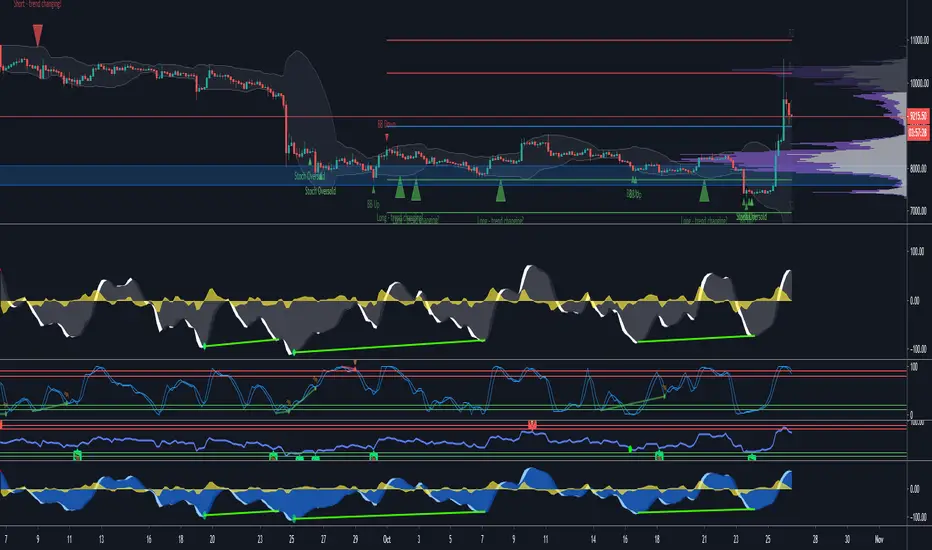
Stochastic Trend Indicator [ChuckBanger]This is a trend indicator based on the calculation of time on stochastic, money flow, rsi and bollinger band calculations. The indicator consists of two lines and a histogram. The histogram is the difference between the two lines. This indicator should be interpreted as a regular MACD indicator.
The indicator can be configured and operated in various ways. It can be used by simply interpret the histogram zero line crossings, or interpret the red and green line crossings alone or both together.
Operating this trend indicator is not difficult, it gives many possibilities of presenting many differnet signals, more than the usual in this type of indicators. In principle, it can be used as a regular MACD. So if you are familuar with MACD, use this the same way and you will be reworded heavily.
How to use it
When the green line is above the red line the time is positive and the price is likely to increase and the opposite is true if red line is under the green line. But the most aggressive user will quickly realize that it also offers the possibility to trade between extremes of the green line and even by divergence between the indicator histogram and price action or green line and price action. Where divergences is more power full.
Divergences
docs.google.com
Divergences can easily be spotted in this Indicator but can also be spotted in several other Oscillators, such as RSI, StochRSI, MACD, CCI, OBV, etc.. and they can be Bullish or Bearish.
Price action (I’m using PA from now on) and Oscillators can follow the same path. It is when they don’t it’s called Divergence. But be aware so you don’t identify them wrongly as they can also be Convergences. Convergences is when PA follows the indicator.
The so called “Divergence” in Stock, Crypto or whatever market you trade is when PA and oscillator are following different paths = PA and Oscillator diverging. They can be strong, medium, weak or hidden, in my link above I also classified them as class A, B and C for strong, medium and weak.
While divergences (class A, B and C) is a sign of reversal being close, hidden divergences is a continuation of the trend pattern. They work 90% of the time although but there is no time frame when it will happen. Many times they create 3 legs up or down when it becomes very strong and can work as an entry as it is time to reserve or continuation of the trend. In this cases the first two is wrong but the last is often very strong.
Bullish divergence
When PA makes a flat bottom or lower low and higher low on Oscillator. The opposite is convergence.
Pay attention to the fact that PA and Oscillator trend is measured from below.
Bearish Divergence
When Price Action makes a flat top or higher high and higher low on Oscillator. The opposite is convergence.
Pay attention to the fact that PA and Oscillator trend is measured from above.
Hidden Bullish Divergence
When Price Action makes a higher lows and lower lows on Oscillator. Hidden Bullish Divergence is telling us that Oscillator is recharging to go back up again. Continuation of an uptrend.
Pay attention to the fact that PA and Oscillator from below (swing lows on the way up). Normally when in uptrend.
Hidden Bearish Divergence
When PA makes higher lows and higher highs on Oscillator. Hidden Bearish Divergence is telling us that Oscillator is creating space to go back down again. Continuation of downtrend.
Pay attention to the fact that PA and Oscillator (swing highs on the way down). Normally in downtrend.
Histogram
You can also traded this indicator with histogram crossing the zero line. When the histogram crosses down below zero line it is a bearish sign and when it crosses up it is a bullish sign

Screener - Multi Timeframe [WYCKOFF ARSENAL]Screener - Multi Timeframe WYCKOFF ARSENAL
The general idea of The Wyckoff Method is that the trader can see the market as well-structured periods of Accumulation , Markup , Distribution and Markdown .
The price of an asset depends on its supply and demand .
There is more than one stock available for trading, and there is more than just Bitcoin on the Cryptocurrency market.
This means that one may choose to trade more than one asset and this perspective opens up a world of opportunities in which Supply and Demand are the masters.
For example, you have invested some money in a cryptocurrency, and you wait for it to Markup already.
But it is still in a long period of accumulation - it doesn't move much.
You should leave it and find another crypto that is moving.
To aid in the discovery of such opportunities, a Market Screener is available.
Method used: The Wyckoff Method of course.
The indicators used:
• Optimism Pessimism
• Force
• Technometer
• Momentum
The Wyckoff Arsenal Indicators can be used individually, and they are very useful when trading a single pair.
But the Market Screener can scan for opportunities in a wide range of pairs, or same asset but different trading platforms.
The indicators are based on volume, so the symbols must have volume data for the Screener to work.
Multiple indicator instances can be used to track a specific asset, like Bitcoin.
This way, all Bitcoin data available on TradingView could be used instead of data coming from a single trading platform.
Alerts: Overbought/Oversold conditions, Bollinger Bands crossings, Divergence detection.

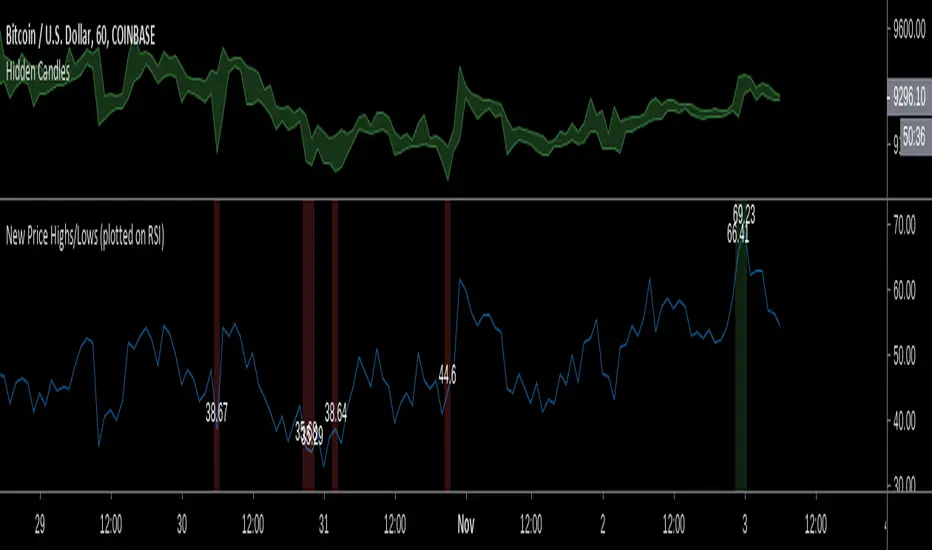
New Price Highs/Lows (plotted on RSI)Rather than rely on existing indicators for bullish/bearish divergence, I'd rather just identify it myself.
This indicator just makes this easier to see (hands-free) the relevant data on the RSI at points where the price hits new highs/lows by colouring the background on the RSI based on price action and also plotting the RSI values at those points so you dont need to keep hovering over the RSI with your mouse.
Stay aware of your lookback setting because it will effect how often the new price highs/lows are highlighted.
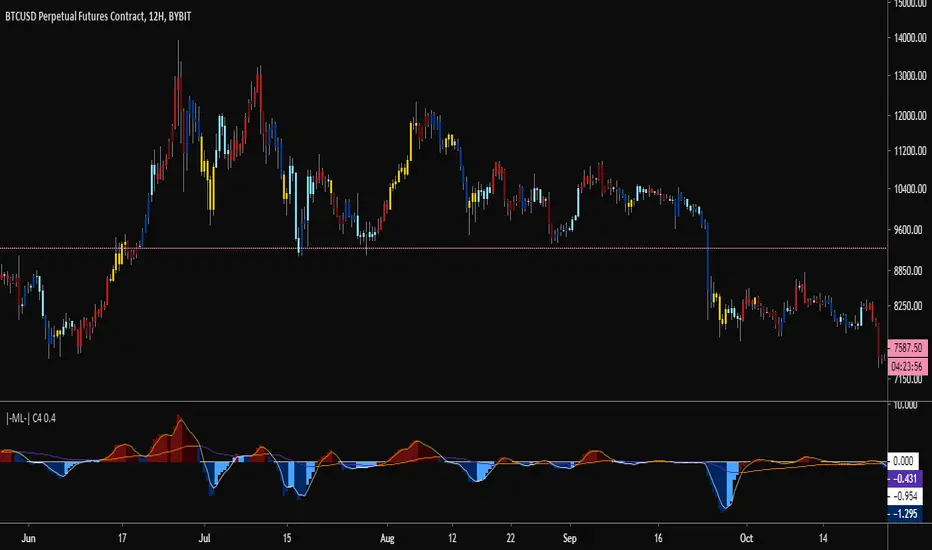
|-ML-| C4 - Amplified Volume Directional Bias OscillatorThis indicator presents an oscillator that suggests volume directional bias.
Colour switch (blue to ice-blue and red to maroon) confirms oscillator turnaround.
Confirmed divergences flag a trend change that can be used as a trade entry aid.
I suggest changing your candlesticks as follows:
Border: black
Wicks: grey
MAC-Z & MACD Leader signal [ChuckBanger]This is a combination of my MACD Leader script and MAC-Z with option to add Laguerre filter. The advantage of the MAC-Z over MACD is that it is a more accurate and “assumption-free” indicator that can more accurately describe how a market actually perform. But you can use this as a regular MACD indicator.
Crossovers signals
The MAC-Z line and signal line can be utilized in the same way as a stochastic oscillator, with the crossover between the two lines providing buy and sell signals. As with most crossover strategies, a buy signal comes when the shorter-term, more reactive line – in this case the MAC-Z line (blue line) crosses above the slower signal line (orange line). For example, when the MAC-Z line crosses below the signal line it provides a bearish sell signal.
Zero line crossing
The zero cross strategy is based on either of the lines crossing the zero line. If the MAC-Z crosses the zero line from below, it is a signal for a possible new uptrend, while the MAC-Z crossing from above is a signal that a new downtrend may be starting. This is special powerful if the lines has a fast up or down movement but the price action doesn't reflect that movement.
Divergences
Bearish and bullish divergences is my favorite signals. When price action and oscillators follow the same path it is called Convergences, when they don’t, it’s called a Divergence. Don't confuse the two because they have not the same meaning. But be aware that for example during consolidation or low liquidity, some small divergences between price and indicators might form, but that doesn't mean we should consider them as real divergences.
There is many different types of divergences. It is easier to show a picture then explaining it so I recommend you to check out the link below. Especially the top image. It sums this up very well
medium.com
MACD Leader
The MACD leader is only showing the crossing of MACD as a vertical line
Green vertical line = MACD Leader Bullish Cross
Red vertical line = MACD Leader Bearish Cross
MACD Leader:
MAC-Z:
More Information
cssanalytics.wordpress.com
en.wikipedia.org
drive.google.com

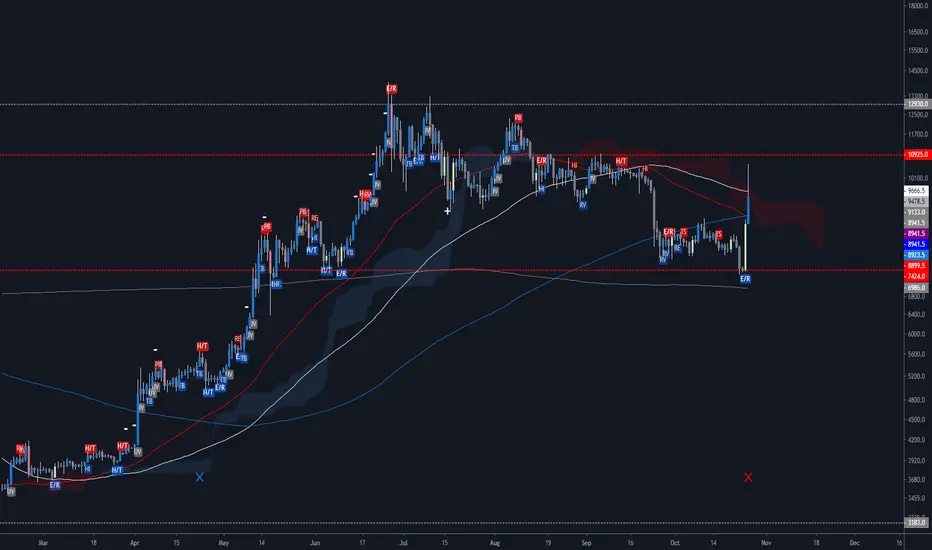
NeruSuite_v5NeruSuite_v5
_______________
NeruSuite combines different indicators in one tool and plots them mostly as labels in the chart.
All indicators are using absolute standard settings and are universal for all markets.
You can adjust the Ichimoku Cloud. All other used indicators are adjustable in color and position.
Implemented indicators:
- Showing extreme stochastic RSI conditions as + and -
- SMA Death + Golden crosses (SMA50 & SMA200)
- Three plotted SMAs, 50, 100 and 200
- BTL Lines
- Barcolors Stochastic Breakup & Breakdown
- Tenkan, Kijun
- Senkou A & B
- Ichimoku Cloud
- Engulfings (E/R)
- Haramis (H/T)
- Tweezer (H/T)
- Railroads (E/R)
- Horizontal Short-Longterm Support / Resistance Levels
- Pullbacks (PB)
- Trend Buys / Trend Sells (TS/TB)
- Hidden & Regular Bull- & Bear Divergences (HI, RE)
- Reversal, Increasing & Decreasing, Oversold & Overbought Volume (RV, DV, UV)
These indicators work well together and will help you to spot Highs / Lows or also Trend-Follow setups.
___________________________
Warm regards,
Neru
Liens Wavetrend.V2 - DivergenceWavetrend.V2
1. showing Regular Bearish and bullish divergence.
2. showing Hidden Bearish and bullish divergence.
3. Alerts for buy and sell signals.

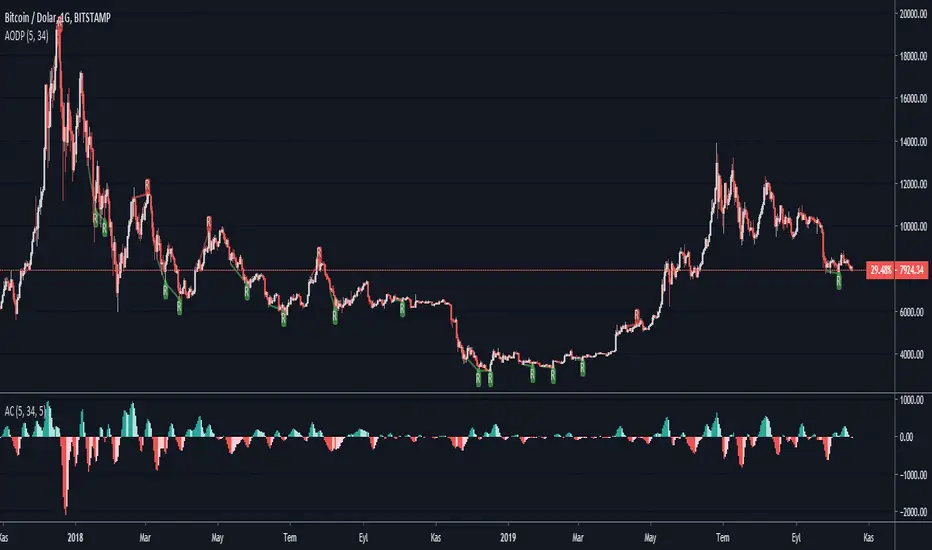
Accelerator Oscillator Divergence PointerThis script points regular and optionally hidden types of bullish and bearish Accelerator Oscillator divergences on the chart by drawing the divergence lines and optionally labels.
Hidden divergence is disabled by default, it can be enabled over settings window.
Regular divergence is enabled by default, it can be disabled over settings window.
There is an option to display the price channel additionally.
Alerts for all types of divergences.
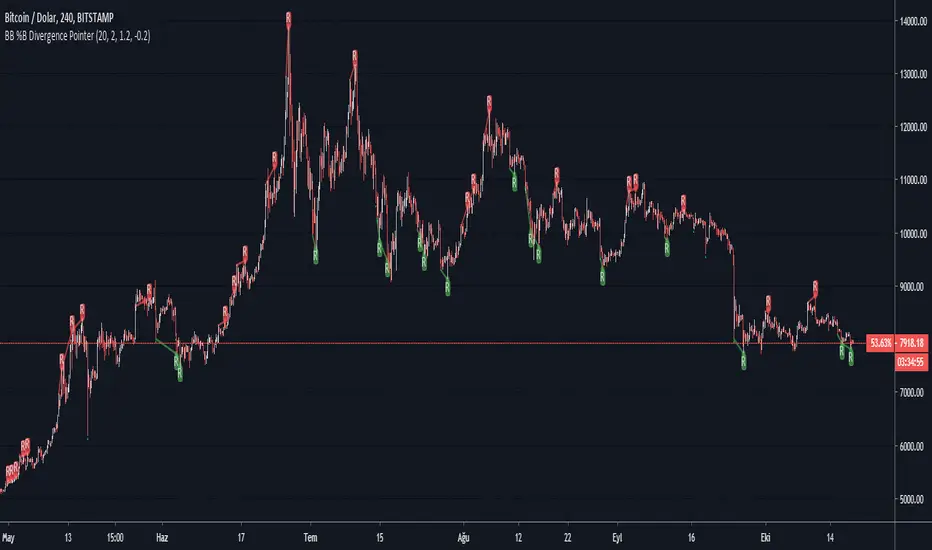
BB %B Divergence PointerThis script points regular and optionally hidden types of bullish and bearish Bollinger Band %B divergences on the chart by drawing the divergence lines and optionally labels.
Hidden divergence is disabled by default, it can be enabled over settings window.
Regular divergence is enabled by default, it can be disabled over settings window.
There is an options to display the price channel , bollinger band , Oversold and overbought levels additionally.
Supports alerts for all types of divergences.
Fisher Transform Divergence PointerThis script points regular and optionally hidden types of bullish and bearish Fisher Transform divergences on the chart by drawing the divergence lines and optionally labels.
Hidden divergence is disabled by default, it can be enabled over settings window.
Regular divergence is enabled by default, it can be disabled over settings window.
There is an option to display the price channel additionally.
Added alerts for all types of divergences.

OBV Divergence PointerThis script points regular and optionally hidden types of bullish and bearish OBV divergences on the chart by drawing the divergence lines and optionally labels.
Hidden divergence is disabled by default, it can be enabled over settings window.
Regular divergence is enabled by default, it can be disabled over settings window.
There is an option to display the price channel additionally.
Added alerts for all types of divergences.

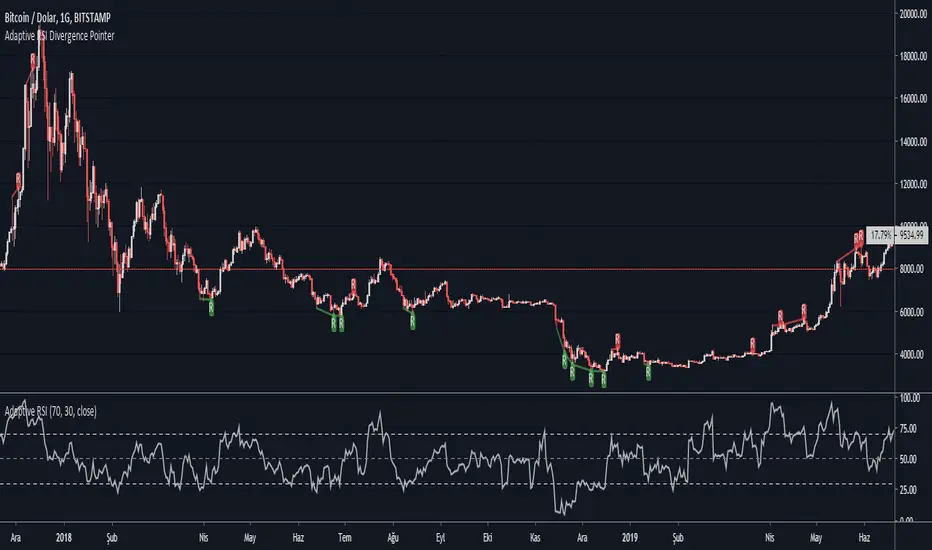
Adaptive RSI Divergence PointerThis script points regular and optionally hidden types of bullish and bearish Adaptive RSI divergences on the chart by drawing the divergence lines and optionally labels.
Hidden divergence is disabled by default, it can be enabled over settings window.
Regular divergence is enabled by default, it can be disabled over settings window.
There is an option to display the price channel additionally.
Added alerts for all types of divergences.
What is Adaptive RSI :
This is an implementation of John Ehlers’ Adaptive RSI , as described in his book Rocket Science for Traders: Digital Signal Processing Applications (2001-07-20).
It does not need a length value to be specified by user. It adopts itself perfectly to the price chart.
It integrates the idea of automatically determining the Dominant price cycle through a Homo-dyne Discriminator, and using half of a cycle length as the input for the RSI . Not only determines the most effective range for the RSI by setting it based on the cycle, but also makes the RSI PDF (Probability Distribution Function) adjustable as shown in John Ehler's papers.
Works just like a normal RSI , but should have less false signals.
CCI Divergence PointerThis script points regular and optionally hidden types of bullish and bearish CCI divergences on the chart by drawing the divergence lines and optionally labels.
Hidden divergence is disabled by default, it can be enabled over settings window.
Regular divergence is enabled by default, it can be disabled over settings window.
There is an option to display the price channel additionally.
Added alerts for all types of divergences.
