Phân kỳ

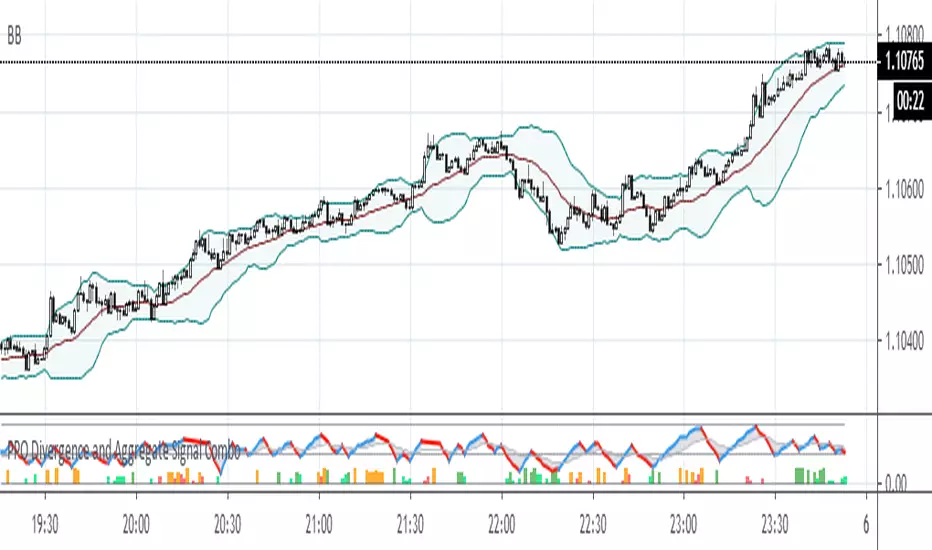
PPO Divergence and Aggregate Signal ComboThis is a further development of the last two posts on aggregated signal generation. It shows how to implement the idea in conjunction with another indicator. In this case general rule for long and short entry: the aggregated curve (gray) must cross the mid-line. Colored columns serve as an early warning. Settings were tested with EURUSD in 5m, 30m and 1H TFs.
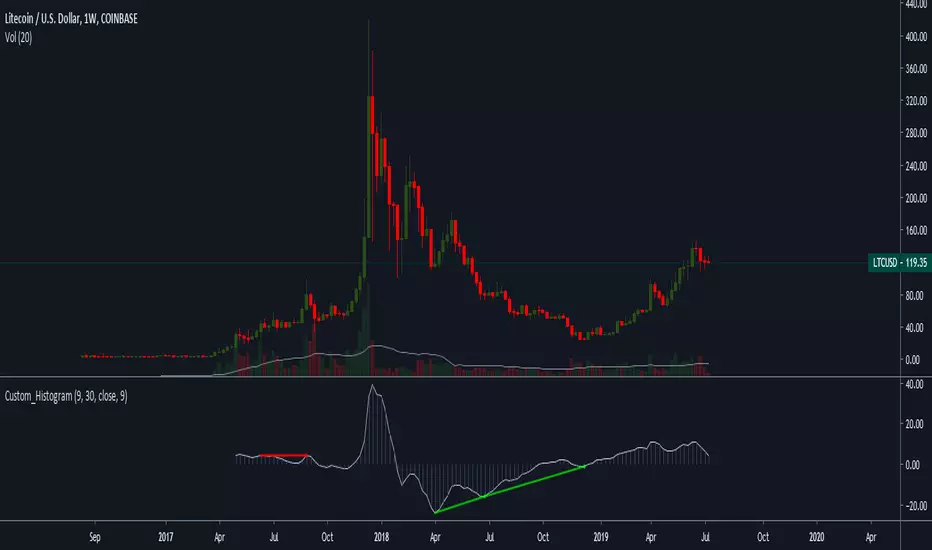
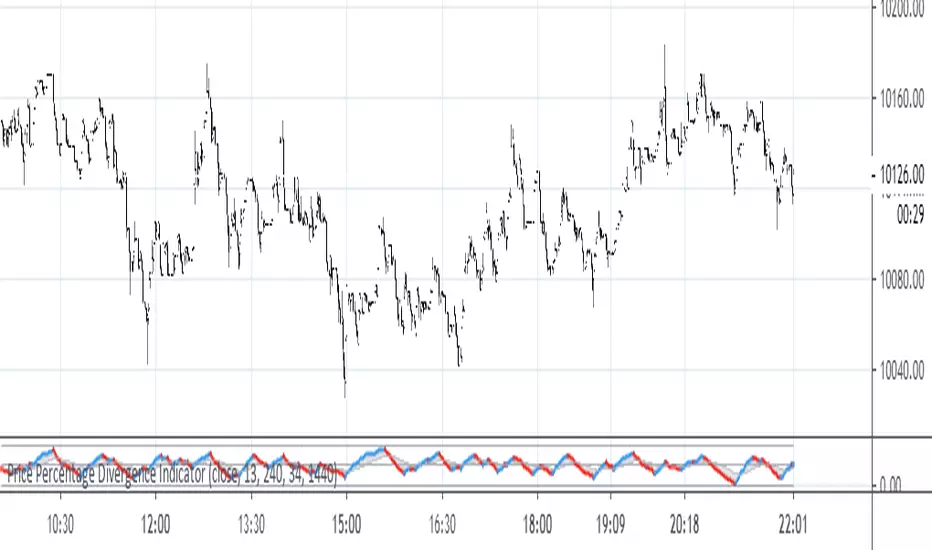
Price Percentage Divergence IndicatorThis is a price percentage divergence ( PPO ) indicator. It may as well be called a turning points indicator.)
MG - Real time RSI divergenceShows RSI divergences in real time (as soon as bar closes in divergence instead of waiting for an RSI pivot).
There are alerts included on these events so you are immediately made aware of divergence.
Adjustement:
It works by detecting a break of a previous high or low and then comparing the RSI value at the last break to the current break. Therefore, by decreasing the adjacent candles required for a pivot, you increase the number of divergence checks and therefore divergence readings. As with many indicators, with higher the values, you get less but more significant signals. (This can be visualized with the plot pivot lines option)
RSI period can be adjusted


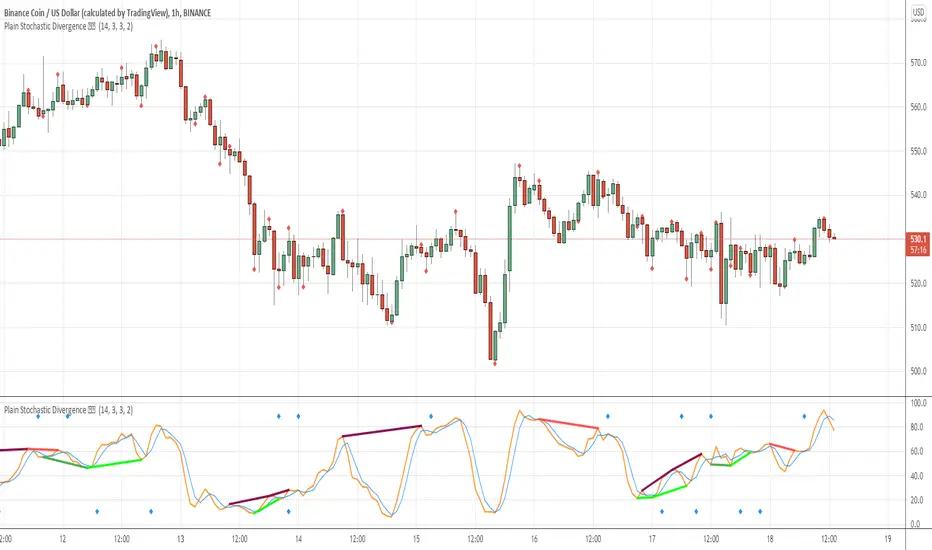
Plain Stochastic Divergence Stochastic Divergence
Plain simple way of calculating divergences
We all have times when we want to see just the divergences and nothning else
This script is minimalised to visualize that
references :
// stochastic // divergence // stoch //
PriceDivergence (ps4)This script implements price divergence module using signals from several factors like:
RSI, RSI Stochastic, MACD, Volume MA, Accumulation/Distribution, Fisher Transform and CCI

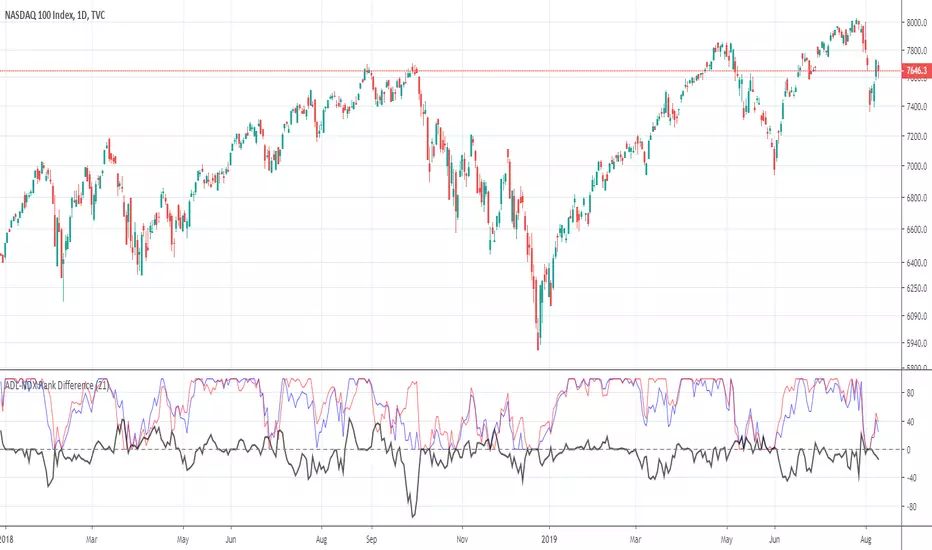
ADL-NDX Rank Difference-Buschi
English:
An expansion of the Advance Decline Line of the NASDAQ. It can be interesting to compare the Advance Decline Line with the corresponding benchmark index. I therefore made a ranking (0 to 100) based on the performance over the last days (default: 21 days). The difference is the target figure and ranges between -100 (bearish divergence) to +100 (bullish divergence).
Deutsch:
Eine Erweiterung der Advance Decline Line der NASDAQ. Oft möchte man den Verlauf der Advance Decline Line mit dem zugehörigen Leitindex vergleichen. Daher habe ich für beide ein Ranking (0 bis 100) erstellt auf Basis des Verlaufs über die letzten Tage (Standardwert: 21 Tage). Die Differenz stellt dabei die Zielgröße dar und schwankt zwischen -100 (bärische Divergenz) und +100 (bullische Divergenz).
ADL-SPX Rank Difference-Buschi
English:
An expansion of the Advance Decline Line of the NYSE. It can be interesting to compare the Advance Decline Line with the corresponding benchmark index. I therefore made a ranking (0 to 100) based on the performance over the last days (default: 21 days). The difference is the target figure and ranges between -100 (bearish divergence) to +100 (bullish divergence).
Deutsch:
Eine Erweiterung der Advance Decline Line der NYSE. Oft möchte man den Verlauf der Advance Decline Line mit dem zugehörigen Leitindex vergleichen. Daher habe ich für beide ein Ranking (0 bis 100) erstellt auf Basis des Verlaufs über die letzten Tage (Standardwert: 21 Tage). Die Differenz stellt dabei die Zielgröße dar und schwankt zwischen -100 (bärische Divergenz) und +100 (bullische Divergenz).

Price Divergence + OBV Candles + EMAPrice Divergence
Fisher Transform
MACD
Stochastic
BB%
OBV Candles
Positive or negative obv overlay on candles
EMA Cloud + cross trend bar
Fav and I'll add you.

(JS) RSI Divergence OscillatorPretty simple really - when the oscillator is positive it means that there's bull RSI divergence, negative means there is bear RSI divergence.
Simple formula to make it, Rate of Change on RSI vs. Rate of Change on price, smoothed out using an EMA.

Crypto InfoPanel (MD)Credits to Daveatt for helping me fix the momentum =)
This panel shows the following:
-BTC LTC ETH prices on different exchanges listed on the panel.
-EMA above/below price 10/20/30/40/50/60/100/200/400 in form of symbols ( based on the "Momentum lines" script)
-MTF Momentum direction in form of symbols 1/3/5/15/30/45/1h/2h/4h/8h/12h/1D/1W/1M (based on the Momentum Divergence script waves)
This script allows you to see every momentum direction of every time frame, put all together into one panel. Making your life easier when scalping with "Momentum divergence" script.
Notes:
If you want me to plot more data into the panel, post a comment what else to add or how to improve the panel.

Simple 𝔇 Oscillators𝔻𝕚𝕧𝕖𝕣𝕘𝕚𝕟𝕘 𝕆𝕤𝕔𝕚𝕝𝕝𝕒𝕥𝕠𝕣𝕤
No Offset's, No delay
There is 6 Oscillators diverging in release version
For micro tf charting -requires manual tune on input menu

RSI Chart by Atilla YurtsevenRSI Chart helps me to spot divergences easily. Give this a try.
Disclaimer: This is not financial advice
Trade safe,
Atilla Yurtseven

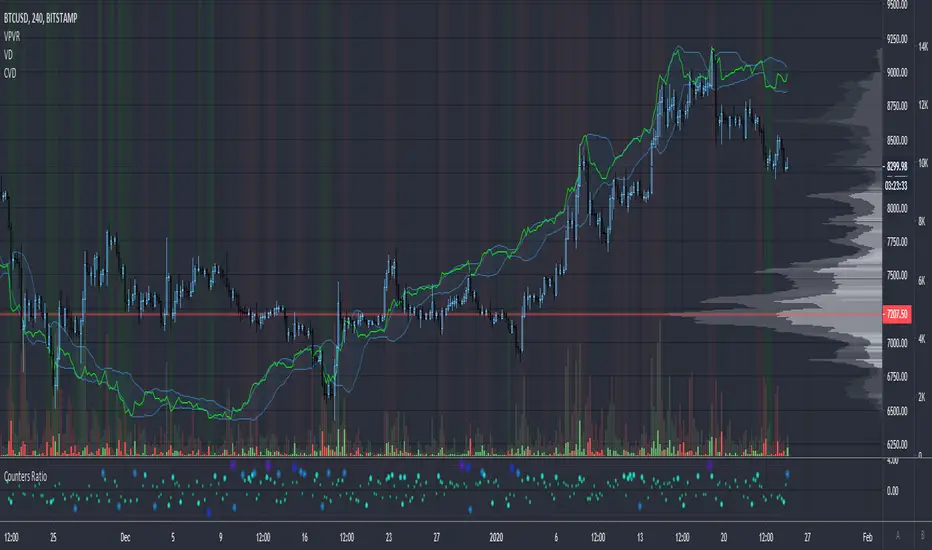
Cumulative Volume Delta (CVD)Cumulative Volume Delta or simply CVD is the accumulation of the Total Volume Delta .
It starts accumulating from the beginning of the available volume data.
It only shows meaningful information for symbols with volume data.
It does not change its shape when changing timeframes.
How to use it:
You can start using it by searching for divergences with the price.
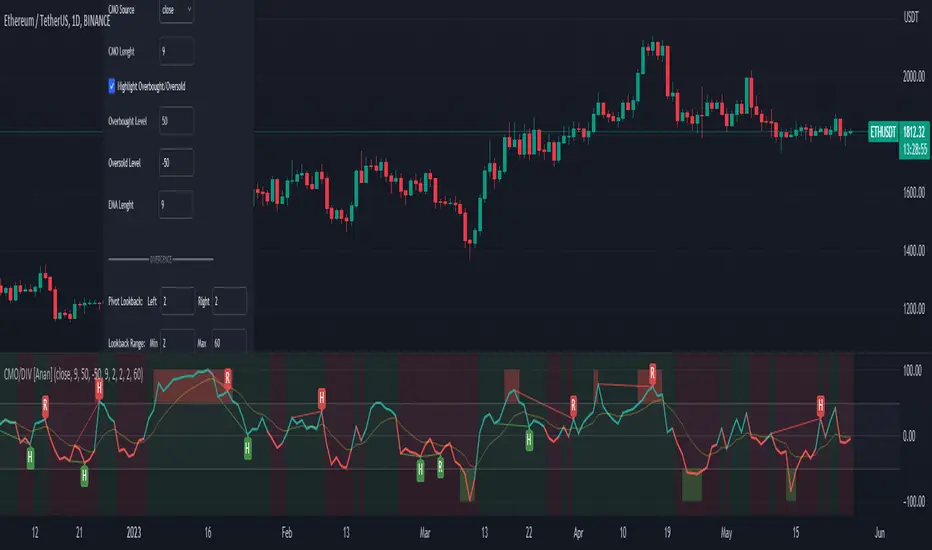
Chande Momentum Oscillator(CMO) & EMA with Divergences Hello Friends,
* Chande Momentum Oscillator (CMO) + EMA + (Regular/Hidden) Divergence + Bullish/Bearish background colors.
* You can edit your options from indicator settings.
MFI and RSI wih (R/H Divergence)Hello Friends,
* RSI + MFI + (Regular/Hidden) Divergence + Bullish/Bearish background colors.
* you can edit your options from indicator settings.

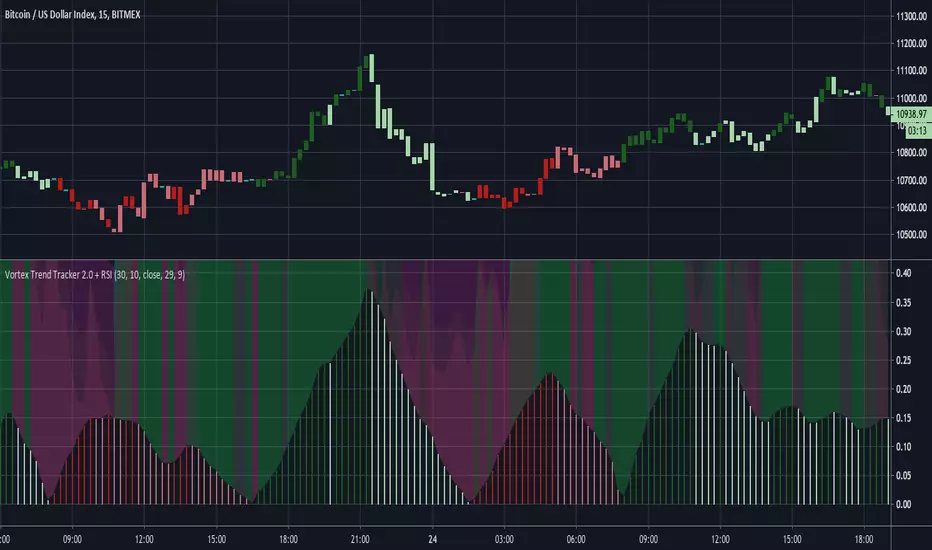
Vortex Trend Tracker 2.0 + RSIHere's an updated version of our Vortex Trend Tracker indicator.
Here's the link to the original if anyone wants to read more about the Vortex or see the first version:
We've added in 4 rsi's of varying lengths for this second version(2 fast and 2 slow) that create the background color effect.
RSI Divergence with candle coloringHey there
This is a script requested by a friend
It's based on the RSI Divergence script from Ricardos Santos :
This version will color the candles instead of drawing an extra panel below the main chart
I set this script on Invite-only cause it's only for a friend to be used.
However, if interested, hit me up and I'll add you
Enjoy
Dave

RSI with divergence finderCustom Relative Strength Index
Features:
- Divergence finder
- Oversold / Overbought highlight


Willams %R with 13 EMA and Divergence FinderWilly 13 EMA
Features:
- Divergence finder
- Extreme conditions highlight