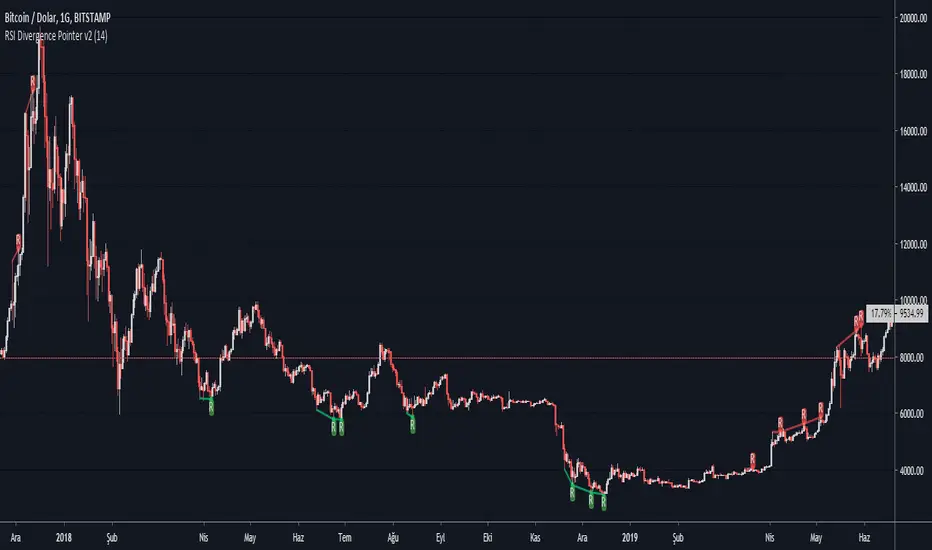
RSI Divergence Pointer v2This script points regular and optionally hidden types of bullish and bearish RSI divergences on the chart by drawing the divergence lines and optionally labels.
Hidden divergence is disabled by default, it can be enabled over settings window.
There is an option to display the price channel additionally.
Added alerts for 4 types of divergences
Titles and messages are the same:
"Regular Bearish Divergence"
"Regular Bullish Divergence"
"Hidden Bearish Divergence"
"Hidden Bullish Divergence"
Phân kỳ
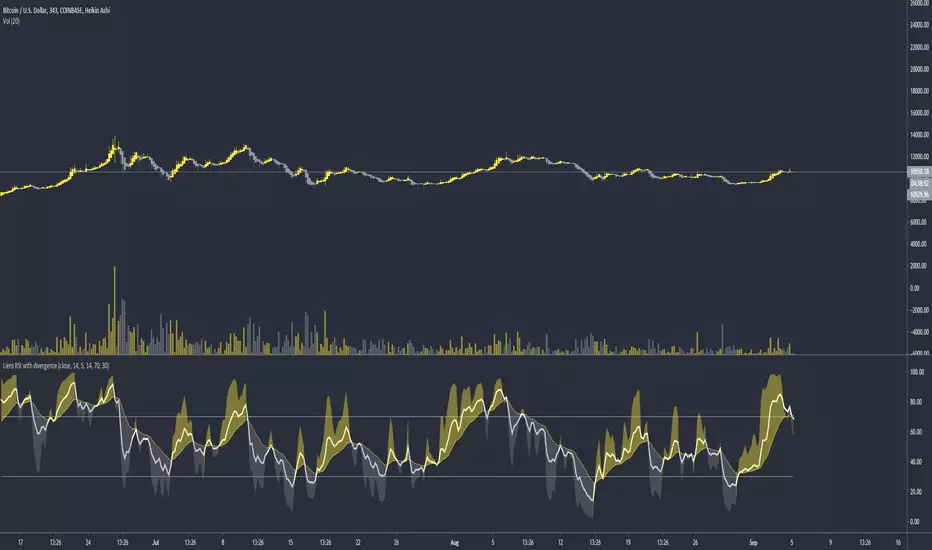
Liens stoch RSI DivergenceStochastic Rsi with divergence.
1. Bearish Divergence
2. Bullish Divergence
3. Hidden Bearish Divergence
4. Hidden Bullish Divergence
5. Alerts for all conditions.

Lachie 3.0: DDS (Divergence Detection System)
Introduction:
The purpose of this indicator is to assist users in detecting bullish divergence across any time frame. Divergence is the main component of my methodology, this on display at Blockchain Education (charts, calls, etc..). This is not a signal script, it is purely for educational purposes and should only be used as an indicator to invest further time in TA.
How to interpret:
When a unique event occurs in the market the logic of the code will trigger and display a green X underneath the candles on your chart. The green X means that the code is detecting bullish divergence. The chart may draw several Xs in one location.
What should I do when an X is drawn:
As this is an educational indicator, I can only recommend that once an X is drawn you should pay further attention to the currency/stock (do further Technical analysis). In some market conditions this indicator can be used and automated as an appropriate buy signal, however due to its primitive nature it can go wrong on the rare occasion.
What time frames is this indicator best on:
This indicator was designed on a 1 hour chart. However, it does perform quite well on the daily, 4 and 6 hour charts. Its performance is acceptable on 15 and 5 min for day trading.
FAQ:
Should I buy when I see a green X?
I will not recommend any purchases without first proper TA. Majority of the time the indicator will correctly fin the bottom however in extreme down trends the code will display fake Xs. Upon proper TA you will see how these are fake, but if you rely on a signal, you may get caught out.
I am getting too many Xs on my chart?
The logic of the code may not support some lower time frames, which will result in a lot of Xs.
Some divergence will complete over a large amount of candles, which can also cause a cluster of signals.
In a down trend occasionally the logic cannot correct interpret the weakness in the market.
Is this indicator applicable to any market?
Yes, although the indicator was developed based on Crypto Currency markets, the indicator is usable and in most instances more accurate on traditional markets.
Will there be future updates released?
As the code ages and further development is made, updates including increase accuracy for automation and signals may be released. This is really released for educational support. these updates may be released under a separate indicator listing.
This is an earlier derivative of current indicator with bullish and bearish divergence with higher accuracy (signal) script. This is for educational purposes only to aid people following my calls and methodology at Blockchain Education.
Images of indicator:
Created and owned by Lachlan Schahinger. (2018)

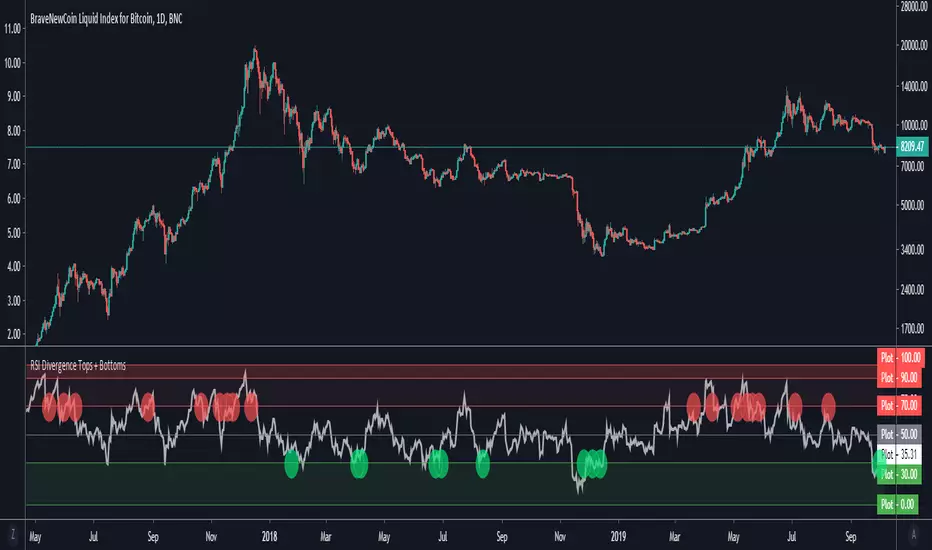
RSI Divergence Tops + BottomsRSI Indicator which plots local peaks and troughs in divergence.
Divergence is specified as:
- A higher price, with reduced RSI --> Potential Sell Point
- A lower price, with higher RSI --> Potential Buy Point
RSI Divergence should be used in combination with other indicators. This indicator identifies local tops and bottoms, with potential for macro trend shifts.
Read more about trading RSI Divergence on Investopedia here: www.investopedia.com
InfoPanel Divergence IndicatorThis panel spots divergences of some well knonw indicators. It may be usefull because you have all indicators in one panel only.
Also, you can check on chart which indicator gives better results of each pair on stock or index or crypto.
TO DO: to add custom indicators.
thanks to: RicardoSantos for his script of panel coding
Tradingview scripts
Other members of TV community (I cannot remember the source and inspiration of all snipets)
Please use comment section for any feedback.

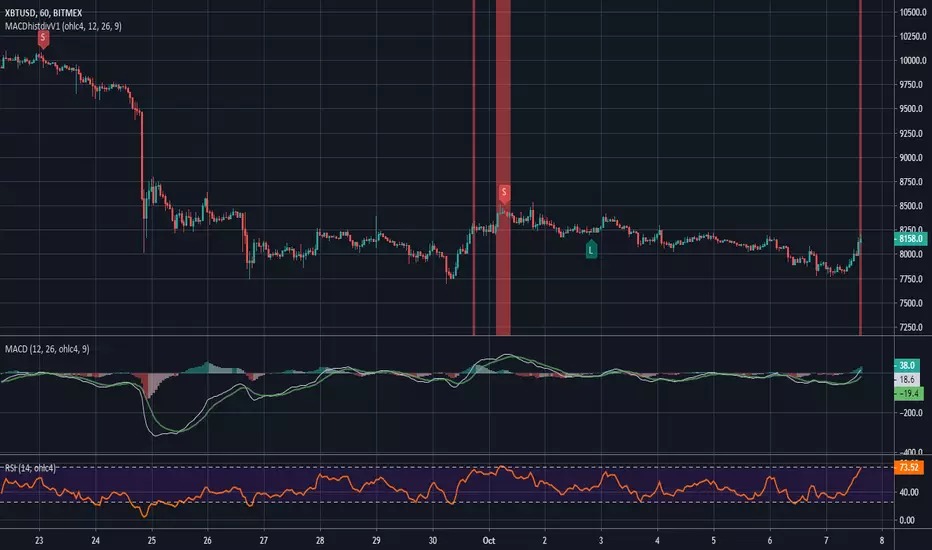
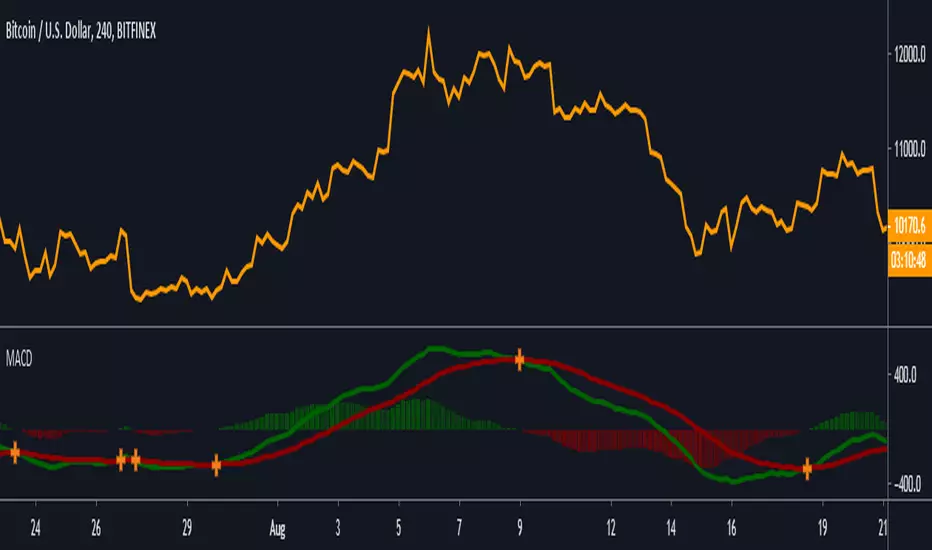
MACD and RSI divergence by Rexio v2Hi everyone!
I wrote this indicator for intraday trading and it cannot be use only by itself you need to at least draw some S/R lines to make it useful. It is based at MACD histogram and gives signal when it sees divergence on MACD/RSI/MACD's Histogram (or all at once - settings) when macd's histogram switchs trend. Im using it to playing with a trend most of the time looking for hidden divergence at higher time frame and after that looking for regular divergence at lower time frame.
Im not a computer programist nor professional trader so it is only for educational purposes only.

MACD histogram divergence by Rexio v1Hi everyone!
I wrote this indicator for intraday trading and it cannot be use only by itself you need to at least draw some S/R lines to make it useful. It is based at MACD histogram and gives signal when it sees divergence on MACD's Histogram when macd's histogram switchs trend. Im using it to playing with a trend most of the time looking. It highlights candles which can give good singnals to play with a trend (its based on ema200 and RSI overbought and oversold zones).
Im not a computer programist nor professional trader so it is only for educational purposes only.
Fisher Transform DivergenceEhler's Fisher transform with instant confirmation divergences.
Scheduled update is adding hidden divergences, currently under construction
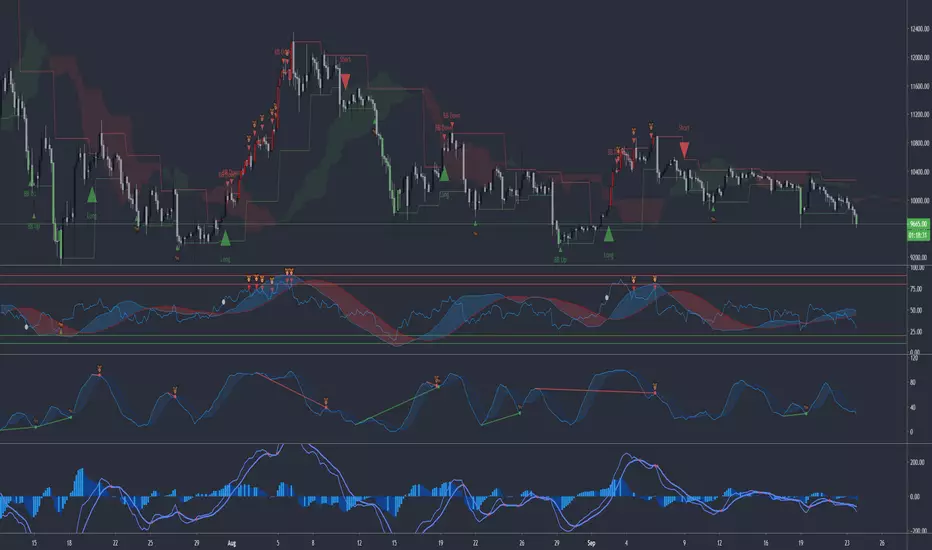
Iconik Trading Suite: Divergence SeekerVisually displays divergences of almost a dozen indicators.
DM for a PowerPoint describing this indicator and the rest of Iconik in detail.
Iconik Trading Suite Indicator List:
ITS-OSC: Oscillators (v2)
ITS-PAA: Price Action Alerts (v2)
ITS-ASR: Auto Support/Resistance
-> Daily (v2)
-> 3 Day (v2)
-> Weekly (v2)
ITS-4TFC: 4 Time Frame Confirmation (v1)
ITS-DIV: Divergence Seeker (v1)

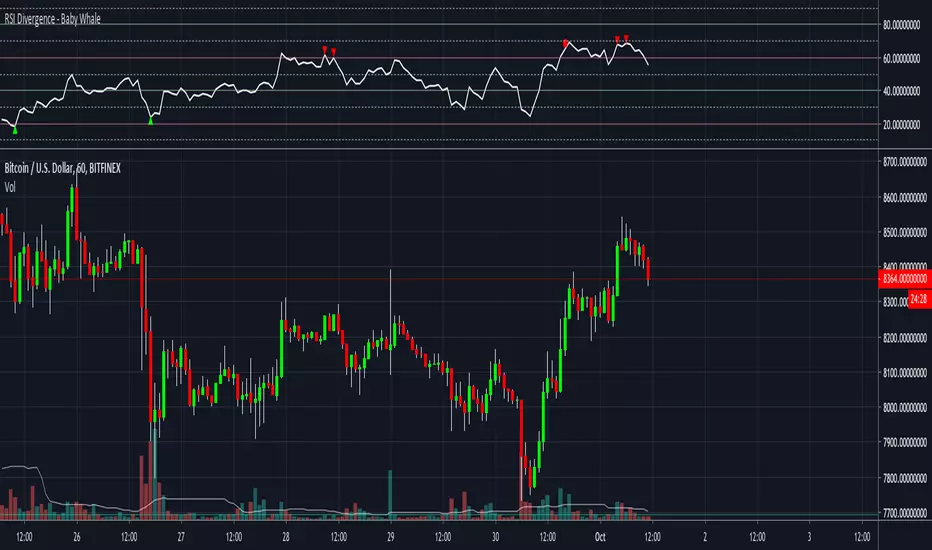
RSI Divergence - Baby WhaleHey guys!
BabyWhale here!
I will open source my scripts, so everyone can use them and update.
In this RSI Divergence script I added Hidden Divergence (beta) as well.
This script will show you:
Bullish Divergence (green triangle)
Hidden Bullish Divergence (green circle)
Bearish Divergence (red triangle)
Hidden Bearish Divergence (red circle)
You can set the RSI values.
I recommend 60 / 40 or 70 / 30.
Last but not least, you can set alarms when a Divergence or Hidden Divergence is found.
Feedback is always welcome!
Credits to @Libertus, I used his script as inspiration.
Good luck with trading!
BabyWhale
RSI/DIV/Trend Lines [Anan]Hello Friends,,
This is the RSI indicator with (H/R) Divergence with Auto Trend Lines Drawer..

Hawkeye Slimboy, (c) Hawkeye Traders LLCHawkeye Slimboy is built upon to Hawkeye Fatboy to provide cleaner divergence signals across multiple markets.

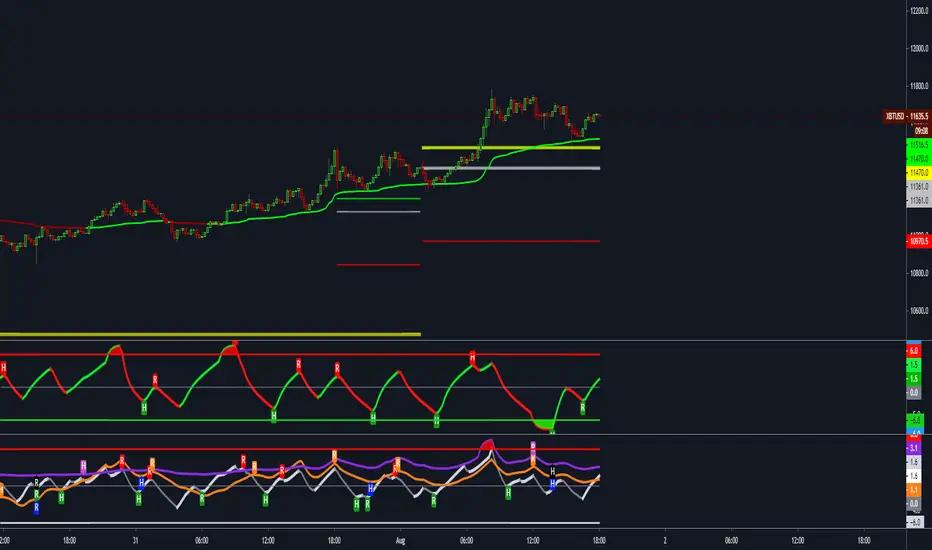
Liens Ultimate Strategy. 1. Long/Short Signal using the macd and stochastic rsi .
2. Bullish/Bearish Divergence on the chart.
3. Low and high pivot Following trend - Support/restiancen.
4. Bar color change when rsi is overbought/oversold. Gives only bar signals when trend is outside MA 50 High/low. Great on low TF. I have also added MA 100 high/low for higher TF.
5. 10 EMA Length for trend following and 2 EMA Length coded with long/short signals.
6. Trend Changing Direction - 20 ma - Chaning color. Can also be used with BB as Center Line.
7. Bollinger Band with long/short signals. Signals are given when BB hit upper/lower. This can give alot of bad signals so this can be turned of so the BB signals only are given when RSI is at overbough/oversold.
8. Standar Ichimouku Cloud.
Everything in this script can be changed and customized to your liking.
Its alerts for everything aswell.
Warning. When you open it up the first time it look messy. :-p
Im going to make more script that will work well with this one.
Enjoy :-)
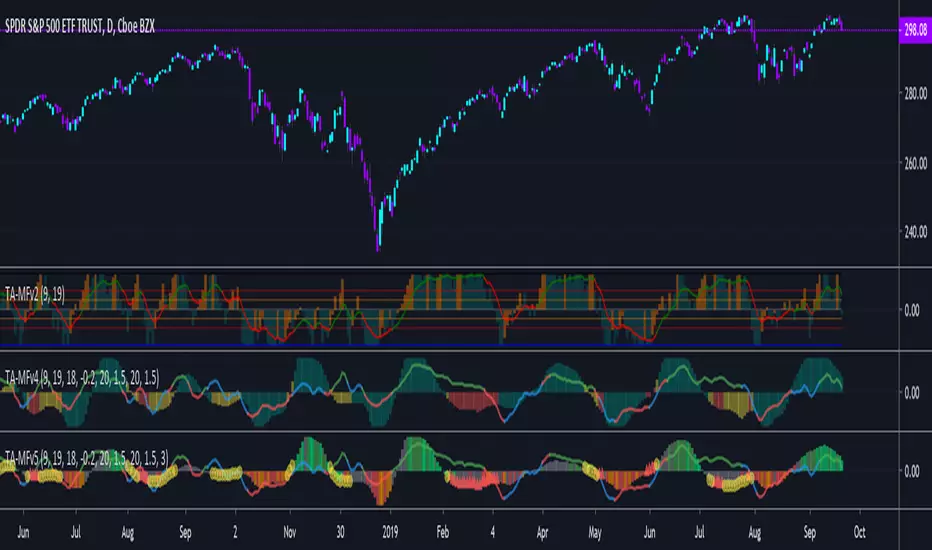
TA-Money Flow-Version5This is the MACD of a stochastic OBV movement indicator, Squeeze Momentum Indicator, and addition coloring for Market Direction Indicator . It is good (right) to work with both price and volume.
In this version we've moved the divergence highlighting to symbols at the ends of the histograms. Same coloring scheme as previous, yellow is divergence of either OBV or SQZ , red is both divergence. In the previous version we added in the "squeeze on - blue" highlighting to show follow through of divergence (or just squeeze/stall). We also added in another old script, but colors so well, Lazybears (Market Direction Indicator, linked below). Also incorporated a 3 color or 5 color scheme from the MDI script as a bool. It works great on any time frame, but you need to have volume data. Not sure where I originally got this (stoch-OBV, somewhere off Tradingview several years ago, thanks to the person who shared), Squeeze/MDI is Lazybear, links below.
Enjoy.
Version 5:
Moved divergence highlighting to symbols on histogram
Added coloring based on MDI
TA-Money-Flow-Version4
TA-Money-Flow-Version3
TA-Money-Flow-Version2
Squeeze-Momentum-Indicator-LazyBear
Market-Direction-Indicator-LazyBear
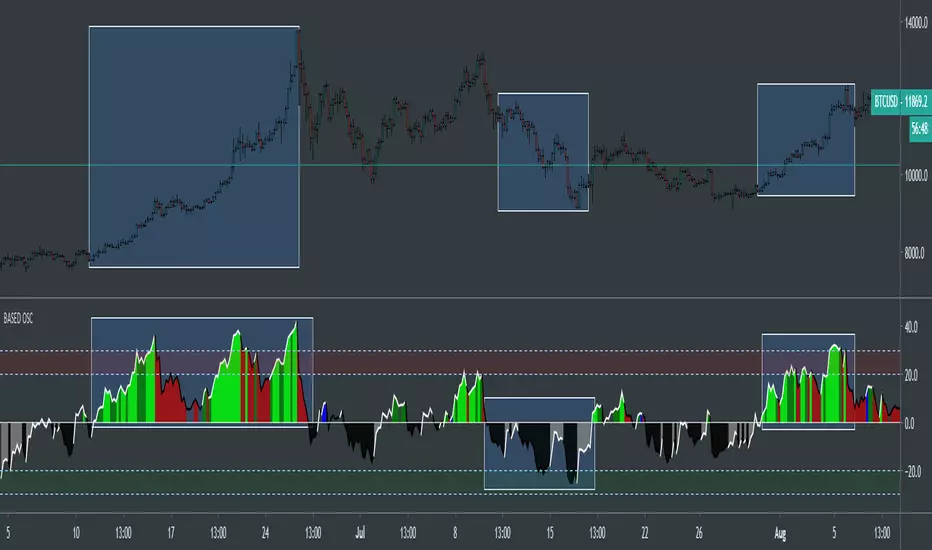
BASED Momentum OscillatorThis is the BASED Momentum Oscillator. I have been working on this for awhile and it's been working really great! Can be used on any security on any timeframe. Spot entries during a bullish or bearish trend, oversold and overbought conditions, can be used to spot divergences.
When the oscillator reaches the red area on top, it means the security is entering overbought conditions. When the oscillator reaches the green area at bottom, it means the security is entering oversold conditions.
Lime = Strong uptrend
Green = Uptrend
Blue = Neutral uptrend
Red = Declining uptrend
Black = Bearish decline
Grey = Cautious recovery from Bearish decline
Blank Area = no signal
Should be used with two more indicators for confirmation.
Enjoy!
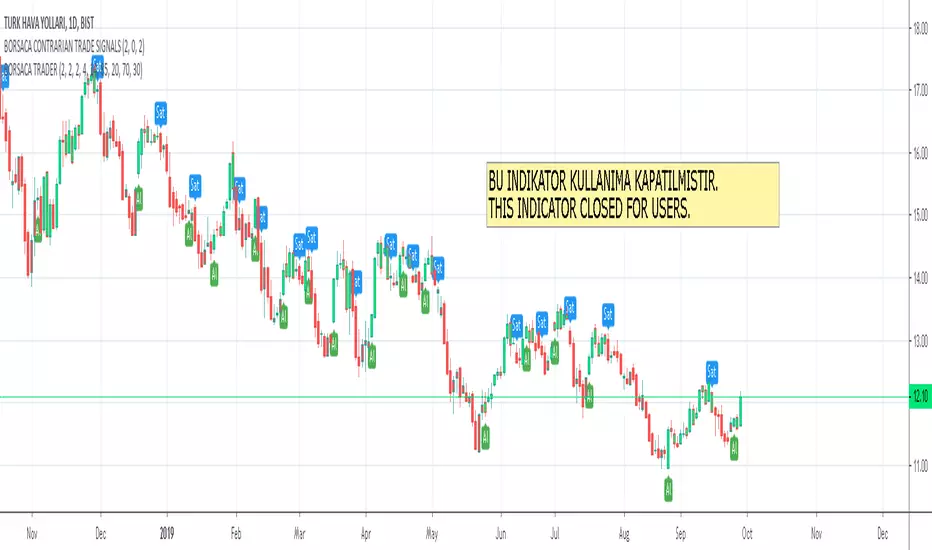
BORSACA CONTRARIAN TRADE SIGNALSThis indicator does NOT REPAINT. If the signal occurs it will be forever. Easy and profitable strategy optimized for Crypto, Foreks and Stock Markets...
This indicator gives you Long and Exit signals all timeframes...
BORSACA CONTRARIAN TRADER is optimized to catch trend movements as soon as possible and maximize profitability.
Strategy tester results. 96% Profitable on BTCUSD Daily scale. Test other markets you want.
WE RELY ON OUR INDICATOR TO THE END. AND WE ASSURE YOU THERE IS NOTHING BETTER THAN THE BORSACA TRADER INDICATOR.
Best regards and happy trading.
Added Auto Support And Resistance ..
Added Auto Fibonacci Levels...
BORSACA CONTRARIAN TRADER indicator is the best option for everybody in financial markets. Check my Profile Page for more information and follow me, like and favorite my indicator and support your positive response and take a message for 10 days trial.
Happy trading. Good luck :)
Long Short Double strategyLong Short Double strategy
Long short strategy with stoploss and take profit.
I use this script for 5min btcusd on Bitmex. (The strategy also works on other exchanges, with some small adjustments in RSI)
Leverage 10x 375% profit in 2 weeks. NO REPAINT.
U can Adjust the RSI for long and shorts entry`s.
Study is Autoview ready. send me a PM for Paid access.
If you like this strategy buy me a Pizza, Dinner, or lambo:)
BITCOIN: 3BMEXTEMinsUUqUwr9GEjNA6ZBsVXB1g6u
LITECOIN: LdG82pyEMMji9Bynw3hvWgUshbMKfiFdJw

MACD [Gu5]Extremely popular indicator MACD (Moving Average Convergence/Divergence)
Same design of my previous indicators
Show Cross Line for a better visualization
```
Setting recommended for BTC
"Fast Length" = 21
"Slow Length" = 55
"Signal Smoothing" = 14
Other markets try
"Fast Length" = 12
"Slow Length" = 26
"Signal Smoothing" = 9
```
--
El MACD (Convergencia/Divergencia de Medias Móviles) es uno de los mas populares indicadores
Continuando con el mismo estilo de diseño de mis anteriores indicadores
Destaca el cruce de medias para una mejor visualización
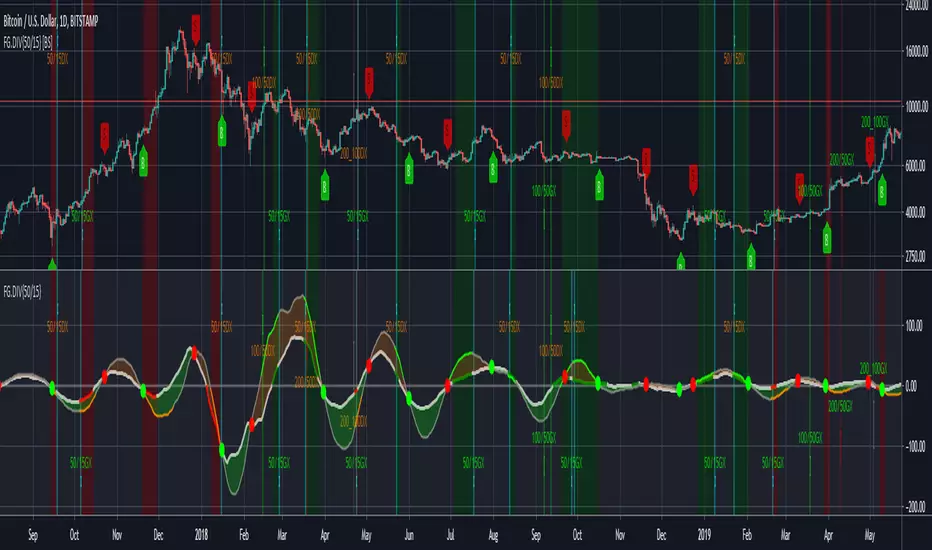
FG-DIVERGENCE V4 {50/15-Series} [Buy/Sell]This script is derived from the FUSIONGAPS V4 {50/15-Series} to generate buy/sell signals.
~ * ~ * ~ * ~ * ~ * ~ * ~ * ~ * ~ * ~ * ~ * ~ * ~ * ~ * ~ * ~ * ~ * ~ * ~ * ~ * ~
Note:
In no way is this intended as a financial/investment/trading advice. You are responsible for your own investment decisions and trades.
Please exercise your own judgement for your own trades base on your own risk-aversion level and goals as an investor or a trader. The use of OTHER indicators and analysis in conjunction (tailored to your own style of investing/trading) will help improve confidence of your analysis, for you to determine your own trade decisions.
~ * ~ * ~ * ~ * ~ * ~ * ~ * ~ * ~ * ~ * ~ * ~ * ~ * ~ * ~ * ~ * ~ * ~ * ~ * ~ * ~
Please check out my other indicators sets and series, e.g.
LIVIDITIUM (dynamic levels),
AEONDRIFT (multi-levels standard deviation bands),
FUSIONGAPS (MA based oscillators),
MAJESTIC (Momentum/Acceleration/Jerk Oscillators),
PRISM (pSAR based oscillator, with RSI/StochRSI as well as Momentum/Acceleration/Jerk indicators),
PDF (parabolic SAR /w HighLow Trends Indicator/Bar-color-marking + Dynamic Fib Retrace and Extension Level)
and more to come.
Constructive feedback and suggestions are welcome.
~ JuniAiko
(=^~^=)v~
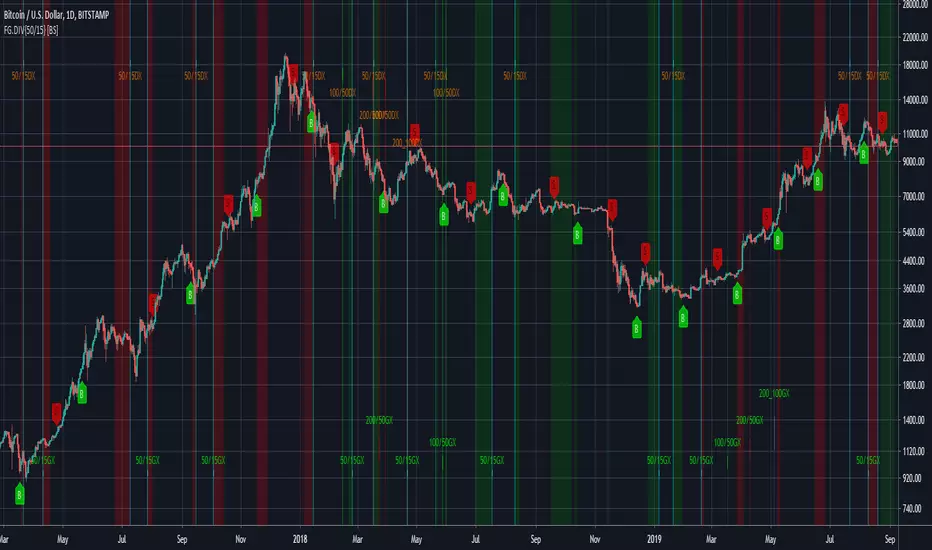
FG-DIVERGENCE V4 {50/15-Series}This script is derived from the FUSIONGAPS V4 {50/15-Series} to generate buy/sell signals.
Green Dot = Buy Signal
Red Dot = Sell Signal
~ * ~ * ~ * ~ * ~ * ~ * ~ * ~ * ~ * ~ * ~ * ~ * ~ * ~ * ~ * ~ * ~ * ~ * ~ * ~ * ~
Note:
In no way is this intended as a financial/investment/trading advice. You are responsible for your own investment decisions and trades.
Please exercise your own judgement for your own trades base on your own risk-aversion level and goals as an investor or a trader. The use of OTHER indicators and analysis in conjunction (tailored to your own style of investing/trading) will help improve confidence of your analysis, for you to determine your own trade decisions.
~ * ~ * ~ * ~ * ~ * ~ * ~ * ~ * ~ * ~ * ~ * ~ * ~ * ~ * ~ * ~ * ~ * ~ * ~ * ~ * ~
Please check out my other indicators sets and series, e.g.
LIVIDITIUM (dynamic levels),
AEONDRIFT (multi-levels standard deviation bands),
FUSIONGAPS (MA based oscillators),
MAJESTIC (Momentum/Acceleration/Jerk Oscillators),
PRISM (pSAR based oscillator, with RSI/StochRSI as well as Momentum/Acceleration/Jerk indicators),
PDF (parabolic SAR /w HighLow Trends Indicator/Bar-color-marking + Dynamic Fib Retrace and Extension Level)
and more to come.
Constructive feedback and suggestions are welcome.
~ JuniAiko
(=^~^=)v~
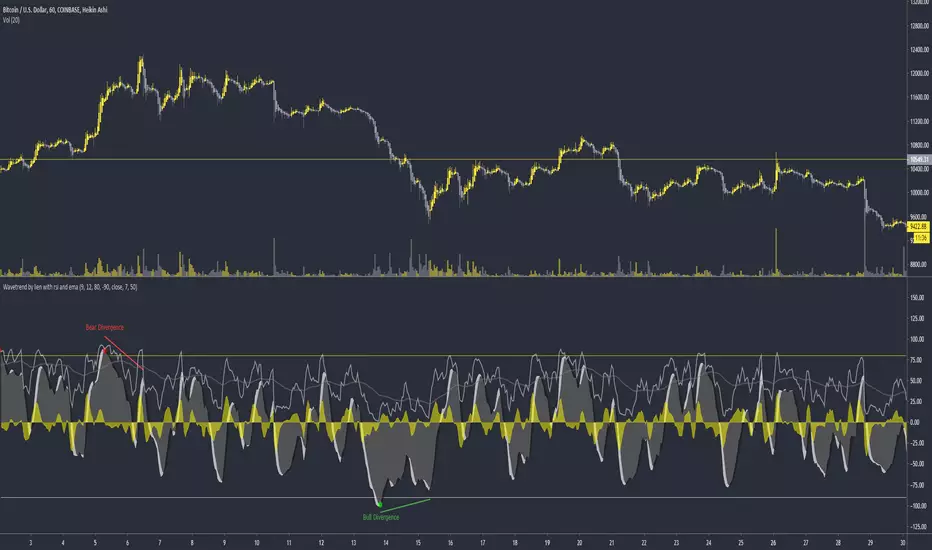
Liens wavetrend with rsi and emaWavetrend with rsi and ema. I would use the rsi and ema on high timeframes like the 4 hour to exit trades when it crosses.
Rsi and ema crosses can also be used to enter without divergence.
Test it out, try it on different TF. Enjoy :-)