Stock trending strategy This is a long only strategy designed maily for stock markets and futures. In general it works best with 1h, however it can be optimized with other timeframes as well.
Components:
VWAP
MACD histogram
EMA 9
Rules for entry
Long :
For VWAP: close is above the vwap daily
EMA: close is above the moving average
MACD histogram is above 0
Short:
For VWAP: close is belowthe vwap daily
EMA: close is below the moving average
MACD histogram is below 0
Rules for exit
This strategy does not have any risk management inside. Instead it exits whenver it receives an opposite signal form the original one used for entry.
If you have any questions let me know !
MUA

Supertrend LSMA long StrategyThis is a long strategy which combines Super trend indicator with LSMA moving average.
In general it tends to works better with long trending markets such as stocks and cryptos using a big timeframe.
The rules are simple
Long entry:
Supertrend is telling us to go long and close of a candle is above moving average
Long exit:
Supertrend is telling us to go short
IF you have any questions, let me know !

Pivot Reversal strategy long onlyPivot Point Reversal Strategy
Pivot point reversal strategy is based on the first support level’s price action during the bullish trend and the first resistance level during the bearish trend . Traders follow the main trend and enter into the trade after reversal analyzing pivot point levels.
This version is an upgraded version, combining the initial pivot point reversal strategy together with one of the most accuracy moving average in my opinion for day trade, the Least square moving average.
At the same time I applied an option to backtest using a date range and a leverage calculator.
The default options are optimized for BTC /USDT 2H charts, using 0.1% comission fee.
If you have any questions, let me know

Vwap mtf Swing Stock StrategyThis is a trending strategy designed for stock market, especially long trending assets such as TSLA, NIO, AMAZON and so on.
Its made of volatility bands and weekly VWAP, in this case daily and weekly.
This strategy has been adapted to go long only.
Rules for entry
For long , we want to enter close of a candle is above vwap weekly, and at the same time the close of a candle cross-under the lower volatility band.
For exit , we want to enter close of a candle is below vwap weekly, and at the same time the close of a candle cross-over the upper volatility band.
This strategy does not have a risk management inside, so use it with caution.
If you have any questions, let me know !

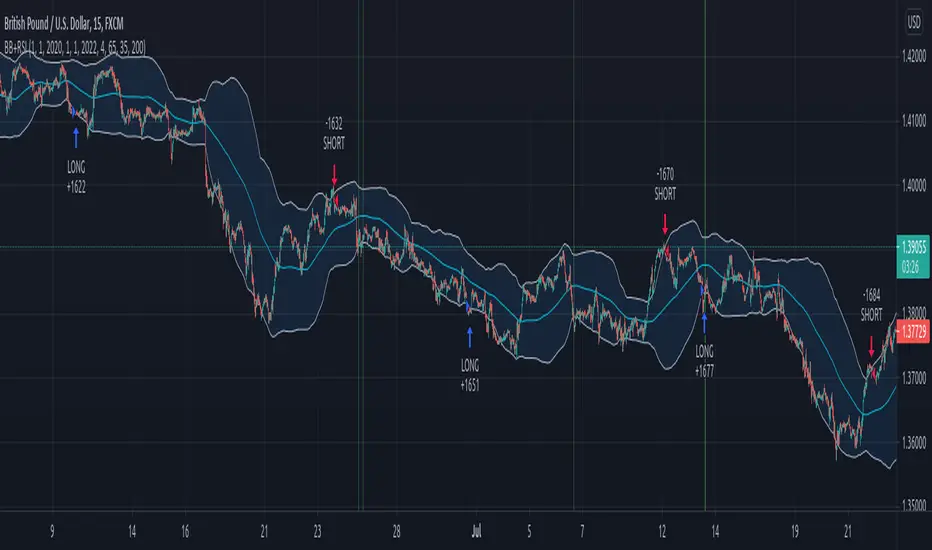
Swing forex strategy 15minThis is a strategy made using BB+ RSI indicators that seems to work great with 15 min major pairs for FOREX.
THe rules for it are simple:
For long we enter when the close of our candle crosses upwards the lower line and rsi crossover the over sold line
We exit long when we have a short entry.
For short we enter when the close of the candle crosses downwards the top line and rsi cross under the over bought line
WE exit short when we have a long entry.
Careful, this strategy has no risk management inside.
If you have any questions let me know !
Boom Hunter ProBoom Hunter Pro is the ultimate indicator for targeting perfect long entries and epic shorts. Boom Hunter comes with a super fast oscillator that uses Ehlers Early Onset Trend (EOT). This is the Center Of Gravity Oscillator (COG) with a super smoothing filter and a roofing filter. This indicator is tuned for 1 hour charts but can be used on any time frame.
Colored bars can be turned on to assist in finding an entry. Purple signifies a drag and potential dump.
Fibonacci lines can be turned on to track price action and find entries/exit.
This indicator follows the same rules as COG. For more information please see my COG HOWTO here:

xGhozt Consecutive Candle CountxGhozt Candle Count simply counts consecutive positive or negative candles, and allows you to get the live statistics of how many times this consecutive candle series occurred in the past, with the probabilities of the next candle to be a reversal, and the average past gains from that reversal. You can select the number of consecutive candles you're tracking, and select a start and end date. When your desired pattern is met by the indicator, it will indicate you on the chart if it's worth shorting or longing the next candle.

[astropark] Moon Phases [alarms]Dear Followers,
today I'm glad to present you an indicator which calculates Moon Phases and let's you set an alert over it.
This is a public free indicator based on the public one by @paaax:
I added my usual alert system logic, plus some more customization inputs for easy coloring.
The lower the timeframe you use it and set your alerts on, the more precise the alert value you get.
Here below the script for backtesting it:
Enjoy!
-- astropark

[astropark] Moon Phases [strategy]Dear Followers,
today I'm glad to present you an indicator which calculates Moon Phases and let's you backtest the simplest strategy over it: buy/sell on full moon and do the opposite on new moon.
This is a public free indicator based on the public one by @paaax:
I added my usual backtesting logic, plus some more customization inputs for easy coloring.
The lower the timeframe you backtest on, the more backtesting data are effective.
Enjoy!
-- astropark

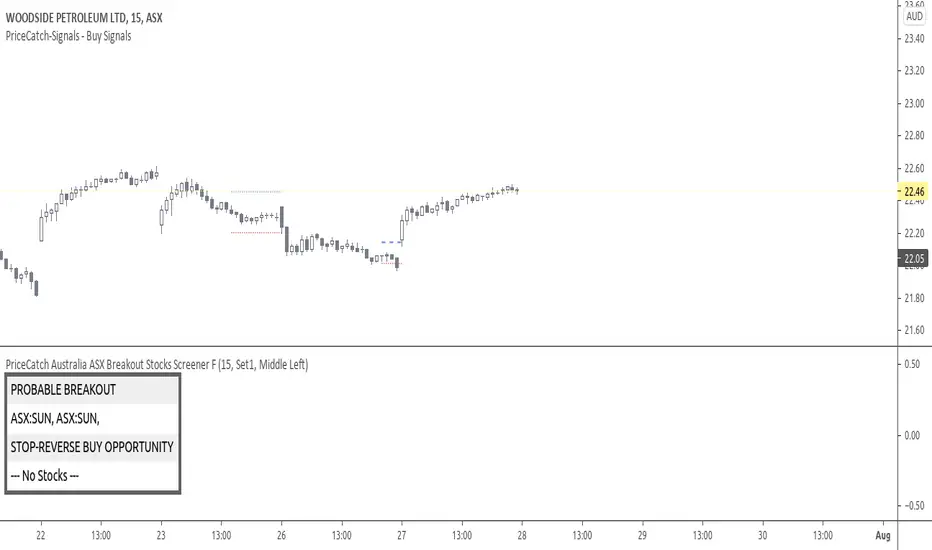
PriceCatch Australia ASX Breakout Stocks Screener FHi,
TradingView community and Australia (ASX) traders. Warm Greetings.
PriceCatch Australia (ASX) Breakout Stocks Screener
I am sharing a script that screens Australia (ASX) stocks for Probable Breakout Buy signal and Stop-Reverse Buy Signal. This script may prove to be useful to traders who trade Australia (ASX) listed stocks.
I have already shared the script "PriceCatch Signals Buy Signals" that marks the following levels on the chart.
Probable Breakout Buy Level
Stop-Reverse Buy Level
While the script "PriceCatch Signals Buy Signals" can be used independently, this script is intended to be used with the script "PriceCatch Signals Buy Signals".
Used together, these two scripts may help you identify probable breakout opportunities. This Screener will help you screen stocks that have broken out of any of the Breakout levels marked by the "PriceCatch Signals Buy Signals" script. This way you can quickly and automatically identify breakout stocks without manually going through every stock in your watchlist searching for breakout signals.
Please read the Notes of the script "PriceCatch Signals Buy Signals" for explanation of its functionality.
STOCKS SET
This Free screener scans a list of 20 stocks. The full version scans a list of 80 stocks. Care has been taken to include liquid stocks and stocks of AUD $10 and above only, to avoid penny stocks.
Chart resolution vs. Script resolution
It is suggested to set the chart resolution to a lower time-frame than the Screener resolution. For example, if the screener resolution is set to 1 Hour time-frame, set the chart resolution to less than 1 Hour time-frame and run the Screener.
CHART
The Screener runs independently and you may have any other ASX chart on your screen.
NOTE - PRIOR TO USING THIS SCRIPT:
Please remember that the script is shared with absolutely no assurances about usability and any warranties whatsoever and as a responsible trader, please satisfy yourselves thoroughly and use it only if you are satisfied it works for you. Remember, you are 100% responsible for your actions. If you understand and accept that, you may use the script.
QUERIES/FEEDBACK
Please PM me or comment.
Regards to all and wish everyone all the best with trading.
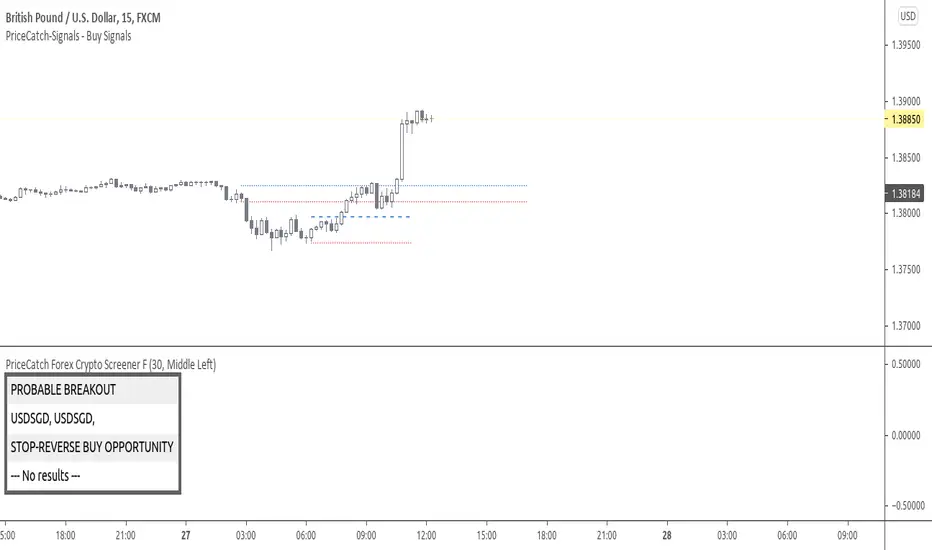
PriceCatch Forex Crypto Screener FHi,
TradingView community and Forex & Crypto traders. Warm Greetings.
PriceCatch Forex Crypto Screener Free Version.
I am sharing a script that screens Forex pairs, XAGUSD, XAUUSD, BTCUSD and ETHUSD for Probable Breakout signals. This script may prove to be useful to traders who trade in the above instruments.
Once this script is added to your chart and the resolution is set, it will automatically keep watching for any breakout on the above instruments and display the results on chart for your attention.
I have already shared the script "PriceCatch-Signals Buy Signals" that marks the following levels on the chart.
Probable Breakout Buy Level
Stop-Reverse Buy Level
While the script "PriceCatch-Signals Buy Signals" can be used independently on all instruments like stocks, Forex, Crypto, commodities etc., this script is intended to be used with the script "PriceCatch-Signals Buy Signals".
Used together, these two scripts may help you identify probable breakout opportunities. This Screener will help you screen the above instruments that have broken out of any of the Breakout levels marked by the "PriceCatch-Signals Buy Signals" script. This way you can quickly and automatically identify breakouts or anticipate them on your favorite Forex pair without manually going through your watchlist searching for breakout opportunities.
Please read the Notes of the script "PriceCatch-Signals Buy Signals" for explanation of its functionality.
FREE VERSION FOREX SET
This Free Forex screener scans a list of 11 Pairs and 2 Crypto (BTCUSD and ETHUSD). This should be enough for most traders. The full version scans all major Forex pairs and more Cryptocurrencies.
Chart resolution vs. Script resolution
It is suggested to set the chart resolution to a lower time-frame than the Screener resolution. For example, if the screener resolution is set to 1 Hour time-frame, set the chart resolution to less than 1 Hour time-frame and run the Screener.
CHART
The Screener runs independently of any symbol displayed on your chart.
NOTE - PRIOR TO USING THIS SCRIPT:
Please remember that the script is shared with absolutely no assurances about usability and any warranties whatsoever and as a responsible trader, please satisfy yourselves thoroughly and use it only if you are convinced it works for you. Remember, you are 100% responsible for your actions. If you understand and accept that, you may use the script.
QUERIES/FEEDBACK
Please PM me or leave comments.
Regards to all and wish everyone all the best with trading.
Trend From Volume And Price (TFVAP)Indicator that indicates buying and selling times based on price and volume and who is imposed of the two (VAP).
It uses the trends of the Dow theory (primary: 365 days/1 year, secondary: 90 days/3 months and tertiary: 21 days/3 weeks) and the identification of Elliot waves, both impulse and correction, based on the Fibonacci retracements (23.61% , 38.2%, etc.).
- Purple line is the evolution in percentage of the price in the primary trend
- Blue line is the evolution in percentage of the volume in the primary trend
- White line is the evolution in percentage of the (volume % - price %) in the primary trend, if white line > 0
- Green triangleup is time of start to buy
- Green square is time of stop to buy
- Red triangledown is time of sell
To understand it better:
If the purple line goes up it indicates that the price is rising, if it goes down, that the price is down.
If the blue line is greater than 0 it indicates that there are more purchases than sales, if the blue line is less than 0 it indicates that there are more sales than purchases.
If the white line is greater than 0 there is a high volume of purchases or low sales for the price that there is, it is likely that the price will rise.
If the white line is less than 0 there is a low volume of purchases or high sales for the price that there is, it is likely that the price will go down.
PD: Ignore the chart drawings, the indicator script is only represented at the bottom

nonoiraq indicator it's very strong i edit this indicator to connect it with my bot to auto trading and he take the info from the volume, so when he is give me a single the bot take just 0.50% to 1% for 3 - 5 trade in day and this perfect, if u use a manual trading this indicator can reach to from 10% to 80% in some point .
the indicator have 3 line
(Red , Purple, Yellow)
1- The yellow line it's high sensitivity this mean it's when rich to the -3 or 3 you can open the order when the bar is close and the signal be sure
and u need to watch the your order because in some case he is reach to 0.30% to 2% and the price reflected to loss and when you wait the price reflected to but my advice you take profit and close the order directly.
2- The purple circles it's medium sensitivity this mean when the purple hit the 2.5 or 3 from down or up in indicator with yellow line you open the order when bar close and the signal is be sure , like example in the photo
3- The red circles it's low sensitivity and this one when reach to 3.0 with any line (yellow or purple) you open directly short or long , like the example in the photo
i am sorry for my english it's not very good
please support me to share other idea or script

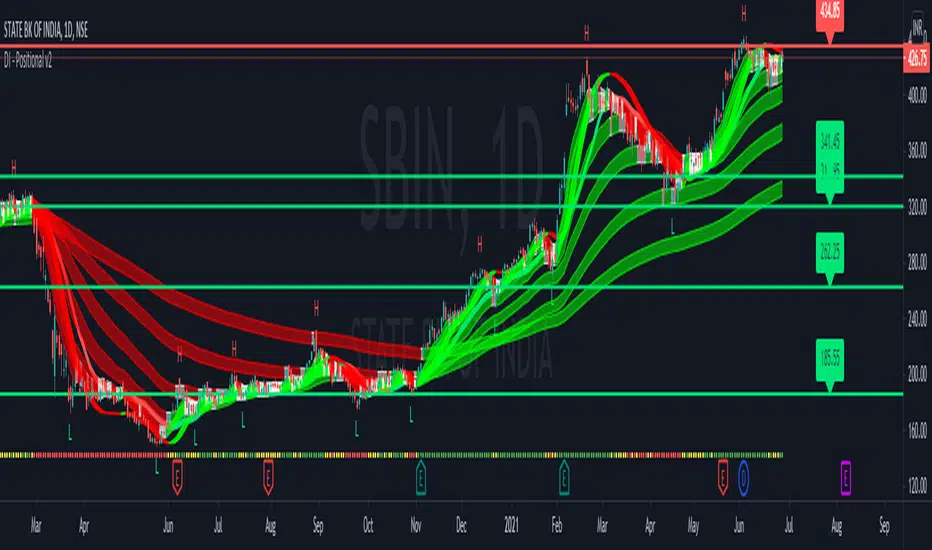
D Indicators - Positional tool*Presenting a perfect setup for Positional and Swing traders.
1) Slow and Fast Bands
# 3 fast and 3 slow, in total of 6 EMA bands are added to the indicator in order
to make accurate decisions and helping find out in which trend the price is.
Enter when price gives a breakout above or below all of the 6 bands.
2) Trend Indicators
# Total of 3 trend indicators are also included:
Trend Indicator 1 ---> It is a SMA(20) and its color changes based upon
Trend Indicator 2 ---> will be plotted at the bottom of the screen. Based upon RSI
Trend Indicator 3 ----> EHMA
Their color will be yellow whenever the market is sideways which will act
as a cautionary sign that in about next phase the price will be rangebound.
Use them as a helping hand, and check whether they show the same trend or not while you enter.
3) Support/Resistance lines
# On charts, this indicator is used to locate levels of support and resistance.
As a function, Targets and SL can be planned.
When a candle closes above the support/resistance line, the lines change
color automatically. It'll turn green.
If the price is below the sup, it will also change color to red.
4) High/Low
# Will mark the high/low of a particular swing so that, one can place the SL over there and enter.
Thank you and regards,
D Indicators
Target Price for KuCoin FuturesWhen trading on KuCoin, it can be difficult to determine what you're exit price should be.
This script solves this issue by giving you an exit price based on a given entry price, a base margin, and a target profit %.
USE CASES:
No Entry Price:
If you have no position in KuCoin, then this use case could be more helpful. With no entry price inputted, two lines will be drawn above and below the current closing price.
The blue line represents your exit price for if you were to enter into a long at the current close.
The orange line represents your exit price if you were to enter into a short at the current close.
With Entry Price:
If you're already in a position in KuCoin, then this case might be more helpful.
The green line represents your exit price for a long from your entry price
The red line represents your exit price for a short from your entry price
The yellow line represents your entry price itself.

Tolueno StrategyTolueno Strategy is a help tool for the average trader of tradingview. This tool facilitates the interpretation of entries either long or short.
The use of magic trend has been implemented, in addition to different types of ema and fully configurable signals.
Soon the use of more sophisticated support and resist will be added to be used for inputs and outputs. RR will be improved too.
The tool has alerts
The tool has a dashboard that shows current signal (LONG / SHORT), shows a recommended take profit (not mandatory), recommended stop loss (not mandatory) and the profit that the current operation is achieving, all this to help the trader and his emotions do not harm him.
The tool is constantly updated and will be gradually improved over time with feedback from tradingview users.
Any questions ask in the comment box or by pm.
This indicator is not for sale, it is not a commercial publication.

TEMA Cross +HTF BacktestThis is a follow up to a previous script release called " TEMA Cross Backtest ".
This new strategy uses two TEMA crosses, one for trend direction, one for entry and exit. The entry and exit parameters are the same as the previous script. The trend direction is based on a user configurable higher timeframe TEMA cross which determines when to take longs or shorts. When the indicator is purple, it is looking for shorts, and when it is yellow, it is looking for longs. The background of the chart is colored accordingly to see the trend direction at a glance.
The default settings are the ones I have found produce the highest backtest results. The backtest is set by default to use a $500 account, and use $500 for every entry and exit, no matter the direction or overall profit/loss.
Parts of script borrowed from other public scripts.

Ichimoku EMA RSI - Crypto only long StrategyHey there!
Here I show you an Ichimoku Cloud Strategy.
I discovered the strategy on a YouTube channel and tried to transfer it as a strategy into a script.
He said in his video that you would make more profit with this strategy than holding the coin.
Tested with the crypto pair ETH/USDT in the four hour chart.
Period: beginning of 2017 until today.
The strategy should also work with foreign exchange. But then the settings have to be adjusted.
There is the possibility to activate two EMA's and a Stochastic RSI .
-----------------------------------------------------------------------------------
How does the strategy work?
ENTRY
The green Ichimoku lead line must above the red Ichimoku lead line - only the two lead lines are activated.
A green candle must closed above the green lead line.
EXIT
A red candle must close below the green Ichimoku lead line.
OPTIONAL ENTRY
EMA
Once you activate the EMA , long positions will only be taken once the EMA1 is above the EMA2.
Thereby I could observe a significant increase of the profit as well as a decrease of the maximum drawdown.
RSI
As soon as you activate the Stochastic RSI , long positions are only taken when the K line is above the D line.
In the future, I may add an oversold - undersold parameter.
The results of the strategy are without commissions and levers.
If you have any questions or feedback, please let me know in the comments.
If you need more information about the strategy and want to know exactly how to apply it, check out my profile.
I wish you good luck with the strategy!

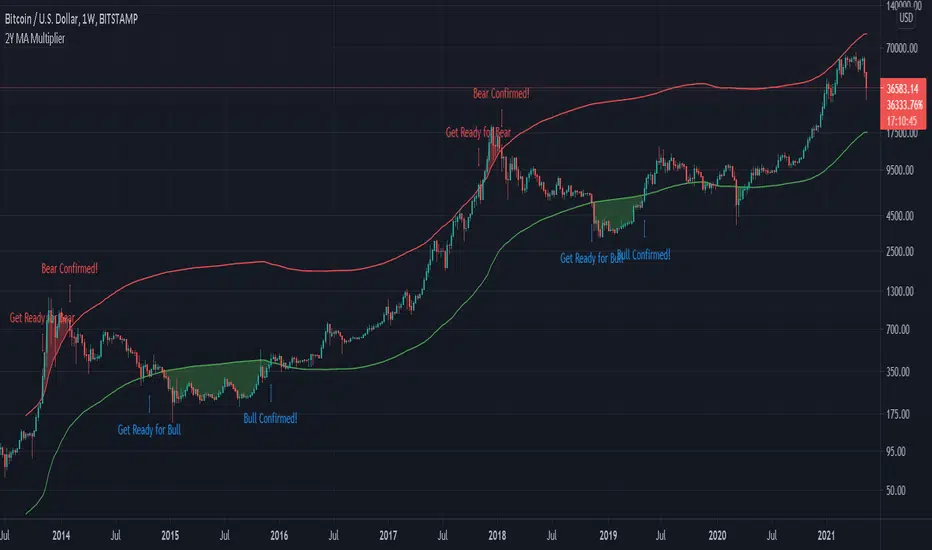
Bitcoin 2-Year MA Multiplier by GodtrixHi guys, I found this tool very useful and accurate, but can't find it on Trading View, so I made one for myself and everyone here ;)
Alert is available too.
Indicator Overview
The 2-Year MA Multiplier is intended to be used as a long term investment tool.
It highlights periods where buying or selling Bitcoin during those times would have produced outsized returns.
To do this, it uses a moving average (MA) line, the 2yr MA, and also a multiplication of that moving average line, 2yr MA x5.
Note: the x5 multiplication is of the price values of the 2yr moving average, not of its time period.
Buying Bitcoin when price drops below the 2yr MA (green line) has historically generated outsized returns. Selling Bitcoin when price goes above the 2yr MA x 5 (red line) has been historically effective for taking profit.
Why This Happens
As Bitcoin is adopted, it moves through market cycles. These are created by periods where market participants are over-excited causing the price to over-extend, and periods where they are overly pessimistic where the price over-contracts. Identifying and understanding these periods can be beneficial to the long term investor.
This tool is a simple and effective way to highlight those periods.
Credit to & Created By
Philip Swift
Date Created
July 2017
BITSTAMP:BTCUSD
Hull MA with BB (With Alerts)This is a combination of the standard Bollinger bands with a VWAP(Pink line), and the 'Hull Trend with Kahlman' script by user capissimo, and the NMA (Moving Average 3.0 (3rd Generation)) script by everget.
You can find the original scripts here:
This indicator gives you several confirmations of a good entry and exit positions for Crypto currency like bitcoin and most alt coins. I use this on a 15min, 30min, 1hour, and 4hour chart for best results.
How to use:
Entry Signals:
-A candle closes above the NMA (Yellow Step Line). AND
-You see a Long (text) flag. AND
-The candles are near the bottom of the Bollinger bands and heading upwards.
Exit Signals:
-Candles have passed below and closed below the NMA (Yellow Step Line). AND
-You see a Short (text) flag.
It's important to use these confirmations with other indicators so you have the best entry/exit positions, and make sure you are on normal candles and not HA or any other types.
There are alerts built in that you can setup for the Short and Long text flags that you see. These are generally good alerts to follow. I use the alerts as a reminder to check the charts and see if my other indicators line up for a good trade.

AIOC Indicator [Armand Snyman] V7All In One Chart Indicator V7
The All In One Chart Indicator (AIOC) consists of the following:
-BB is a Big Buy signal which means the price is going to go up really fast. The BB is there to alert you if the price goes up a lot and that it is going to happen fast.
-BS is a Big Sell signal which means the price is going to go down really fast. The BS is there to alert you if the price goes down a lot and that it is going to happen fast.
-Buy
-Sell
-Pump zones is the blue background color.
-Dump zones is the purple background color.
HOW TO USE THIS INDICATOR!
It is very simple to use this indicator. If a buy signal comes through you long or enter the market and if a sell signal comes through you short or exit the market.
If a Big buy signal comes through you long or enter the market and if a Big sell signal comes through you short or exit the market.
If a pump zone (the blue highlighted color on the background) comes in, then it is safe to enter the market or to enter a long position.
If a dump zone (the purple highlighted color on the background) comes in, then it is safe to exit the market or to enter a short position.
HOW THE BUY, SELL, PUMP AND DUMP SIGNALS ARE CALCULATED!
Using a combination of moving averages and the rsi and the macd.

Jaws Mean Reversion [Strategy]This very simple strategy is an implementation of PJ Sutherlands' Jaws Mean reversion algorithm. It simply buys when a small moving average period (e.g. 2) is below
a longer moving average period (e.g. 5) by a certain percentage and closes when the small period average crosses over the longer moving average.
If you are going to use this, you may wish to apply this to a range of investment assets using a screener for setups, as the amount signals are low. Alternatively, you may wish to tweak the settings to provide more signals.
Context can be found here:
LINK

Angle Attack Follow Line Indicator This indicator works with Follow Line Indicator , evaluates the angle for possible additions or reductions of the position. Many settings to play with:
s3.tradingview.com
- FOLLOW LINE CURRENT CHART RESOLUTION
- FOLLOW LINE HIGHER TIME FRAME
- FILTER HIGHER TIME FRAME
- NO FILTER HIGHER TIME FRAME
- ANGLE CONFIGURATION
- ANGLE LEVELS
- BUY / SELL
- OPTIONS TO ADD
- OPTIONS TO REDUCE
- BAR COLOR
- LABELS
-ALERTS
MANAGE YOUR RISK AND CAPITAL WELL IF YOU DO NOT WANT TO LOSE EVERYTHING¡¡¡
TO PLAY¡¡¡
