Trend-Following Combo-SuperTrend, EMA, Aroon, DMI, Laguerre RSIThis is a trend-following indicator which condenses two SuperTrend indicators -- one based on analysis over a shorter period of time (1.5, 7), and one based on analysis over a longer period of time (1.65, 100) -- into a single indicator which appears on your chart only when both the shorter- and longer-term analysis indicates a "SuperTrend" in the same direction.
Additionally, potential trade entry indicators are displayed in the form of up and down arrows when (by default) three of the following five indicators suggest that the market is trending in the same direction as both the shorter- and longer-term SuperTrend indicators:
EMA Crossover (8, 15)
Aroon Indicator (8)
Aroon Oscillator (8)
Directional Movement Index (DI +/-) (8)
Laguerre RSI (13)
You may update the parameters of any of the indicators to match your own preferences.
Additionally, you may also adjust the "Threshold" of indicators that must be in agreement with the SuperTrend to show a potential trade entry arrow. Bear in mind that if you set the Indicator Threshold too low, you will see more frequent trade entry arrows, many of which will not be profitable if taken. Similarly, set this value too high, and you will see fewer trade entry arrows that may not appear until after most of the "juice" in the trend has evaporated. Ideal values for the threshold seem to be between 2-4, depending on the symbol you are trading.
The following image shows all of the indicators referenced above on a 5-minute chart of the SPY during a single trading day:
And, here is the same period of time showing only the Trend-Following Combo indicator with default settings:
This indicator would not have been possible save for work contributed by the following:
SuperTrend by Rajandran R
Aroon w/ crossovers highlighted by seiglerj
Aroon Oscillator by jcrewolinsky
Directional Movement Index by TradingView
Laguerre RSI (Self Adjusting Alpha with Fractals Energy) by everget
Tìm kiếm tập lệnh với "supertrend"

FDI-Adaptive Supertrend w/ Floating Levels [Loxx]FDI-Adaptive Supertrend w/ Floating Levels is a Fractal Dimension Index adaptive Supertrend indicator. This allows Supertrend to better adaptive to volatility of the market. This also includes floating levels that act as support and resistance, stop loss or take profit, or indication of market reversal. Additional signal types will be added in the future based on these floating levels.
What is the Fractal Dimension Index?
The goal of the fractal dimension index is to determine whether the market is trending or in a trading range. It does not measure the direction of the trend. A value less than 1.5 indicates that the price series is persistent or that the market is trending. Lower values of the FDI indicate a stronger trend. A value greater than 1.5 indicates that the market is in a trading range and is acting in a more random fashion.
What is the Supertrend?
Supertrend indicator was created by Olivier Seban to work on different time frames. It works for futures , forex, and equities. It is used in 15 minutes, hourly, weekly, and daily charts . Based on the parameters of multiplier and period, the indicator normally uses 3 for multiplier and 7 for the ATR period as default values. Average True Range is represented by the number of days while the multiplier is the value by which the range is multiplied.
Included:
Bar coloring
Alerts
Signals

Close to SupertrendMany a times, we have seen that the price closing in towards supertrend reverses.
This indicator gives signal that identifies high / low of any candle if near the down / up supertrend line by a defined margin using arrow signals.
I've simply re-used readily available supertrend indicator source code and just modified it to these signals. So, almost all of the source code is not mine.
Enter the short / long position when arrow signal appears.
SL / trend reversal will be mandatorily at close of a candle above or below the supertrend line, and the supertrend changes direction.
Hope this indicator comes handy for you.

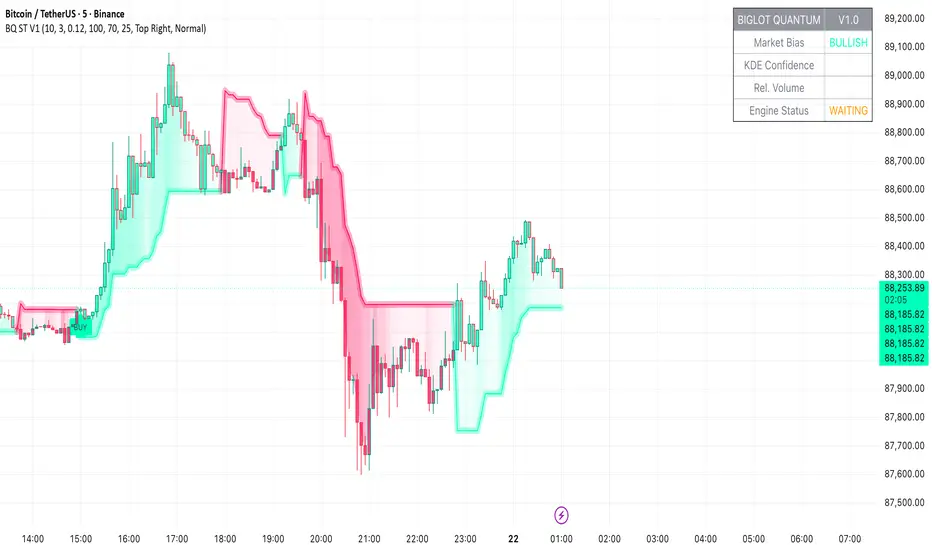
BigLot Quantum SuperTrend V1BigLot Quantum SuperTrend V1 is a trend-following indicator that enhances the traditional SuperTrend by integrating statistical volume analysis.
The script combines an ATR-based SuperTrend engine with Kernel Density Estimation (KDE) applied to relative buy and sell volume. Volume behavior is modeled statistically, allowing the indicator to filter breakout signals and activate only when volume conditions show high probability compared to historical data.
Bullish and bearish signals are generated when price crosses the SuperTrend line and the corresponding volume probability exceeds a user-defined threshold. This approach helps reduce false signals during low-liquidity or sideways market conditions.
The script includes visual trend highlighting, probability-based confidence filtering, and a real-time dashboard displaying trend direction, volume strength, and signal status. It is designed to work across all markets and timeframes without repainting.
Pivot Point+ Supertrend + EMA + Support/Resistance- LAXMANTAK98
Pivot Point Supertrend with EMA and Support/Resistance Indicator
This custom trading indicator combines the following key components to assist in market analysis and trade decision-making:
Pivot Points:
Pivot points are calculated based on a chosen price source (High, Low, Open, or Close). These levels are used to determine potential support and resistance zones.
Pivot Highs (Resistance) and Pivot Lows (Support) are plotted as labels on the chart for easy identification.
Supertrend Indicator:
The Supertrend is a trend-following indicator that helps to identify bullish or bearish trends.
It uses the Average True Range (ATR) to calculate dynamic support/resistance levels, with adjustable settings for ATR length and multiplier factor.
The trend direction is visually represented by green (bullish) and red (bearish) lines on the chart.
Exponential Moving Averages (EMA):
The indicator plots up to four EMAs with user-defined periods (e.g., 9, 21, 50, 200).
EMAs are commonly used to smooth out price data and identify trends over various timeframes.
Support and Resistance Levels:
Based on Pivot Points, support and resistance levels are plotted using crosses on the chart.
These levels indicate possible price reversal points, helping traders spot key zones for entry and exit.
Visual Alerts:
The indicator includes built-in alerts for trend changes and potential buy/sell signals based on the transition between uptrend and downtrend states.
This combined indicator allows traders to analyze trends, identify key levels for trading, and make more informed decisions by integrating Pivot Points, Supertrend, EMAs, and Support/Resistance in one cohesive system.

Double Supertrend Entry with ADX Filter and ATR Exits/EntriesThe Double Supertrend Entry with ADX Filter and ATR Exits/Entries indicator is a custom trading strategy designed to help traders identify potential buy and sell signals in trending markets. This indicator combines the strengths of multiple technical analysis tools, enhancing the effectiveness of the overall strategy.
Key features:
Two Supertrend Indicators - The indicator includes two Supertrend indicators with customizable parameters. These trend-following indicators calculate upper and lower trendlines based on the ATR and price. Buy signals are generated when the price crosses above both trendlines, and sell signals are generated when the price crosses below both trendlines.
ADX Filter - The Average Directional Index (ADX) is used to filter out weak trends and only generate buy/sell signals when the market exhibits a strong trend. The ADX measures the strength of the trend, and a customizable threshold level ensures that trades are only entered during strong trends.
ATR-based Exits and Entries - The indicator uses the Average True Range (ATR) to set profit target and stop-loss levels. ATR is a measure of market volatility, and these levels help traders determine when to exit a trade to secure profit or minimize loss.
Performance Statistics Table - A table is displayed on the chart, recording and showing the total number of winning trades, losing trades, percentage of profitable trades, average profit, and average loss. This information helps traders evaluate the performance of the strategy over time.
The Double Supertrend Entry with ADX Filter and ATR Exits/Entries indicator is a powerful trend-following strategy that can assist traders in making more informed decisions in the financial markets. By combining multiple technical analysis tools and providing performance statistics, this indicator helps traders improve their trading strategy and evaluate its success.

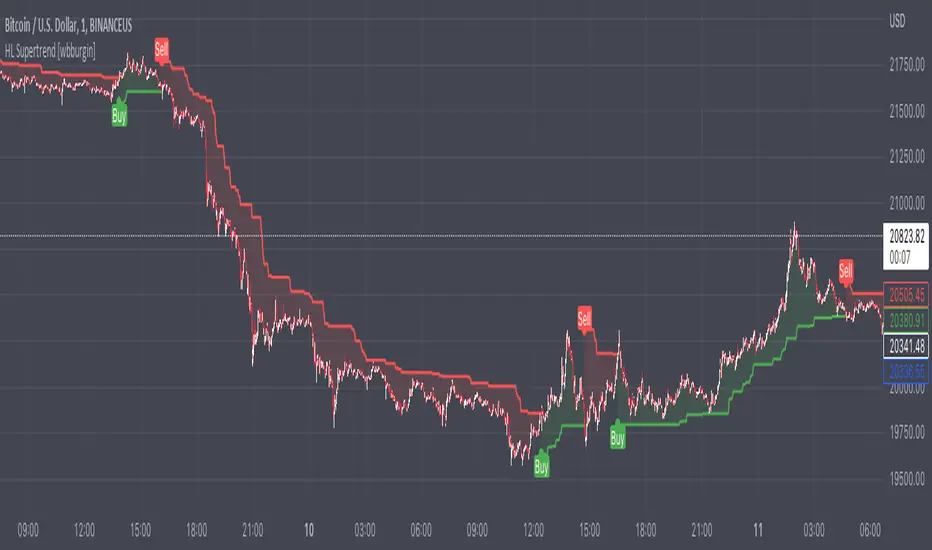
High/Low SupertrendThe High/Low supertrend uses an ATR produced from the highest and lowest points within the ATR lookback range, instead of from current highs and lows. This makes it less susceptible to false breakout attempts.
In the settings, you can choose whether you want the supertrend to calculate from the highest highs and lowest lows within the period, or the maxima of the opens and closes.
USAGE: I recommend using this supertrend as the arming mechanism to the buy or sell, instead of the trigger itself. This is because in ranging markets the supertrend will flip on the current high or current low.
[JL] Supertrend Zone Pivot Point with zigzag fibThis is an open-source Pine script that generates a Supertrend Zone Pivot Point with Zigzag Fib indicator for TradingView. The indicator displays the Supertrend Zone, pivot points, and Fibonacci levels on the chart.
One of the unique features of this indicator is that it uses a Zigzag that does not repaint, ensuring accurate high and low points for the pivot points.
Another feature is that when the Supertrend is in an uptrend, only the highest points are taken as pivot points, and when it's in a downtrend, only the lowest points are taken as pivot points.
The Fibonacci levels are calculated based on the previous high and low pivot points, with labels displaying the corresponding levels on the chart.
The indicator also includes options to show/hide the Zigzag and Fibonacci levels.
Overall, this indicator is useful for identifying key pivot points and Fibonacci levels in the Supertrend Zone, providing valuable information for traders to make informed decisions.

Fibonacci Levels Based on Supertrend [By MUQWISHI]A “ Fibonacci Levels Based on Supertrend ” indicator is supertrend indicator planned with Fibonacci retracements levels. Fibonacci retracements provides a sequence of levels starting from 0% to 100% in addition to extension levels. 0% is measured to be the initial Supertrend line, and 100% is the previous Supertrend line where it has been broken by candle. This tool could be valuable in terms of managing trades by setting targets and reducing the risk in the trend direction.
█ OVERVIEW
█ INDICATOR SETTINGS
Please let me know if you have any questions.
Thank you.

CCI SupertrendCCI Supertrend
+ This simple scripts base on CCI level to plot "Supertrend".
+ When CCI move above level 0, SuperTrend lowerBand is plotted.
+ When CCI move below level 0, SuperTrend upperBand is plotted.

Pivot Point SupertrendHello All,
There are many types of SuperTrend around. Recently I thought about a Supertrend based on Pivot Points then I wrote "Pivot Point SuperTrend" script. It looks it has better performance on keeping you in the trend more.
The idea is behind this script is finding pivot point, calculating average of them and like in supertrend creating higher/lower bands by ATR. As you can see in the algorithm the script gives weigth to past pivot points, this is done for smoothing it a bit.
As I wrote above it may keep you in the trend more, lets see an example:
As an option the script can show main center line and I realized that when you are in a position, this line can be used as early exit points. (maybe half of the position size)
While using Pivot Points, I added support resistance lines by using Pivot Point, as an option the script can show S/R lines:
And also it can show Pivot Points:
When you changed Pivot Point Period you can see its reaction, in following example PP period is 4 (default value is 2). Smaller PP periods more sensitive trendlines.
Alerts added for Buy/Sell entries and Trend Reversals. (when you set alerts use the option " Once Per Bar Close ")
ENJOY!

BEST Supertrend MAHello traders,
That one is an experiment
I was curious to see what a supertrend based on moving average cross could give
How does it work?
Bull event: fast moving average crossing over the slow moving average
Bear event: fast moving average crossing under the slow moving average
When the event is triggered, the script will plot the Supertrend as follow
UP Trend = ohlc4+ ATR * Factor
DOWN Trend = ohlc4- ATR * Factor
Interesting to see the results given by ohlc4 vs hl2 and hl3
Documentation: www.tradingview.com
This is an alternative of the classical Supertrend based on candle close being above/beyond the previous Supertrend level.
Hope you'll enjoy it and it will improve your trading making you a better trader
Dave

BEST Supertrend CCIHello traders
Today I present you a Supertrend not based on candle close but based on a CCI (Commodity Channel Index)
How does it work?
Bull event: CCI crossing over the 0 line
Bear event: CCI crossing below the 0 line
When the event is triggered, the script will plot the Supertrend as follow
UP Trend = High + ATR * Factor
DOWN Trend = Low - ATR * Factor
This is an alternative of the classical Supertrend based on candle close being above/beyond the previous Supertrend level.
Hope you'll enjoy it and it will improve your trading making you a better trader
Dave

BEST Multicolor Supertrend InfoPanelHello traders
Today is a Pinescript hack to display multiple colors in one label.
I used that panel to show the Supertrend Long Term values (weekly, monthly, quarterly, yearly)
What is a Supertrend?
Definition : SuperTrend is an indicator that works on all timeframes and all instruments (stocks, futures, forex, ...). It is a great tool to follow market trends and optimizes your profits.
SuperTrend evolves below or above the prices depending on the trend. You can use it as an exit position indicator when its direction changes. You can also use it to place your stops.
So.... the hack is?
The hack is about creating a new label for each line - versus creating just one label containing the whole text
Best regards,
Dave

Centerline SupertrendA centerline/non-chart indicator version of Everget's Supertrend script for use in NNFX-style indicator setups, with the emphasis on this indicator NOT adding visual clutter to the main charting area with a baseline indicator already present.
This is literally the EXACT same script as Everget's Supertrend, but not drawn on the chart and with the fill/stop and fill/state level removed.
Adjust to your timeframe/asset and backtest/forward-test accordingly.
Source script by Everget (Supertrend):

Double SuperTrend [CrossTrade]The Double SuperTrend indicator enhances the classic SuperTrend indicator's functionality by filtering out countertrend signals and keeping you out of chop. By adding another larger trend filter, it helps to keep you taking trades in the direction of the major trend. This dual analysis allows users to identify and trade in the direction of the major trend, thereby increasing the likelihood of successful trades.
Adjustable Parameters for Minor and Major Trends:
Users can customize both the major and minor trends according to their trading strategy. This includes adjusting the ATR (Average True Range) period and the ATR multiplier for each trend.
For the minor trend, the default ATR period is set at 10, and the multiplier at 3.0.
For the major trend, the ATR period defaults to 14, with a multiplier of 6.0.
These settings allow traders to tailor the sensitivity of the trends to their specific market view or strategy.
Source Selection:
Users can select the data source (such as high/low, open/close) that the SuperTrend calculations are based on, offering further customization.
Signal Visualization and Customization:
It plots the major and minor trend lines, with options to display buy/sell signals. These signals are only shown when they align with the major trend, reducing the likelihood of false signals.
The minor trend signals are displayed in green (for uptrends) and red (for downtrends), while the major trend lines are shown in blue (for uptrends) and purple (for downtrends).
Additionally, users can choose to display or hide these buy/sell signals.
Custom Alerts:
The indicator includes the functionality to set custom alerts for buy and sell signals. These alerts are specifically designed to notify users when a signal aligns with the confirmed major trend.

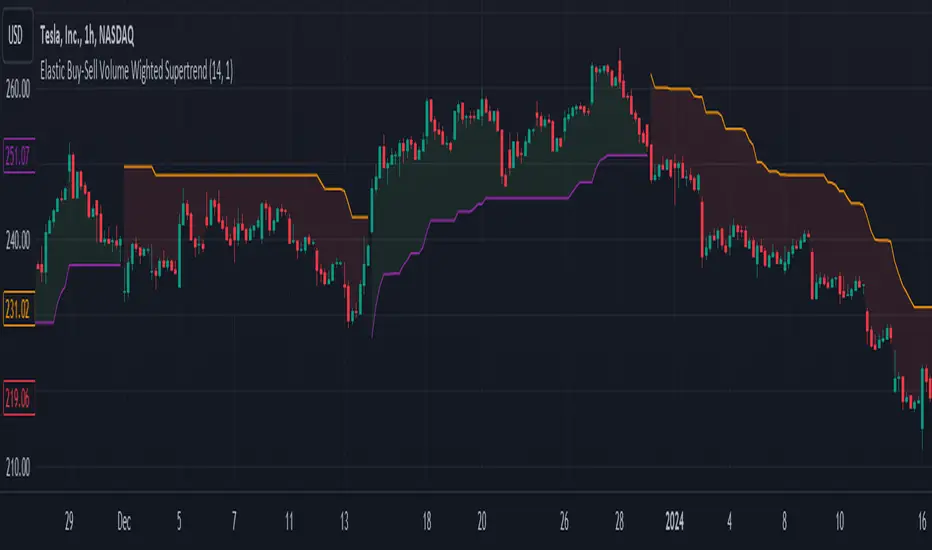
Elastic Buy-Sell Volume Wighted SupertrendCredits: This uses Trading View's buy and sell volume script and the Super trend script.
Elastic Buy-Sell Volume Wighted Supertrend can be used like a traditional supertrend indicator however we do not have to arbitrarily choose a multiplier depending on the stock and time frame the code dynamically adjust the multiplier and this is described below.
The buy and sell ATR (Average True Range) play a crucial role in determining the levels for potential buy and sell signals in the market. These ATR values are calculated based on volume-weighted averages, providing insights into the strength of buying and selling pressures. By incorporating volume into the ATR calculation, the indicator can better adapt to market dynamics, as volume often reflects the intensity of price movements. Instead of using Volume as whole this uses up and down volume derived from lower time frames which is used to calculate buy and sell ATR.
The multiplier is a key factor in the Supertrend calculation, which adjusts the width of the trend bands. The multiplier in this indicator dynamically adjusts itself based on two key components: the ratio of the asset's Average True Range (ATR) to that of a broader market benchmark and the coefficient of variation (CV) of the True Range (TR). The ratio comparison provides a historical context of the asset's volatility relative to the wider market over a longer time frame, while the CV accounts for short-term fluctuations in volatility.
By comparing the asset's ATR to that of the benchmark, traders gain insights into the asset's historical volatility behavior. A higher multiplier suggests that the asset's volatility has historically exceeded that of the benchmark, indicating potentially larger price movements compared to the broader market. Conversely, a lower multiplier suggests the opposite.
The CV component measures short-term variability in the asset's volatility, ensuring that the multiplier adapts to both long-term trends and short-term fluctuations. This combined approach enables traders to make informed decisions, considering both historical volatility relative to the broader market and short-term variability. Ultimately, the dynamic multiplier enhances traders' ability to adjust their strategies effectively across various market conditions.
Overall, the use of buy and sell ATR, along with a dynamically adjusted multiplier, enhances the indicator's ability to identify trend directions and to use a dynamic stop loss level.
Rainbow Fibonacci Momentum - SuperTrend🌈 "Rainbow Fibonacci Momentum - SuperTrend" Indicator 🌈
IMPORTANT: as this is a complex and elaborate TREND ANALYSIS on the graph, ALL INDICATORS REPAINT.
Experience the brilliance of "Rainbow Fibonacci Momentum - SuperTrend" for your technical analysis on TradingView! This versatile indicator allows you to visualize various types of Moving Averages, including Simple Moving Averages (SMA), Exponential Moving Averages (EMA), Weighted Moving Averages (WMA), Hull Moving Averages (HMA), and Volume Weighted Moving Averages (VWMA).
Each MA displayed in a unique color to create a stunning rainbow effect. This makes it easier for you to identify trends and potential trading opportunities.
Key Features:
📊 Multiple Moving Average Types - Choose from a range of moving average types to suit your analysis.
🎨 Stunning Color Gradient - Each moving average type is displayed in a unique color, creating a beautiful rainbow effect.
📉 Overlay Compatible - Use it as an overlay on your price chart for clear trend insights.
With the "Rainbow Fibonacci Momentum - SuperTrend" indicator, you'll add a burst of color to your trading routine and gain a deeper understanding of market trends.
HOW IT WORKS
MA Lines:
MA - 5: purple lines
MA - 8: blue lines
MA - 13: green lines
MA - 21: yellow lines
MA - 34: orange lines
MA - 55: red line
Header Color Indicators:
Purple: MA-5 is in uptrend on the chart
Blue: MA-5 and MA-8 are in the uptrend on the chart
Green: MA-5, MA-8 and MA-13 are in the uptrend on the chart
Yellow: MA-5, MA-8, MA-13 and MA-21 are in the uptrend on the chart
Orange: MA-5, MA-8, MA-13, MA-21 and MA-34 are in the uptrend on the chart
Red: MA-5, MA-8, MA-13, MA-21, MA-34 and MA-55 are in the uptrend on the chart
Red + White Arrow: All MAs are correctly aligned in the uptrend on the chart
Footer Color Indicators:
Purple: MA-5 is in downtrend on the chart
Blue: MA-5 and MA-8 are in the downtrend on the chart
Green: MA-5, MA-8 and MA-13 are in the downtrend on the chart
Yellow: MA-5, MA-8, MA-13 and MA-21 are in the downtrend on the chart
Orange: MA-5, MA-8, MA-13, MA-21 and MA-34 are in the downtrend on the chart
Red: MA-5, MA-8, MA-13, MA-21, MA-34 and MA-55 are in the downtrend on the chart
Red + White Arrow: All MAs are correctly aligned in the downtrend on the chart
Background Colors:
Light Red: All MAs are on the rise!
Red: All MAs are align correctly on the rise!
Light Green: All MAs are in freefall!
Green: All MAs are align correctly in freefall!
Tiny Arrows Indicators/Alerts:
Down Arrow: All MAs are in freefall!
Up Arrow: All MAs are on the rise!
Big Arrows Indicators/Alerts:
Down Arrow: All MAs are align correctly in freefall!
Up Arrow: All MAs are align correctly on the rise!

Harmonic Patterns Based SupertrendExtending the earlier implemented concept of Harmonic-Patterns-Based-Trend-Follower , in this script, lets make it work as supertrend so that it is more easier to operate.
🎲 Process
🎯 Derive Zigzag and scan harmonic patterns for last 5 confirmed pivots
🎯 If a pattern is found, bullish and bearish zones are calculated based on parameter Base
🎯 These bullish and bearish zones act as supertrend based on current trade in progress.
🎯 When in bullish mode, bearish zone will only go up irrespective of new pattern forming new low. Similarly when in bearish mode, bullish zones will only come down - this is done to imitate the standard supertrend behaviour.
🎲 Note
Patterns are not created on latest pivot as last pivot will be unconfirmed and moving. Due to this, patterns appear after certain delay - patterns will not be real time. But, this is expected and does not impact the overall process.
Here are few chart captures to demonstrate how it works.
🎲 Settings
Settings are explained in the screenshot below.

6 Multi-Timeframe Supertrend with Heikin Ashi as Source
This is a multiple multi-timeframe version of famous supertrernd only with Heikin Ashi as source. Atr which stands in the heart of supertrend is calculated based on heikin-ashi bars which omits a great deal of noises.
with 6 multiplication of the supertrend, its simply much easier to spot trend direction or use it as trailing stop with several levels available.
this is a great tool to assess and manage your risk and calculate your position volume if you use the heikin ashi supertrend as your stoploss.

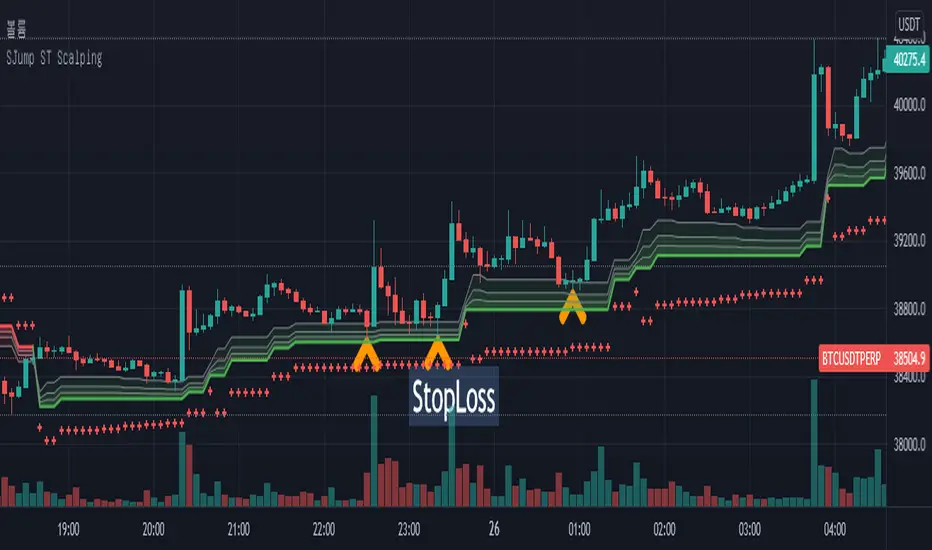
SuperJump HTF SuperTrend for ScalpingThis script can help you perform scalping using SuperTrend
First, set the HTF value higher than your current time frame.
As you know, the accuracy of the supertrend is very poor on the lower timeframe.
So I used higher timeframe(15 mins) supertrend more than current chart(5 mins)
Triple SupertrendThis triple supertrend indicator uses three different supertrend indicators with different and adjustable parameters. It is useful to filter false signals, set stop losses and detect sideways markets. When two or three (depending on the trading environment) supertrend lines turn green, a long is more suitable for a long position and vice versa.

Adoptive Supertrend - PivotsAnother experiment with Supertrend by making use of pivot point high/lows.
Trailing Stop types used in this indicator are:
ATR - plain ATR based supertrend
Breakout - ATR based supertrend combined with breakout. (Trailing triggered only if price change is higher than HighPriceChange multiplier times ATR.
Pivot Points - Trail only when new pivots created. Pivot stop multiplier is used below pivot low.
Combined - Combine everything together
