Gorb WallIntroduction:
Gorb Wall is a trading tool that offers a unique approach to market trend analysis. It extends the capabilities of the Gorb Algo indicator by presenting a multi-ticker, multi-timeframe dashboard, enabling traders to capture crucial market movements across various financial instruments without flipping through charts.
Overview:
Multi-Ticker Analysis: Monitor and analyze multiple financial instruments simultaneously.
Customizable Timeframes: Tailor the script to various timeframes to suit your trading strategy.
Gorb Algo Market Trend: An algorithm that adapts to market conditions, providing insights into trend changes.
User-Friendly Dashboard: Easily configure and customize the dashboard placement on your chart.
Color-Coded Trend Indicators: Visual cues to quickly assess bullish or bearish trends.
Optimized for Performance: Efficiently coded to ensure smooth running on TradingView without overloading resources.
How Gorb Wall Works:
The script utilizes Gorb Algo's market trend algorithm to process price and volume data across selected tickers and timeframes.
It applies a complex calculation to identify trends, using a combination of volatility analysis, momentum measurements, and trend strength indicators.
The output is a simplified visual representation on the dashboard, where colored circles indicate the trend direction, providing an at-a-glance market overview.
Unique Features:
Proprietary Algorithm: The heart of Gorb Wall lies in its unique Gorb Algo Market Trend algorithm. Unlike standard trend-following indicators, this proprietary algorithm integrates multiple technical analysis concepts (e.g., moving averages, volume data, price action, and oscillators) to provide a more comprehensive market trend analysis.
Multi-Dimensional Analysis: The script analyzes market trends by simultaneously processing data across multiple tickers and timeframes, offering a broader view of market movements than traditional single-ticker indicators.
We recommend exploring & choosing which tickers/timeframes best suits your needs and style of trading, and use that to combine with our suite of indicators.
Settings:
All skill-level friendly presets, easy to enable features with one-click
Dashboard Placement: Choose from top/bottom left/right for dashboard positioning.
Trend Speed Mode: Select the algorithm speed - Fast, Medium, Slow, Slowest.
Bullish/Bearish Trend Colors: Customize colors for trend indicators.
Additional Tickers: Input options for monitoring multiple financial instruments.
Timeframe Selection: Choose from a range of timeframes for each ticker.
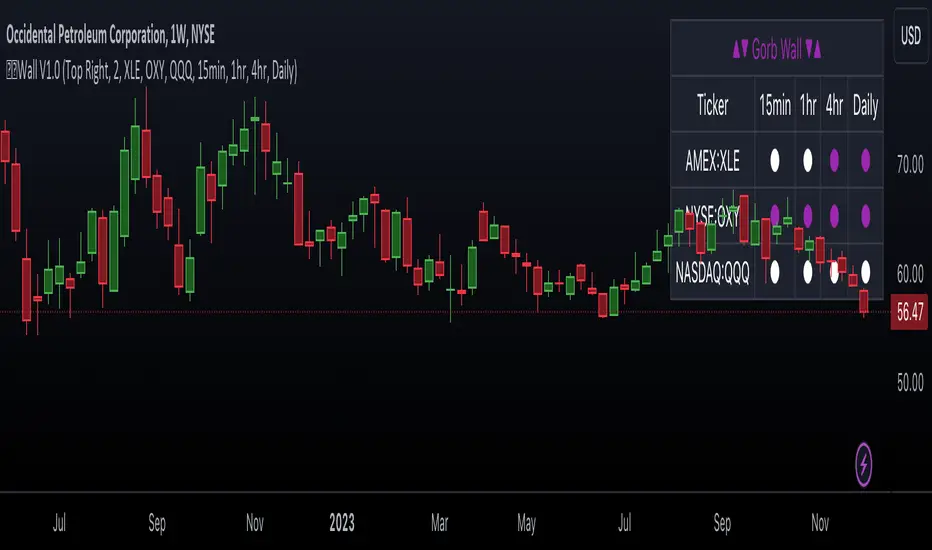
How to Use
In the image below, we can see a basic example of how this indicator functions.
The dashboard displays up to three different tickers per the user's choice, with 4 different timeframes the user can choose. It that runs the algorithm line on the specified ticker & timeframe and plots a colored circle that identifies that tickers trend on the specified timeframes.
There are two colors, white for bullish trend and purple for bearish trend. These are the two consistent colors across our suit of indicators to help simplify trading by using simple color matching for confluence. Below is a continued breakdown on using this indicator:
Dynamic Trend Visualization in Real-Time Updates
The dashboard dynamically updates trend colors (white for bullish, purple for bearish) based on real-time market data, offering immediate insights into market sentiment. The next three images below these the live change in data as price action begins developing over multiple timeframes.
In the image above, we are on the 5min AAPL chart, we have SPY, QQQ, and VIX as our tickers on the dashboard with 1min, 2min, 3min, and 10min timeframes chosen. We begin to see VIX flip bullish, which can usually mean down side for indices.
We then see as AAPL's price begins to slow and reverse, we see SPY's trend following on the smaller timeframes first with VIX still leading the way indicating possible bearish change.
In the image above, we can see that price dips down and SPY & QQQ market trends have flipped bearish on all timeframes, while VIX continues to be bullish(validating the downwards price action)
Customizable Settings
Users can adjust settings such as dashboard placement, trend speed mode, and color themes to suit individual trading styles.
In the image below, we can see the dashboard placement setting offers four different locations the user can move the dashboard. Just like in Gorb Algo , the user can choose which trendline speed they want to use to best fit their trading strategy.
In the image below, we can see the "bullish trend" & "bearish trend" colors setting. These colors by default match the rest of our suite of indicators, white is bullish and purple is bearish. Users can change these color settings to meet their preferences.
In the image below, we can see there are three market ticker options that the user can change. This allows users to monitor their favorite tickers across or easily flip through multiple tickers in order to gauge their current market trends without having to change their chart
In the image below, we can see the 4 timeframes that are on the dashboard. The user has the ability to change each of those four, to whatever timeframe best suits their trading needs. There are 12 different timeframe options to choose from.
Quick Dashboard Review
Using color-coded trend detection, this quickly gauges market trends and provides a visual to easily identify these changes in real-time across multiple timeframes. When a circle changes color, this means that price has flipped that direction, causing a change in the Gorb Algo market trendline. As stated above, white is for bullish trend and purple is for bearish trend, but these colors can be changed to fit the users trading strategy and style. Each timeframe the user chooses will be updated in real-time, including the higher time frames like the daily & weekly. They have been modified to pull data a same speed the lower timeframes are.
This helps provide quick visual identification of real market trend changes as price action develops. It is best used in conjunction with other forms of technical analysis for a holistic trading approach.
Conclusion:
This indicator is designed to streamline market trend analysis, offering traders an innovative, efficient, and easy-to-use tool for making informed trading decisions. This tool complements our suite of indicators, providing unique market insights that are not typically available in traditional open-source scripts.
How to get access:
You can see the Author's instructions to get access to this indicator
RISK DISCLAIMER
All content, tools, scripts & education provided by Gorb Algo are for informational & educational purposes only. Trading is risky and most lose their money, past performance does not guarantee future results.
Trendtrading
Dynamic Trend Hunter [Quantigenics]The "Dynamic Trend Hunter” script focuses on trend identification, dynamic entry and exit signals, and effective risk management. While a standalone trading script designed for versatile application across all markets, it can also be complemented by other indicators for enhanced analysis.
Core Features:
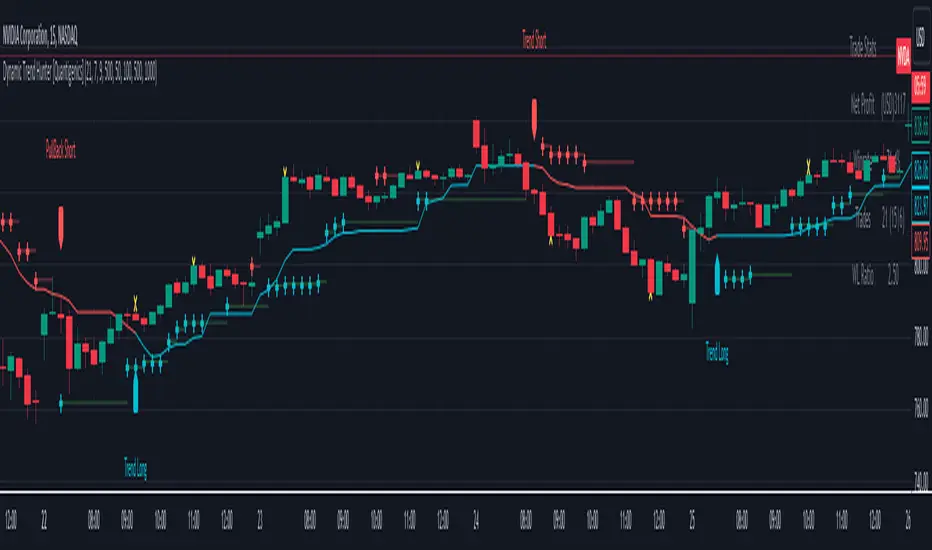
Dynamic Trend Indicator: Central to the script, this indicator discerns market trend direction using a color-coded system. Blue indicates an uptrend, red a downtrend, and a flat line signifies a sideways market.
Buy and Sell Signals: Provides clear, on-chart buy and sell signals to assist in identifying optimal entry points in alignment with the trend.
Profit Target Exits: A key feature designed to help traders lock in profits at strategic points. This feature uses a sophisticated mechanism (outlined in more detail below) to identify potential exit points, signaling the trader to close a position and secure gains before a potential market reversal.
Dynamic Stop Loss Levels: Essential for risk management, these levels adjust automatically, providing a mechanism for trailing stop losses and safeguarding against adverse market movements.
Technical Composition:
Dynamic Trend Indicator:
Calculation Method: Utilizes a blend of the highest and lowest prices over a specified length, averaged to create a trend line. This line is helpful in identifying the overall market trend.
Color Coding: The trend line changes color based on its relation to price action. A blue line indicates an uptrend when prices are consistently above this average line, while a red line signifies a downtrend when prices stay below it.
Signal-Based Trading:
Trend Entry Signals: Generated when there's a shift in the color of the trend line, indicating a potential change in market direction.
Pullback Entries: Identified when the closing price crosses the previous high (for long entries) or low (for short entries), while also considering the current trend line position.
Dynamic Stop Loss Levels:
Calculation: Stop loss levels are dynamically determined using the highest and lowest closing prices over the 'Length' period. These levels adjust with market movements, providing a trailing stop loss mechanism.
Visualization: Depicted as colored dots on the chart, changing in response to the market's movement relative to the trend line.
Oscillator for Dynamic Exits:
Mechanism: The script employs an oscillator to identify potential exit points, signaled by yellow dots. This oscillator is based on the relative extremity of the current price action compared to recent price movements.
Alerts: Dynamic exits trigger alerts when the oscillator reaches specified threshold levels, signaling potential market reversals or exhaustion points.
Customization and Flexibility:
Length Adjustment: The primary 'Length' input parameter allows traders to modify the sensitivity of the trend line and stop levels, catering to different trading styles and market conditions.
Alert Customization: Traders can set alerts for trend line changes and dynamic exits, ensuring timely responses to market movements.
Input Parameter Settings:
Intra-Bar Order Generation (IntraBar): Enables real-time signal generation within the current bar or after its closure.
Dynamic Exits (DynamicExits): Toggles the visibility of dynamic exit signals for profit-taking.
Dynamic Trend Length: Defines the lookback period for calculating the trend line. This length, which is adjustable and set by default to 21, specifies the number of bars over which the highest and lowest prices are analyzed to determine the trend line.
Dynamic Stop Loss Levels Length: This parameter defines the lookback period for calculating stop loss levels. It sets the number of bars used to determine the highest and lowest values for stop loss positioning. Adjusting this length allows traders to customize the sensitivity and placement of stop loss levels in accordance with their trading strategy and risk tolerance. This feature is crucial for tailoring stop loss settings to different market conditions and volatility levels, ensuring more effective risk management. Note: that initial stop loss levels, and tighter stop losses, can be set behind the Dynamic Trend Line itself.
Show Trend/Pullback Entries: Controls the display of specific entry signals based on trend continuation or market pullbacks.
Alert Settings: Options for setting alerts on trend line changes and dynamic exits, enhancing trade management.
Customizable Colors: Allows personalization of stop level and trend line colors for better chart visualization.
How to Trade with the Dynamic Trend Hunter:
Trend Following: Enter trades in the direction of the trend indicated by the color-coded trend line.
Pullback Entries: Look for pullback entry signals during established trends for additional entry points.
Dynamic Exits: Use yellow dot signals and dynamic stop loss levels for determining exit points or to adjust stop losses.
Risk Management: Employ the dynamic stop loss levels to manage risk effectively and protect against significant losses.
Alerts and Notifications:
Traders can set up alerts for trend line changes and dynamic exits, ensuring they are promptly informed about critical market movements and can react accordingly.
Conclusion:
The "Dynamic Trend Hunter " is a comprehensive and adaptable trading tool, suitable for various market conditions and trading styles. Its ability to provide clear trend indications, along with dynamic entry and exit signals, makes it an invaluable asset for traders aiming to enhance their market analysis and decision-making process. While it is a standalone system, it can be used in conjunction with other indicators to further refine trading strategies.
While we believe this tool may enhances your trading strategy, we encourage thorough familiarization before live trading. Remember, trading involves risk, and past performance is not indicative of future results.
You can see the “Author’s instructions" below to get immediate access to Dynamic Trend Hunter & the rest of the “Quantigenics Premium Indicator Suite”.
Easy RSI Trend - The trend is your friend till the endThis indicator detects the trend for you and keeps you out of choppy markets. It does not give you a signal, rather it tells you for what kind of signals to look for on the top right of the screen: "Only Longs" or "Only Shorts"
If there is no trend or if a trend is overextended (overbought, oversold) it tells you: "No trade allowed"
The indicator does this by scanning the 4h and daily RSI. Both are displayed in a small table in the bottom right of the screen. The upper cell is the 4h RSI and the other the daily RSI value.
AGAIN: This indicator does not give you a signal. It only tells you the direction in which you should trade. It should be used with an indicator or a strategy that gives you a clear signal.

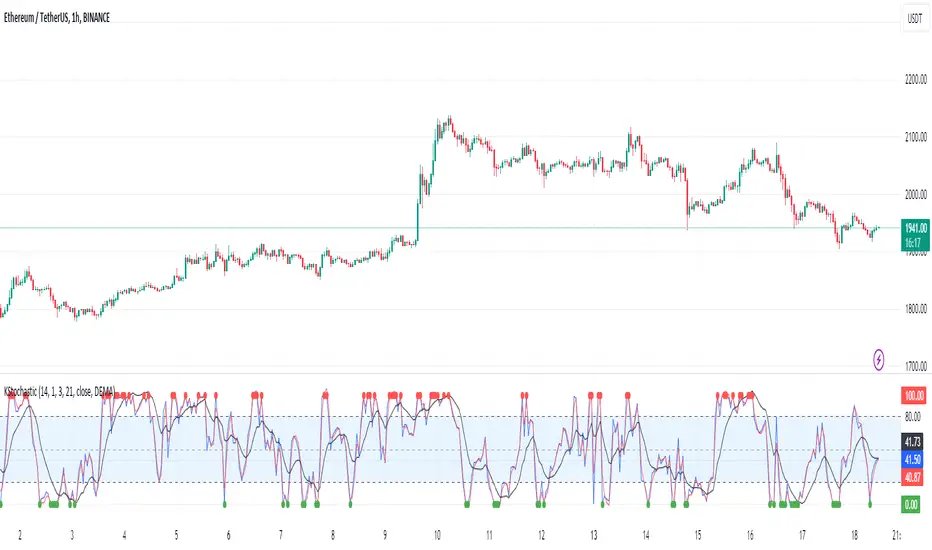
[KVA]K Stochastic IndicatorOriginal Stochastic Oscillator Formula:
%K=(C−Lowest Low)/(Highest High−Lowest Low)×100
Lowest Low refers to the lowest low of the past n periods.
Highest High refers to the highest high of the past n periods.
K Stochastic Indicator Formula:
%K=(Source−Lowest Source)/(Highest Source−Lowest Source)×100
Lowest Source refers to the lowest value of the chosen source over the past length periods.
Highest Source refers to the highest value of the chosen source over the past length periods.
Key Difference :
The original formula calculates %K using the absolute highest high and lowest low of the price over the past n periods.
The K Stochastic formula calculates %K using the highest and lowest values of a chosen source (which could be the close, open, high, or low) over the specified length periods.
So, if _src is set to something other than the high for the Highest Source or something other than the low for the Lowest Source, the K Stochastic will yield different results compared to the original formula which strictly uses the highest high and the lowest low of the price.
Impact on Traders :
Flexibility in Price Source :
By allowing the source (_src) to be customizable, traders can apply the Stochastic calculation to different price points (e.g., open, high, low, close, or even an average of these). This could provide a different perspective on market momentum and potentially offer signals that are more aligned with a trader's specific strategy.
Sensitivity to Price Action :
Changing the source from high/low to potentially less extreme values (like close or open) could result in a less volatile oscillator, smoothing out some of the extreme peaks and troughs and possibly offering a more filtered view of market conditions.
Customization of Periods :
The ability to adjust the length period offers traders the opportunity to fine-tune the sensitivity of the indicator to match their trading horizon. Shorter periods may provide earlier signals, while longer periods could filter out market noise.
Possibility of Applying the Indicator on Other Indicators :
Layered Technical Analysis :
The K Stochastic can be applied to other indicators, not just price. For example, it could be applied to a moving average to analyze its momentum or to indicators like RSI or MACD, offering a meta-analysis that studies the oscillator's behavior of other technical tools.
Creation of Composite Indicator s:
By applying the K Stochastic logic to other indicators, traders could create composite indicators that blend the characteristics of multiple indicators, potentially leading to unique signals that could offer an edge in certain market conditions.
Enhanced Signal Interpretation :
When applied to other indicators, the K Stochastic can help in identifying overbought or oversold conditions within those indicators, offering a different dimension to the interpretation of their output.
Overall Implications :
The KStochastic Indicator's modifications could lead to a more tailored application, giving traders the ability to adapt the tool to their specific trading style and analysis preferences.
By being applicable to other indicators, it broadens the scope of stochastic analysis beyond price action, potentially offering innovative ways to interpret data and make trading decisions.
The changes might also influence the trading signals, either by smoothing the oscillator's output to reduce noise or by altering the sensitivity to generate more or fewer signal
Including the additional %F line, which is unique to the K Stochastic Indicator, further expands the potential impacts and applications for traders:
Impact on Traders with the %F Line:
Triple Smoothing :
The %F line introduces a third level of smoothing, which could help in identifying longer-term trends and filtering out short-term fluctuations. This could be particularly useful for traders looking to avoid whipsaws and focus on more sustained movements.
Potential for Enhanced Confirmation :
The %F line might be used as a confirmation signal. For instance, if all three lines (%K, %D, and %F) are in agreement, a trader might consider this as a stronger signal to buy or sell, as opposed to when only the traditional two lines (%K and %D) are used.
Risk Management:
The additional line could be utilized for more sophisticated risk management strategies, where a trader might decide to scale in or out of positions based on the convergence or divergence of these lines.
Possibility of Applying the Indicator on Other Indicators with the %F Line:
Depth of Analysis :
When applied to other indicators, the %F line can provide an even deeper layer of analysis, perhaps identifying macro trends within the indicator it is applied to, which could go unnoticed with just the traditional two-line approach.
Refined Signal Strength Assessment :
The strength of signals from other indicators could be assessed by the position and direction of the %F line, providing an additional filter to evaluate the robustness of buy or sell signals.
Overall Implications with the %F Line :
The inclusion of the %F line in the K Stochastic Indicator enhances its utility as a tool for trend analysis and signal confirmation. It allows traders to potentially identify and act on more reliable trading opportunities.
This feature can enrich the trader's toolkit by providing a nuanced view of momentum and trend strength, which can be particularly valuable in volatile or choppy markets.
For those applying the K Stochastic to other indicators, the %F line could be integral in creating a multi-tiered analysis strategy, potentially leading to more sophisticated interpretations and decisions.
The presence of the %F line adds a dimension of depth to the analysis possible with the K Stochastic Indicator, making it a versatile tool that could be tailored to a variety of trading styles and objectives. However, as with any indicator, the additional complexity requires careful study and back-testing to ensure its signals are understood and actionable within the context of a comprehensive trading plan.
Gorb AlgoIntroduction:
Gorb Algo is an all-in-one trading indicator made up of classic technical analysis components such as moving averages, relative strength index, stochastic oscillator, and pivot points blended together to create a synergistic algorithm. Focused on providing useful signals & trading tool overlays to meet all trader's technical analysis needs. Each feature included can be changed to meet each traders strategy or market condition.
Overview:
The Gorb Market Trend isn't a simple trend-following tool; it's a sophisticated blend of traditional and innovative methods, providing comprehensive market analysis.
Its unique combination of EMA analysis, volume weighting, RSI, and stochastic indicators, along with proprietary algorithms, providing nuanced views in trend detection and trading confluences.
The indicator is designed for traders at all levels, offering a balance of depth for experienced traders and simplicity for beginners.
Centerpieces: Gorb Market Trend & Volume Strength
These use a color-coded system to indicate market direction/strength. The color: white is used to signal upward/bullish trend, while the color: purple is used to signal downward/bearish trend. It is designed for ease of use, simplifying complex market data into an easy visually understandable format.
How the Gorb Market Trend Works:
Moving averages are used to find convergence or divergence on multiple EMA's to help determine the overall market direction. Relative Strength Index is used to assess the speed and change of price movements to add another layer to the Market Trend lines identification of the markets analysis. It then plots a line using just two colors to provide traders with a visual representation of the trend. This can help traders quickly grasp the current market trend with simple color cues.
How the Volume Strength Works:
A stochastic oscillator is used to measure the current price level relative to its price over a specific range period to capture sentiment and potential reversals for the Trend Strength feature. And the final part is the use of VWAP and volume analysis to ensure that identified trends are not only based on price movements but are also supported by trading volume, adding a layer of reliability to the trend signals. These are then plotted at the bottom of the chart following the same color scheme as Gorb Market Trend. Only difference is, when volume strength begins to decline, the color will be more transparent, and when it is strong, the color will be bright.
Custom Algorithmic Elements:
The Gorb Market Trend isn't just a combination of standard indicators. It includes proprietary algorithmic elements tailored to enhance signal accuracy and timing. These unique components are what set the Gorb Market Trend apart from conventional trend-detection methods.
We recommend exploring every feature to pick & choose what best suits your needs and style of trading, and use that to combine with the Market trend line.
Features:
All skill-level friendly presets, easy to enable features with one-click
Trading Signals: Plotted signals to help traders identify changes in trend on the Gorb Market Trend Line (not to be followed blindly)
Match Volume Color: allows the user to enable signals to appear only if they match the trend strength's color
Enable MA Filter: allows the user to use 2 EMA's to create a custom trend filter in order to limit contrarian signals with the current trend
Chop Filter: allows the user to have a specific candle range of their choice to limit signals during sideways price movement
4 EMA's: allows the user to plot up to 4 EMA's on the chart and change to the users specific trading strategy with the Market Trend line
VWAP: allows users to plot VWAP on their chart to visually see where price is relatively
EMA Clouds: allows users to fill the gap between EMA's plotted on the chart to help them visualize zones for entries or stop-losses
Pivot Points: allows users to have pivots on their chart to use in tandem with market trend line to find areas of support and resistance to help find confluence in their trading
All colors are changeable for the user to customize the scheme to their liking or style
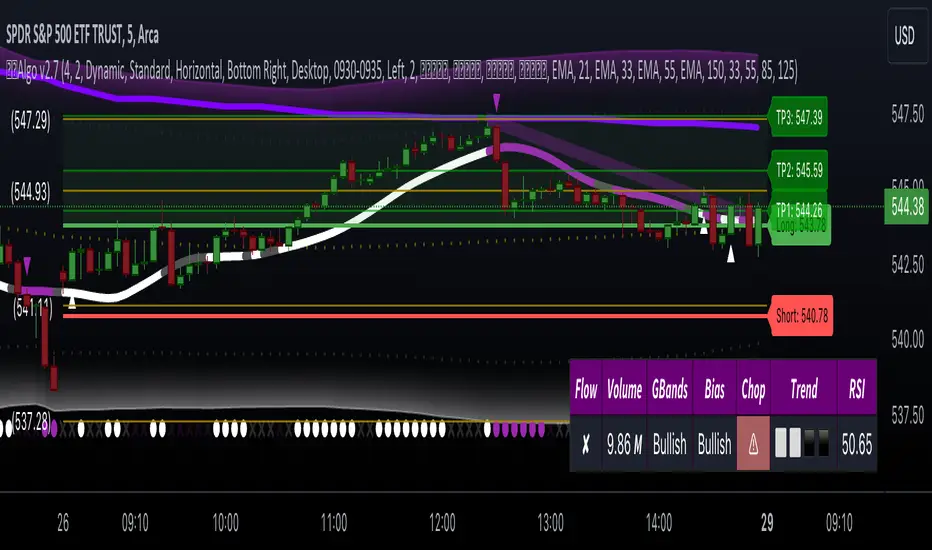
Basic Signals, Market Trend & Volume Strength Demonstration
In the image below, we can see a basic example of how these 3 core features function.
As explained above, the trade ideas are only generated if the user enables them. They will plot as small triangles in real time and are directly correlated to the market trend line coloring in order to quickly see the change in market conditions.
The volume strength on the bottom helps identify the strength and momentum of the market condition. This can also be used to identify possible fake-outs or small pullbacks before price continues on. The brighter the volume strength the stronger it is, when it is dimmer, that means volume is decreasing in that direction. This can help traders identify signals they may not want to trust as much.
Trading Tool Overlays with Signals
In the image below, we have enabled the EMA's and VWAP overlays from the settings. By using these tools, users can add more confluence to create their trading strategies
The EMA's are not only used for the market trends, trend filter. But also used as an additional confluence for general trend following purposes alongside the trade idea signals. These can be extremely useful for traders who like to have different length moving averages depending on their timeframe for analyzing the market.
In this next image, we can see that price dips down and then bounces up. With EMA clouds enabled, the user can now have visual zones to look for trade entries in.
When paired with the market trend line and trade idea signals, this adds a whole other level of easy visual trading confluence for traders. You can see that market trend changes color and a trade signal is plotted when price enters these zones. This can be helpful to a trader looking to find confluence in their entries.
The image below shows specific pivot levels being plotted when the user enabled pivots in the settings of the indicator.
The pivot levels proved an excellent area of support/resistance for traders that are generated fresh every day. These are particularly useful for areas that line up with previous tools above and trade signals. This overlay gives traders a clear level that can be used to confirm entries and create targets to exit trades at. These levels when combined with the other tools in this indicator provide traders an all-in-one visual confluences. Some traders may just use this overlay to have an idea on the range for the trading session.
Filters:
There are 3 different trade signal filters integrated into this indicator
1. Match Volume Color: When enabled, signals can only be valid and plotted if the volume strength color matches the market trend line signal. Otherwise the signal will not appear, this limits possible fake-outs without having volume agree.
2. MA Filter: When enabled, this removes an contrarian signals to the current market trend per the settings of the filter. The EMA settings for this filter can be changed by the user for them to customize this to their trading strategies. There are two settings, short ema and long ema to define the trend.
3. Chop Filter: When enabled, this disables signals that would normally appear in sideways price action. This setting is also customizable by the user; there are two settings: candle period and threshold. The candle period is how many candles back does this filter want to look to define its range. The threshold, is the amount of price deviation is allowed from this range in order to disable a signal.
Conclusion:
We believe in providing an all inclusive trading tool to help simplify trading for all traders. The goal is to provide a user-friendly, efficient tool that provides insights into market trends. For it to stand out for its simplicity and effectiveness, as a support tool for decision making.
How to get access:
You can see the Author's instructions to get access to this indicator
RISK DISCLAIMER
All content, tools, scripts & education provided by Monstanzer or Gorb Algo LLC are for informational & educational purposes only. Trading is risk and most lose their money, past performance does not guarantee future results.
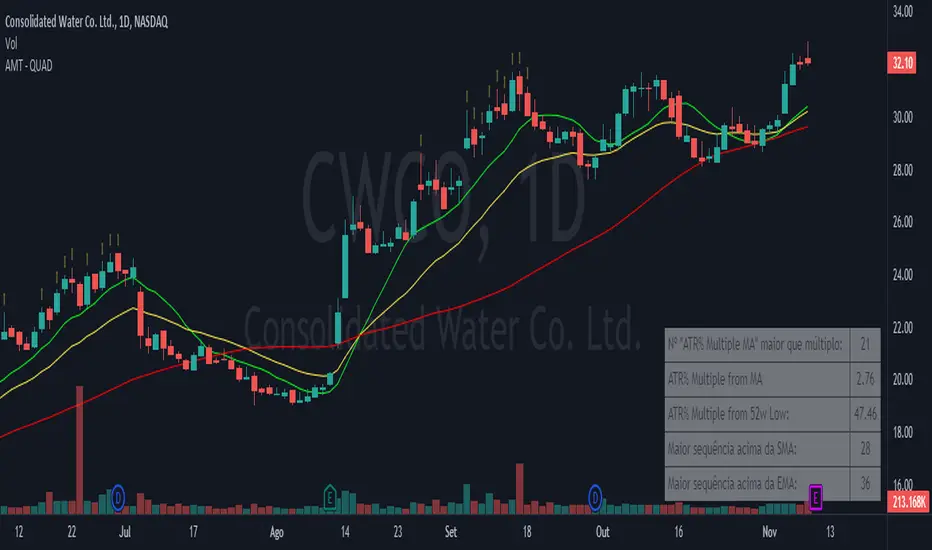
Alpha Momentum Trade - AMT (QUAD Financial)The "Alpha Momentum Trend" indicator was conceived by Tiago Friedrich and programmed by Conrado Villaça.
The indicator description applies to the daily chart. When used on other timeframes, the indicator also changes its signals based on the timeframe used.
It has five fields, from top to bottom:
1. "ATR Multiple MA" greater than multiple: shows how many candles the asset stayed 7 times the ATR (average true range) above the 50-period simple moving average (SMA) in the last 126 candles. The purpose is to identify the strength of the asset because the more times it stayed at this distance from the SMA 50, the greater the acceleration of its prices tends to be, indicating a high momentum asset. You can change the period of the SMA in the indicator settings.
2. ATR% Multiple from MA: shows the multiple of ATR that the asset is from the same SMA as in the upper field. The default is the SMA 50, and the indicator helps identify interesting regions to take profits from long positions. When the asset is more than 7 ATRs above the SMA 50, the asset is considered "stretched," and a correction or price consolidation becomes likely. For high beta assets with a very strong trend, you can use a multiple of 10 ATRs for this purpose.
3. ATR% Multiple from 52w Low: shows the multiple of ATR that the asset is in relation to the 52-week low price. The higher the number, the more the asset has risen relative to its volatility standards, indicating a stronger trend. For momentum traders, it's ideal for the asset to be at least 15 ATRs above the minimum for this period to ensure that it's in a strong uptrend and far from the lows.
4. Longest streak above SMA: within the last 126 candles, it shows the longest streak of days when the asset didn't close below a specific simple moving average. The default definition is with the 10-day SMA, but you can change it in the indicator settings. The more consecutive days the asset can stay above the SMA10, the sign that its trend is consistent and not very volatile, which is desirable. Ideally, an asset should have previously formed an uptrend by staying at least 20 consecutive days above the SMA10.
5. Longest streak above EMA: within the last 126 candles, it shows the longest streak of days when the asset didn't close below a specific exponential moving average. The default definition is with the 21-day EMA, but you can change it in the indicator settings. The more consecutive days the asset can stay above the EMA21, the sign that its trend is consistent and not very volatile, which is desirable. Ideally, an asset should have previously formed an uptrend by staying at least 35 consecutive days above the EMA21.
It's also possible to visualize on the chart the moving averages used for the calculation of the "ATR Multiple MA," "Longest streak above SMA," and "Longest streak above EMA". In the default configuration, this results in a simple 50-day moving average, a simple 10-day moving average, and an exponential 21-day moving average being displayed on the chart, respectively.
Fisher+ [OSC]The Fisher Transform Indicator is classified as an oscillator, meaning that its value swings above and below a central point. This characteristic allows traders to identify overbought and oversold conditions, providing potential clues about market reversals. As mentioned previously, it is an oscillator so the strength of the move is displayed by how long the fisher line stays above/below zero. Indicator can be used to aid in confluence near supply/demand zones.
White Line = Fisher
Red/Blue Line = Moving Average
--Changes color whether fisher line is above/below the MA
Red/Blue Shaded Line = Moving Average
--Changes color based on a smoothing factor
Red/Blue Shaded Fill = Asset in Overbought/Oversold Conditions
Red/Blue Circles = Asset in Extreme Overbought/Oversold Conditions
Red/Blue Triangles = MACD Signals Below/Above "0"
Divergence Labels = Asset Signaling Divergence
The moving average line will turn red/blue as long as the fisher line is below/above the moving average. The shaded MA line will switch colors based on if it is moving in an up/down trend. The MA can also be used as a signal and treated similar to an oscillator. Market trending conditions will either keep the MA below/above the dashed zero line.
MACD code credited to LazyBear's MACD Leader indicator. It is used to filter out/confirm any signals such as divergences. As long as the MACD Leader line is above both the MACD line and signal lines then it'll signal with with a triangle. MACD divergences will be added at a later time.

3x MTF MACD v3.0MACD's on 3 different Time Frames
Indicator Information
- Each Time Frame shows start of Trend and end of trend of the MACD vs the Signal Cross
- They are labled 1,2,3 with respective up or down triangle for possible direction.
User Inputs
- configure the indicator by specifying various inputs. These inputs include colors for bullish
and bearish conditions, the time frame to use, whether to show a Simple Moving Average
(SMA) line, and other parameters.
- Users can choose time frames for analysis (like 30 minutes, 1 hour, etc.)
but they must be in mintues.
- The code also allows users to customize how the indicator looks on the chart by providing
options for position and color.
Main Calculations
- The script calculates the Simple Moving Average (SMA) based on the user-defined time
frame.
- It then determines the color of the plot (line) based on certain conditions, such as whether
the SMA is rising or falling. These conditions help users quickly identify market trends.
Label Creation
- The code creates labels that can be displayed on the chart.
These labels indicate whether there's a bullish or bearish signal.
Level Detection
- The script determines and labels key levels or points of interest in the chart based on
certain conditions.
- It can show labels like "①" and "▲" for bullish conditions and "▼" for bearish conditions.
Table Display
- There's an option to show a table on the chart that displays information about the MACD
indicator Chosen and the NUmber Bubble assocated with that time frame
- The table can include information like which time frame is being analyzed, whether the SMA
line is shown, and other relevant data.
Plotting on the Chart
- The script plots the Simple Moving Average (SMA) on the chart. The color of this line
changes based on the calculated trend conditions.
ATR (Average True Range)
- The script also plots the Average True Range (ATR) on the chart. ATR is used to measure
market volatility.
"In essence, this script is a highly customizable MACD and SMA indicator for traders. It assists traders in comprehending market trends, offering insights into different MACD cycles concerning various timeframes.
Users can configure it to match their trading strategies, and it presents information in a user-friendly manner with colors, labels, and tables.
This simplifies market analysis, allowing traders to make more informed decisions without the distraction of multiple indicators."

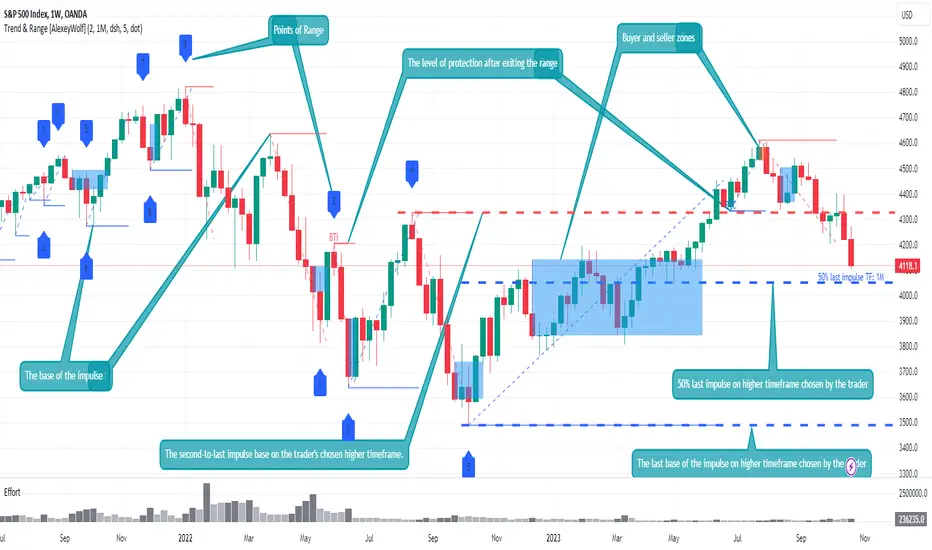
Advanced VSA: Trend and Range LevelsThe indicator is designed for traders who are more interested in market structures and price action using volumes. Analyzing volumes, key market levels, market phases (trend or range/sideways), and multiple timeframes can help the trader build a clearer and more comprehensive view of the market. The data analysis algorithm is developed based on VSA methods, elements of the ICT concept, and the results of my research to assist trader in gaining a better understanding of the market and uncovering information that might go unnoticed.
The key idea is to consider multiple timeframes in trading. Understanding larger market movements from higher timeframes can provide a deeper context when making trading decisions, aiming to assist in more effective entries and exits. This is achieved by identifying the trend and its support levels on multiple timeframes, identifying ranges and their current boundaries, as well as buyer and seller interest zones.
Key Features
Trend Identification: The indicator determines the trend and its current support level. All significant price &movements occur in the form of impulses (either by sellers or buyers). An impulse consists of one or several consecutive candlesticks, at least one of which has a closing price beyond the boundaries of the previous impulse. The indicator displays the base of the impulse and/or the entire impulse. The base of the impulse represents the trend's support level.
Range Identification: The indicator can identify ranges and their current boundaries. Institutional traders take positions within price ranges, and many market reversals occur after flats. A range is a sequential price movement up and down within a specific price range. A range is formed by a minimum of 4 points, 2 above and 2 below, and is defined by its boundaries. The indicator detects ranges based on two (two consecutive impulses in one direction) or three impulses (the first and third in one direction, and the second in the opposite direction). The indicator displays the current boundary points of the range and the level of protection after exiting the range and initiating a trend.
Buyer and seller zones within impulses: After the impulse ends, a correction occurs. It is advisable to look for entry points during this correction in the direction of the impulse from the zone of interest of the owner of the impulse: the buyer's zone for a long impulse and the seller's zone for a short impulse. A zone consists of a series of consecutive candlesticks grouped on the chart in a specific manner.
Multi-Timeframe Trend Identification: The indicator also identifies the trend on two higher timeframes and displays the two latest bases of impulses from those higher timeframes on the chart.
Additional Features
Identification of Test Levels and Effort. A test is the price's return to a zone or to a candle of effort, followed by a continuation in the direction of the initial price movement. It is characterized by the test level. An effort or effort candle is a single candle that is individually larger in volume than the previous 2.
Example Use Cases
You can display the base levels of impulses from a 4-hour time frame and a daily time frame on a 15-minute chart to keep track of important levels from higher timeframes.
By exploring different timeframes, you can identify consolidations (range/sideways movements) and trade within them in the direction of the trend from higher timeframes.
If the market is in a trending phase (the presence of a trend is determined by two consecutive impulses in the same direction), look for trades in the direction of the impulse, following these priorities:
When the impulse base level is protected by the host of the impulse.
During corrections, look for buy trades in the buyer's zone for an uptrend and sell trades in the seller's zone for a downtrend.
During corrections, look for buy trades from a buyer's effort candle for an uptrend and sell trades from a seller's effort candle for a downtrend.
If the market is in a consolidation phase (range), look for trades:
When the current or maximum/minimum historical boundaries of the consolidation (range) are protected, look for trades towards the opposite current boundary.
If the price exits the consolidation/range (closes outside all consolidation boundaries, including both current and historical boundaries), then during corrections, look for trades in the direction of the exit.
Settings
Trend: Display base levels of impulses and/or the entire impulse. Sideways Ranges (Sideways Markets): Display the required number of sideways ranges on the chart, along with protection levels for exiting the sideways range. There are two modes for finding sideways ranges. The first mode requires touching points. The second mode (advanced) does not require precise touching of points if there are increased volumes at the extreme points of the sideways range. Touching these volumes is sufficient for the price.
Zones: Display zones on the chart. Choose the types of displayed zones and their colors. They are divided into three types. The first type is the most promising for finding trades. Type 3 represents more aggressive trades.
Test Levels: Display test levels for zones and efforts on the chart. There are three types of test levels. The first type is the most promising for finding trades. Type 3 is not recommended for finding trades as it represents the most aggressive trades.
Higher Time Frames: Choose 2 timeframes and the types of displayed impulse base lines.
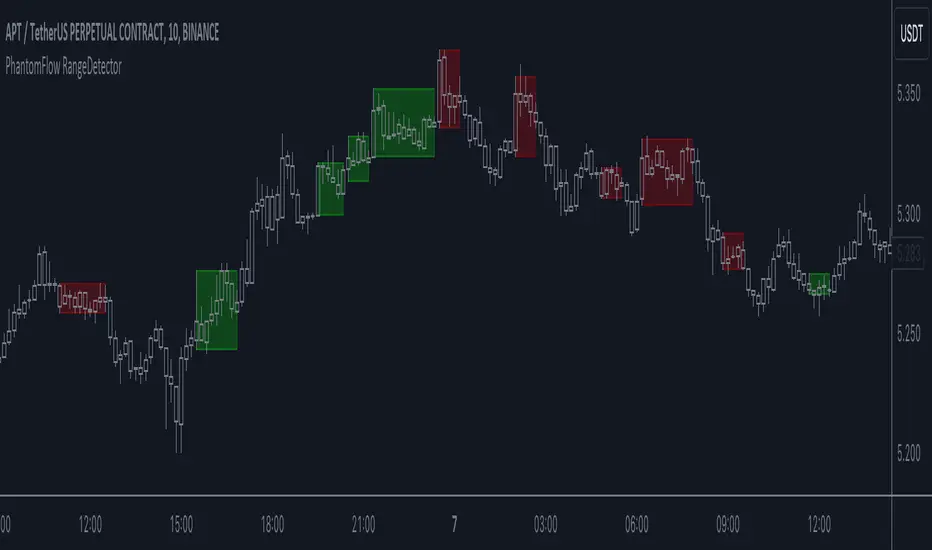
PhantomFlow RangeDetectorPhantomFlow RangeDetector analyzes the current price action of the market and draws ranges depending on the minimum number of bars in the zone of one candle you specify. Each range is colored depending on the closing direction of the candle outside this range. Accordingly, in trend trading, it is advisable to look for long trades from the green zones, and short trades from the red zones (with standard color settings).
If you have a basic understanding of the market context, you can consider such zones in a mirror retest to find trades with higher RR.
TrendSphere (Zeiierman)█ Overview
TrendSphere is designed to capture and visualize market trends and volatility effectively. It combines various volatility measures and trend analysis techniques, producing dynamic bands and a central trend line on the price chart. Its essence is to offer a real-time, reliable estimate of the underlying linear trend in the price.
█ How It Works
Real-Time Trend Estimation
At its core, TrendSphere is designed to offer instantaneous and accurate insights into the inherent linear trend of asset prices. By continually updating its estimations, it ensures traders are equipped with the most current data. This allows the construction of support and resistance bands around the estimated trend, providing trading opportunities.
Dynamic Bands and Trend Line
TrendSphere plots a central trend line and dynamic bands around it on the price chart. Influenced by volatility, the distance between these elements offers a clear view of market conditions and the strength or weakness of trends. These bands not only depict potential turning points but also offer traders valuable opportunities to trade within the confines of the overarching trend.
Volatility Measures
Traders can select their preferred volatility measure and adjust settings to best fit their analysis needs. The bands and trend line dynamically respond to these selections, offering a tailored view of market conditions.
ATR (Average True Range): Reflects market volatility by evaluating the range between high and low prices.
Historical Volatility: Computes price variability using the standard deviation of log returns.
Bollinger Band Width: Measures the distance between Bollinger Bands, providing another angle on market volatility.
Eliminating Common Complications
One of the standout features of TrendSphere is its ability to determine linear price trends without falling prey to challenges like backpainting or repainting. In layman's terms, this means traders get a more trustworthy and unaltered view of price movements, leading to enhanced decision-making in line with the genuine trajectory of price trends.
█ How to Use
Trend Analysis
Observe the central trend line; its direction indicates the prevailing trend. When the price is above the trend line, it suggests an upward trend, and when it's below, it indicates a downward trend.
Volatility Analysis
Wider bands imply higher market volatility, suggesting larger price swings, while narrower bands indicate lower volatility. Traders can use the bands to identify potential reversal points and overbought/oversold conditions.
Potential Trading Signals (Using Bollinger bandwidth as volatility measure)
Consider buying when the price is above the trend line with narrowing bands, suggesting a strong upward trend.
Consider selling when the price is below the trend line with narrowing bands, indicating a strong downward trend.
█ Settings
Select Volatility Measure
Choose the desired volatility measure: ATR, Historical Volatility, or Bollinger Band Width.
Volatility Scaling Factor
Adjusts the scale of the volatility measure, influencing the width of the bands.
Volatility Strength
Modifies the influence of volatility on the bands, adjusting their responsiveness to volatility changes.
Length
Defines the number of periods used in calculating the selected volatility measure, impacting the stability and responsiveness of the bands.
Trend Sensitivity
Adjusts the sensitivity of the trend component, affecting how quickly it reacts to price changes.
█ Related scripts with the same calculation philosophy
TrendCylinder
Predictive Trend and Structure
-----------------
Disclaimer
The information contained in my Scripts/Indicators/Ideas/Algos/Systems does not constitute financial advice or a solicitation to buy or sell any securities of any type. I will not accept liability for any loss or damage, including without limitation any loss of profit, which may arise directly or indirectly from the use of or reliance on such information.
All investments involve risk, and the past performance of a security, industry, sector, market, financial product, trading strategy, backtest, or individual's trading does not guarantee future results or returns. Investors are fully responsible for any investment decisions they make. Such decisions should be based solely on an evaluation of their financial circumstances, investment objectives, risk tolerance, and liquidity needs.
My Scripts/Indicators/Ideas/Algos/Systems are only for educational purposes!

Kalman MomentumKalman Filter
The Kalman Filter is an algorithm used for recursive estimation and filtering of time-series data. It was developed by Rudolf E. Kálmán in the 1960s and has found widespread applications in various fields, including control systems, navigation, signal processing, and finance.
The primary purpose of the Kalman filter is to estimate the state of a dynamic system based on a series of noisy measurements over time. It operates recursively, meaning it processes each new measurement and updates its estimate of the system state as new data becomes available.
Kalman Momentum Indicator
This indicator implements the Kalman Filter to provide a smoothed momentum indicator using returns. The momentum in this indicator is calculated by getting the logarithmic returns and then getting the expected value.
The Kalman calculation in this indicator is used to filter and predict the next value based on the logarithmic returns expected value.
Here's a simplified explanation of the steps and how they are applied in the Script:
State Prediction: Predict the current state based on the previous state estimate.
Error Covariance Prediction: Predict the covariance of the prediction error.
Correction Step:
Kalman Gain Calculation: Calculate the Kalman gain, which determines the weight given to the measurement.
State Correction: Update the state estimate based on the measurement.
Error Covariance Correction: Update the error covariance.
In this Script, the Kalman Filter is applied to estimate the state of the system, with two state variables.
When the Kalman Momentum is above 0, there is positive momentum or positive smoothed expected value.
When the Kalman Momentum is below 0, there is negative momentum or negative smoothed expected value.
How to Use:
Trend Identification:
Positive values of the Kalman Momentum Indicator indicates positive expected value, while negative values suggest negative expected value.
You can look for changes in the sign of the indicator to identify potential shifts in market direction.
Volatility Analysis:
Observe the behavior of the indicator during periods of high and low volatility. Changes in the volatility of the Kalman Momentum Indicator may precede changes in market conditions.
Filtering Noise:
The Kalman Filter is known for its ability to filter out noise in time series data. Use the Kalman Momentum Indicator to filter out the noise in momentum to catch the trend more clearly.
Squeezes:
At time there may be squeezes, and these are zones with low volatility. What could follow after these zones are expansions and huge trending moves.
Indicator Settings:
You can change the source of the calculations.
There is also a lookback for the log returns.
Understanding Expected Value in Trading:
The Expected Value is a fundamental concept that shows the potential outcomes of a trading strategy or individual trade over a series of occurrences. It is a measure that represents the average outcome when a particular action is repeated multiple times.
Images of the indicator:

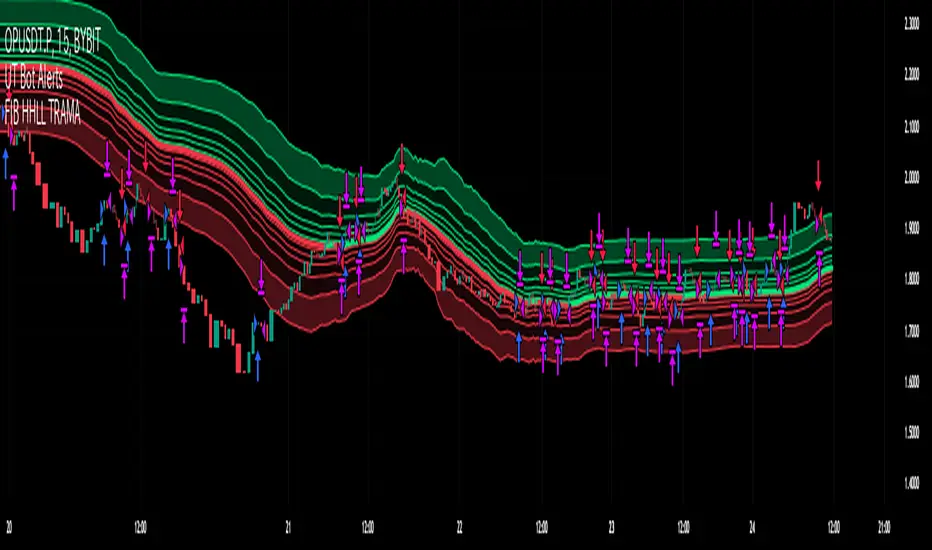
Fibonacci HH LL TRAMA BandLuxAlgo's Trend Moving Adaptive Moving Average was used as a reference to create bands by reading the highest and lowest prices of past bars based on Fibonacci numbers and then multiplying them by the Fibonacci ratio.
LuxAlgo/ LuxAlgo/
In particular, the so-called TRAMA is characterized by its adaptation to the average of the highest and lowest prices over a specific period of time and is used to identify support/resistance.
In order to apply this feature to the maximum extent possible, I used the high or low prices as the source of input, rather than the closing price.
For example,
src = high
not original like
src = close
In addition, I created 6 levels by multiplying the Fibonacci ratio
//Midline
mah = ama1
mal = ama2
m = (mah + mal)/2
//Half Mean Range
dist = (mah - mal)/2
//Levels
h6 = m + dist * 11.089
h5 = m + dist * 6.857
h4 = m + dist * 4.235
h3 = m + dist * 2.618
h2 = m + dist * 1.618
h1 = m + dist * 0.618
l1 = m - dist * 0.618
l2 = m - dist * 1.618
l3 = m - dist * 2.618
l4 = m - dist * 4.235
l5 = m - dist * 6.857
l6 = m - dist * 11.089
If you want to use it for scalping, such as 15 minutes, you can include Fibonacci numbers such as 21,34,55 for a quick reaction type to detect the trend. Also, by including Fibonacci numbers such as 89,144,233, you can see where you stand in the larger trend. Some examples are included below.
For Investors
BTCUSDT 1day Chart Fibonacci number "55"
For Daytraders
BTCUSDT 4hour Chart Fibonacci number "34"
For Scalpers
BTCUSDT 15min Chart Fibonacci number "55"
BTCUSDT 15min Chart Fibonacci number "89"
BTCUSDT 15min Chart Fibonacci number "233"
Fibonacci numbers are 1, 1, 2, 3, 5, 8, 13, 21, 34, 55, 89, 144, 233, 377, 610, etc.,
Fibonacci ratios are 0.618, 1.618, 2.618, 4.236, 6.854, 11.089, etc.,
Predictive Trend and Structure (Expo)█ Overview
The Predictive Trend and Structure indicator is designed for traders seeking to identify future trend directions and interruptions in trend continuation. This indicator is unique because it employs standard deviation to predict upcoming trend directions and potential trend continuation levels. This enables traders to stay ahead of the market.
█ How It Works
This indicator primarily functions based on the calculated standard deviation of the trend over a specified period. It evaluates the trend direction by comparing the current trend value to its previous one and scales the standard deviation, allowing for adjustments in sensitivity to price fluctuations.
█ How to Use
Trend
You can easily identify when a future trend begins by observing where the trend level is displayed. If the price breaks above and remains above the trend, it indicates a bullish trend. Conversely, if the price breaks below and stays below, it signifies a bearish trend.
Support and Resistance
With the Predictive Structure enabled, the indicator aids in identifying potential support and resistance levels.
Trend Continuation Break
Trend continuation breaks occur when prices breaks support or resistance, indicating the existing trend may persist. The indicator plots these levels in advance, allowing traders to quickly identify where trend continuation might occur.
█ Settings
Period for Std Dev: Determines the number of periods used for the standard deviation calculation, impacting the indicator's sensitivity to price changes.
Standard Deviation Scaler: Scales the computed standard deviation, affecting the deviations needed to confirm trends and the indicator's focus on significant trend changes.
Predictive Structure: Enables or disables the prediction of market structures like potential levels of structure breaks/trend continuation breaks.
-----------------
Disclaimer
The information contained in my Scripts/Indicators/Ideas/Algos/Systems does not constitute financial advice or a solicitation to buy or sell any securities of any type. I will not accept liability for any loss or damage, including without limitation any loss of profit, which may arise directly or indirectly from the use of or reliance on such information.
All investments involve risk, and the past performance of a security, industry, sector, market, financial product, trading strategy, backtest, or individual's trading does not guarantee future results or returns. Investors are fully responsible for any investment decisions they make. Such decisions should be based solely on an evaluation of their financial circumstances, investment objectives, risk tolerance, and liquidity needs.
My Scripts/Indicators/Ideas/Algos/Systems are only for educational purposes!

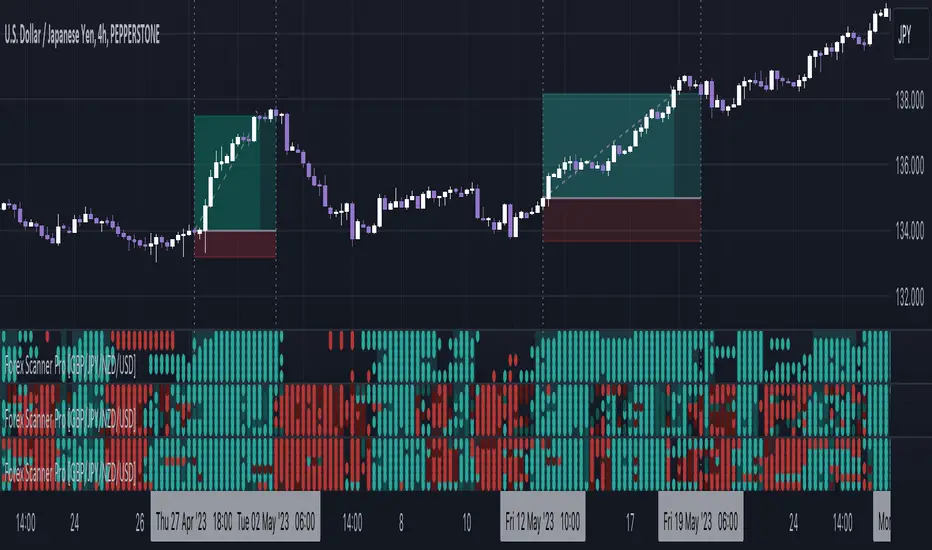
Forex Scanner Pro - GBP/JPY/NZD/USD [FxScripts]Forex Scanner Pro is both a multi-functional indicator and market scanner combined. The combination allows you to have multiple eyes across the market, all from a single chart.
The scanner is comprised of an intuitively designed 3-in-1 tool that tracks the key metrics that drive markets. Each use advanced algorithms to gather information from multiple data points, distilled into one simplified view.
***** TREND SCANNER *****
The first indicator featured on the chart is the Trend Scanner, this allows you to track price action across the wider market. Instantly see pattern shifts and emerging trends; when the market moves, you move with it.
***** MOMENTUM SCANNER *****
The second is the Momentum Scanner which offers a realtime representation of momentum shifts as they occur. This allows you to monitor false breakouts and catch the moves that matter.
***** VOLUME SCANNER *****
The third is the Volume Scanner which provides unique insight into where buy and sell volume is being placed across the market. It offers a further way of determining entry and exit points or simply confirmation that a trend is underway.
***** HOW IT WORKS *****
1. The scanner surveys the market looking for strengths and weaknesses in Trend, Momentum or Volume.
2. It displays the underlying strength or weakness as a series of dots with up to six green dots showing strength and up to six red dots showing weakness.
3. Lighter colored dots are displayed where the strength of the trend, momentum or volume is lesser; if a dot is missing this is a sign of market neutrality.
4. All scanners have a sensitivity setting plus a volatility filter which can be adjusted according to your style of trading and the underlying instrument (full details below).
5. The background can be set to color-fill when the majority of dots are coloured either red or green, with higher values denoting greater strength or greater weakness.
6. Alerts can be configured in the same way as the background to provide both entry and exit signals (further details below).
***** INSTRUMENTS *****
Due to computational restraints, the scanner is split across two different indicators. This one features GBP, JPY, NZD and USD; the other AUD, CAD, CHF and EUR. Both form part of the same package.
Forex Scanner Pro works effortlessly with any of the following major or minor crosses:
AUDCAD, AUDCHF, AUDJPY, AUDNZD, AUDSGD, AUDUSD, CADCHF, CADJPY, CADSGD, CHFJPY, EURAUD, EURCAD, EURCHF, EURGBP, EURJPY, EURNZD, EURSGD, EURUSD, GBPAUD, GBPCAD, GBPCHF, GBPJPY, GBPNZD, GBPSGD, GBPUSD, NZDCAD, NZDCHF, NZDJPY, NZDUSD, SGDJPY, USDCAD, USDCHF, USDJPY, USDSGD
***** SETTINGS OVERVIEW *****
The scanner features the following customizable settings:
~~ Trend Settings ~~
▶ Trend Filter - adjusting this will allow you to focus on short term trends (most suitable for scalping), medium or long term (best for swing trading).
▶ Countertrend Strength - increases the sensitivity of weaker vs stronger countertrends. As countertrends are trends that run against the main trend, this will assist in detecting the strength of a pullback or reversal and allow you to either hold, exit or reverse the trade with confidence.
~~ Momentum Settings ~~
▶ Momentum Filter - increase or decrease the sensitivity of the momentum scanner. Increase to avoid periods of low or weak momentum, decrease to highlight stronger surges in momentum.
~~ Volume Settings ~~
▶ Volume Filter - increase or decrease the sensitivity of the volume scanner. Increase to avoid periods where buy and sell volume can potentially cancel each other out.
~~ Volatility Settings ~~
▶ Volatility Offset - use this to fine tune the volatility filter. A higher value generally delays the volatility filter allowing for confirmation of stronger trends, a lower value will detect trend, momentum or volume movement sooner but may be less accurate.
▶ Each scanner has its own setting allowing you to adjust how you monitor the underlying volatility for each.
▶ As with all settings, we recommend adjusting this to your style of trading, instrument and timeframe.
~~ Alerts ~~
Alerts can be configured to send notifications when anything from 4-6 bullish or bearish dots are showing. Exit markers can be configured when anything from 2+ dots are revealed. This adds an extra layer of sensitivity for traders who appreciate complete control over their trade.
~~ Display Settings ~~
You have the ability to hide all colored dots and only show the background or, alternatively, hide the background and only show colored dots.
***** TRIAL PERIOD *****
We offer a FREE, no questions asked, 7-day trial with every new registration. Visit the link below to register.
RSI Trend Detector PSAR BasedRSI Trend Detector is based on the Direction of PSAR. This indicator helps the easy detection of Trend Direction and Sideways Movement of Price. It was difficult to determine the RSI Trend Direction in a basic RSI indicator. one cannot decide the exact entry point where to enter.
RSI Trend Detector helps with the direction of trend using PSAR direction which is almost instant direction changing indicator with Zero Lag. The color of the RSI changes immediately based on PSAR direction. One can determine the trend whether its in UP / Down or Sideways.
One can easily detect Pullback and entry points using this indicator.
The basic working can be interpreted with a normal default RSI, The only additional feature is the direction of trend using a SAR signal.
Oversold Zone is below 30
Overbought Zone is above 70
how ever RSI above 50 is treated a UP trend and Below 50 as Down Trend.
when RSI is between 40 and 60 price must be considered as Sideways. One can easily interpret the TREND.
Yellow Line = RSI Moving Average
RED and Green Line= RSI
Grey Zone = Sideways
Horizontal line = RSI level 50
Settings can be changed as required.
RSI Line:
RSI Above 50 up trend and Entry when color is green
RSI Below 50 down trend and Entry when color is Red
RSI in Grey Zone is sideways, wait for a breakout
RSI above 50 and color is red then its a pullback in uptrend
RSI below 50 and color is green then its a pullback in downtrend
ALERTS:
Up signal and Down Signal are provided when ever RSI crosses RSIMA
Up Signal: RSI crosses RSI Moving Average upwards
Down Signal: RSI crosses RSI Moving Average Downwards
Hope the Tradingview community likes this.

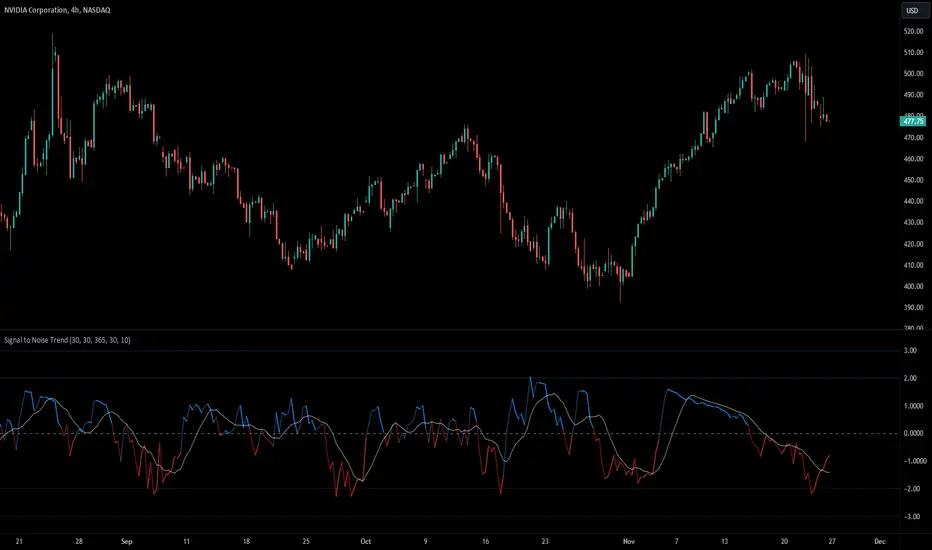
Signal to Noise TrendSignal to Noise Ratio
The Signal to Noise Ratio or SNR is used to assess the quality of information or data by comparing the strength of a useful signal to the presence of background noise or random variations.
In Finance the SNR refers to the ratio of strength of a trading signal to the background noise. A high SNR suggest a clear and reliable signal, meanwhile a low SNR indicates more noise (random fluctuations, volatility, or randomness).
Signal To Noise Trend
This indicator basically calculates the signal to noise of returns and then gets the Z-Score of the signal to noise ratio to find extremes levels of signal and noise. The Lines basically are standard deviations from the mean. 1,2,3 Are standard deviations same with the -1,-2,-3 Lines.
The signal is expressed as the positive Z-Score value, and the Noise is the negative Z-Score Value.
The moving average enhances the indicator ability to display the trend of returns and the trend strength. It provides a smooth representation of the Signal to Nose Ratio values.
There are more trending conditions when there is a higher signal, and there is more "ranging" conditions when there is more noise present in the markets.
The Standard deviations help find extreme levels of signal and noise. If the noise reaches the standard deviation of -3 then that means that there is a extreme negative deviation from the mean, and this would be a rare occurrence, with a lot of noise. This could indicate a potential reversion in market states, and could be followed by a trending move.
Another example is that if the Z-Score value reaches a Standard deviation of 3, this could mean that there is extremely strong and rare signal, and could potentially mean a change to a more noisy environment soon.
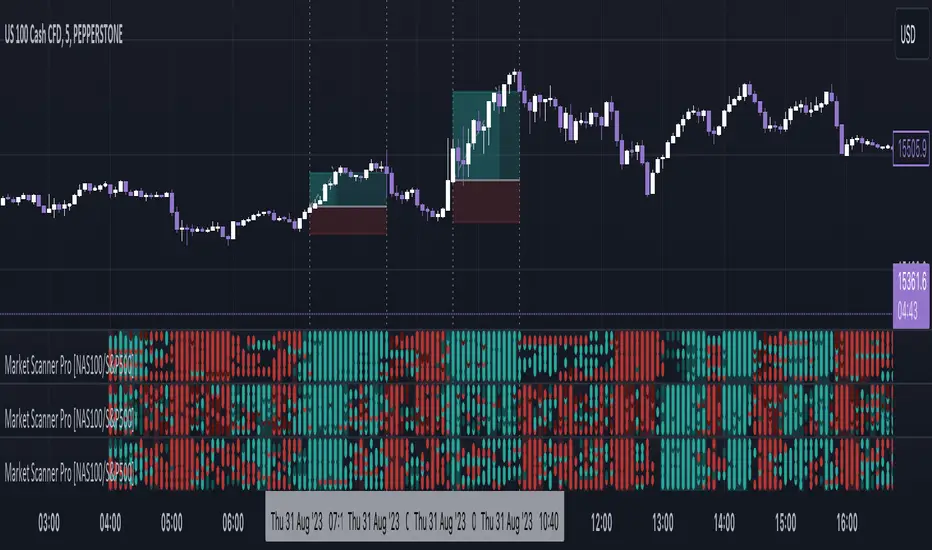
Market Scanner Pro - NAS100/S&P500 [FxScripts]***** OVERVIEW *****
Market Scanner Pro is both a multi-functional indicator and market scanner combined. The combination allows you to have multiple eyes across the market, all from a single chart.
The scanner is comprised of an intuitively designed 3-in-1 tool that tracks the key metrics that drive markets. Each use advanced algorithms to gather information from multiple data points, distilled into one simplified view.
***** TREND SCANNER *****
The first indicator featured on the chart is the Trend Scanner, this allows you to track price action across the wider market. Instantly see pattern shifts and emerging trends; when the market moves, you move with it.
***** MOMENTUM SCANNER *****
The second is the Momentum Scanner which offers a realtime representation of momentum shifts as they occur. This allows you to monitor false breakouts and catch the moves that matter.
***** VOLUME SCANNER *****
The third is the Volume Scanner which provides unique insight into where buy and sell volume is being placed across the market. It offers a further way of determining entry and exit points or simply confirmation that a trend is underway.
***** HOW IT WORKS *****
1. The scanner surveys the market looking for strengths and weaknesses in Trend, Momentum or Volume.
2. It displays the underlying strength or weakness as a series of dots with up to 10 green dots showing strength and up to 10 red dots showing weakness.
3. Lighter colored dots are displayed where the strength of the trend, momentum or volume is lesser; if a dot is missing this is a sign of market neutrality.
4. All scanners have a sensitivity setting plus a volatility filter which can be adjusted according to your style of trading and the underlying instrument (full details below).
5. The background can be set to color-fill when the majority of dots are coloured either red or green, with higher values denoting greater strength or greater weakness.
6. Alerts can be configured in the same way as the background to provide both entry and exit signals (further details below).
***** INSTRUMENTS *****
Market Scanner Pro is made up of both a European and US indices scanner, both forming part of the same package.
European features the DAX40 and FTSE100; US (this scanner) features the NAS100 plus S&P500. The US scanner works on futures and options such as ES, NQ, QQQ, SPX and SPY.
***** SETTINGS OVERVIEW *****
The scanner features the following customizable settings:
~~ Trend Settings ~~
▶ Trend Filter - adjusting this will allow you to focus on short term trends (most suitable for scalping), medium or long term (best for swing trading).
▶ Countertrend Strength - increases the sensitivity of weaker vs stronger countertrends. As countertrends are trends that run against the main trend, this will assist in detecting the strength of a pullback or reversal and allow you to either hold, exit or reverse the trade with confidence.
~~ Momentum Settings ~~
▶ Momentum Filter - increase or decrease the sensitivity of the momentum scanner. Increase to avoid periods of low or weak momentum, decrease to highlight stronger surges in momentum.
~~ Volume Settings ~~
▶ Volume Filter - increase or decrease the sensitivity of the volume scanner. Increase to avoid periods where buy and sell volume can potentially cancel each other out.
~~ Volatility Settings ~~
▶ Volatility Offset - use this to fine tune the volatility filter. A higher value generally delays the volatility filter allowing for confirmation of stronger trends, a lower value will detect trend, momentum or volume movement sooner but may be less accurate.
▶ Each scanner has its own setting allowing you to adjust how you monitor the underlying volatility for each.
▶ As with all settings, we recommend adjusting this to your style of trading, instrument and timeframe.
~~ Alerts ~~
Alerts can be configured to send notifications when anything from 6-10 bullish or bearish dots are showing. Exit markers can be configured when anything from 2+ dots are revealed. This adds an extra layer of sensitivity for traders who appreciate complete control over their trade.
~~ Display Settings ~~
You have the ability to hide all colored dots and only show the background or, alternatively, hide the background and only show colored dots.
***** TRIAL PERIOD *****
We offer a FREE, no questions asked, 7-day trial with every new registration. Visit the link below to register.
Market Scanner Pro - DAX/FTSE [FxScripts]***** OVERVIEW *****
Market Scanner Pro is both a multi-functional indicator and market scanner combined. The combination allows you to have multiple eyes across the market, all from a single chart.
The scanner is comprised of an intuitively designed 3-in-1 tool that tracks the key metrics that drive markets. Each use advanced algorithms to gather information from multiple data points, distilled into one simplified view.
***** TREND SCANNER *****
The first indicator featured on the chart is the Trend Scanner, this allows you to track price action across the wider market. Instantly see pattern shifts and emerging trends; when the market moves, you move with it.
***** MOMENTUM SCANNER *****
The second is the Momentum Scanner which offers a realtime representation of momentum shifts as they occur. This allows you to monitor false breakouts and catch the moves that matter.
***** VOLUME SCANNER *****
The third is the Volume Scanner which provides unique insight into where buy and sell volume is being placed across the market. It offers a further way of determining entry and exit points or simply confirmation that a trend is underway.
***** HOW IT WORKS *****
1. The scanner surveys the market looking for strengths and weaknesses in Trend, Momentum or Volume.
2. It displays the underlying strength or weakness as a series of dots with up to 10 green dots showing strength and up to 10 red dots showing weakness.
3. Lighter colored dots are displayed where the strength of the trend, momentum or volume is lesser; if a dot is missing this is a sign of market neutrality.
4. All scanners have a sensitivity setting plus a volatility filter which can be adjusted according to your style of trading and the underlying instrument (full details below).
5. The background can be set to color-fill when the majority of dots are coloured either red or green, with higher values denoting greater strength or greater weakness.
6. Alerts can be configured in the same way as the background to provide both entry and exit signals (further details below).
***** INSTRUMENTS *****
Market Scanner Pro is made up of both a European and US indices scanner, both forming part of the same package.
European (this scanner) features the DAX40 and FTSE100; US features the NAS100 plus S&P500. The US scanner works on futures and options such as ES, NQ, QQQ, SPX and SPY.
***** SETTINGS OVERVIEW *****
The scanner features the following customizable settings:
~~ Trend Settings ~~
▶ Trend Filter - adjusting this will allow you to focus on short term trends (most suitable for scalping), medium or long term (best for swing trading).
▶ Countertrend Strength - increases the sensitivity of weaker vs stronger countertrends. As countertrends are trends that run against the main trend, this will assist in detecting the strength of a pullback or reversal and allow you to either hold, exit or reverse the trade with confidence.
~~ Momentum Settings ~~
▶ Momentum Filter - increase or decrease the sensitivity of the momentum scanner. Increase to avoid periods of low or weak momentum, decrease to highlight stronger surges in momentum.
~~ Volume Settings ~~
▶ Volume Filter - increase or decrease the sensitivity of the volume scanner. Increase to avoid periods where buy and sell volume can potentially cancel each other out.
~~ Volatility Settings ~~
▶ Volatility Offset - use this to fine tune the volatility filter. A higher value generally delays the volatility filter allowing for confirmation of stronger trends, a lower value will detect trend, momentum or volume movement sooner but may be less accurate.
▶ Each scanner has its own setting allowing you to adjust how you monitor the underlying volatility for each.
▶ As with all settings, we recommend adjusting this to your style of trading, instrument and timeframe.
~~ Alerts ~~
Alerts can be configured to send notifications when anything from 6-10 bullish or bearish dots are showing. Exit markers can be configured when anything from 2+ dots are revealed. This adds an extra layer of sensitivity for traders who appreciate complete control over their trade.
~~ Display Settings ~~
You have the ability to hide all colored dots and only show the background or, alternatively, hide the background and only show colored dots.
***** TRIAL PERIOD *****
We offer a FREE, no questions asked, 7-day trial with every new registration. Visit the link below to register.

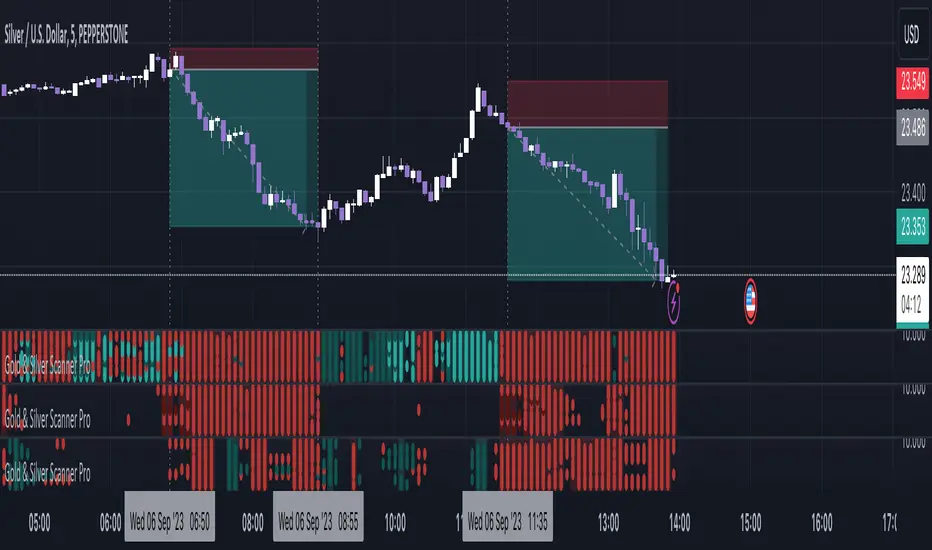
Gold & Silver Scanner Pro [FxScripts]***** FEATURES *****
Gold & Silver Scanner Pro is both a multi-functional indicator and market scanner combined. The combination allows you to have multiple eyes across the market, all from a single chart.
The scanner is comprised of an intuitively designed 3-in-1 tool that tracks the key metrics that drive markets. Each use advanced algorithms to gather information from multiple data points, distilled into one simplified view.
***** TREND SCANNER *****
The first indicator featured on the chart is the Trend Scanner, this allows you to track price action across the wider market. Instantly see pattern shifts and emerging trends; when the market moves, you move with it.
***** MOMENTUM SCANNER *****
The second is the Momentum Scanner which offers a realtime representation of momentum shifts as they occur. This allows you to monitor false breakouts and catch the moves that matter.
***** VOLUME SCANNER *****
The third is the Volume Scanner which provides unique insight into where buy and sell volume is being placed across the market. It offers a further way of determining entry and exit points or simply confirmation that a trend is underway.
***** HOW IT WORKS *****
1. The scanner surveys the market looking for strengths and weaknesses in Trend, Momentum or Volume.
2. It displays the underlying strength or weakness as a series of dots with up to nine green dots showing strength and up to nine red dots showing weakness (nine data points in total).
3. Lighter colored dots are displayed where the strength of the trend, momentum or volume is lesser; if a dot is missing this is a sign of market neutrality.
4. All scanners have a sensitivity setting plus a volatility filter which can be adjusted according to your style of trading and the underlying instrument (full details below).
5. The background can be set to color-fill when the majority of dots are coloured either red or green, with higher values denoting greater strength or greater weakness.
6. Alerts can be configured in the same way as the background to provide both entry and exit signals (further details below).
***** INSTRUMENTS *****
Gold & Silver Scanner Pro works effortlessly with any of the XAG and XAU major or minor crosses:
XAGAUD, XAGCHF, XAGEUR, XAGGBP, XAGJPY, XAGUSD, XAUAUD, XAUCHF, XAUEUR, XAUGBP, XAUJPY, XAUUSD
Plus the following gold and silver futures:
GC, SI
***** SETTINGS OVERVIEW *****
The scanner features the following customizable settings:
~~ Trend Settings ~~
▶ Trend Filter - adjusting this will allow you to focus on short term trends (most suitable for scalping), medium or long term (best for swing trading).
▶ Countertrend Strength - increases the sensitivity of weaker vs stronger countertrends. As countertrends are trends that run against the main trend, this will assist in detecting the strength of a pullback or reversal and allow you to either hold, exit or reverse the trade with confidence.
~~ Momentum Settings ~~
▶ Momentum Filter - increase or decrease the sensitivity of the momentum scanner. Increase to avoid periods of low or weak momentum, decrease to highlight stronger surges in momentum.
~~ Volume Settings ~~
▶ Volume Filter - increase or decrease the sensitivity of the volume scanner. Increase to avoid periods where buy and sell volume can potentially cancel each other out.
~~ Volatility Settings ~~
▶ Volatility Offset - use this to fine tune the volatility filter. A higher value generally delays the volatility filter allowing for confirmation of stronger trends, a lower value will detect trend, momentum or volume movement sooner but may be less accurate.
▶ Each scanner has its own setting allowing you to adjust how you monitor the underlying volatility for each.
▶ As with all settings, we recommend adjusting this to your style of trading, instrument and timeframe.
~~ Alerts ~~
Alerts can be configured to send notifications when anything from 5-9 bullish or bearish dots are showing. Exit markers can be configured when anything from 2+ dots are revealed. This adds an extra layer of sensitivity for traders who appreciate complete control over their trade.
~~ Display Settings ~~
You have the ability to hide all colored dots and only show the background or, alternatively, hide the background and only show colored dots.
***** TRIAL PERIOD *****
We offer a FREE, no questions asked, 7-day trial with every new registration. Visit the link below to register.
TrendCylinder (Expo)█ Overview
The TrendCylinder is a dynamic trading indicator designed to capture trends and volatility in an asset's price. It provides a visualization of the current trend direction and upper and lower bands that adapt to volatility changes. By using this indicator, traders can identify potential breakouts or support and resistance levels. While also gauging the volatility to generate trading ranges. The indicator is a comprehensive tool for traders navigating various market conditions by providing a sophisticated blend of trend-following and volatility-based metrics.
█ How It Works
Trend Line: The trend line is constructed using the closing prices with the influence of volatility metrics. The trend line reacts to sudden price changes based on the trend factor and step settings.
Upper & Lower Bands: These bands are not static; they are dynamically adjusted with the calculated standard deviation and Average True Range (ATR) metrics to offer a more flexible, real-world representation of potential price movements, offering an idea of the market's likely trading range.
█ How to Use
Identifying Trends
The trend line can be used to identify the current market trend. If the price is above the trend line, it indicates a bullish trend. Conversely, if the price is below the trend line, it indicates a bearish trend.
Dynamic Support and Resistance
The upper and lower bands (including the trend line) dynamically change with market volatility, acting as moving targets of support and resistance. This helps set up stop-loss or take-profit levels with a higher degree of accuracy.
Breakout vs. Reversion Strategies
Price movements beyond the bands could signify strong trends, making it ideal for breakout strategies.
Fakeouts
If the price touches one of the bands and reverses direction, it could be a fakeout. Traders may choose to trade against the breakout in such scenarios.
█ Settings
Volatility Period: Defines the look-back period for calculating volatility. Higher values adapt the bands more slowly, whereas lower values adapt them more quickly.
Trend Factor: Adjusts the sensitivity of the trend line. Higher values produce a smoother line, while lower values make it more reactive to price changes.
Trend Step: Controls the pace at which the trend line adjusts to sudden price movements. Higher values lead to a slower adjustment and a smoother line, while lower values result in quicker adjustments.
-----------------
Disclaimer
The information contained in my Scripts/Indicators/Ideas/Algos/Systems does not constitute financial advice or a solicitation to buy or sell any securities of any type. I will not accept liability for any loss or damage, including without limitation any loss of profit, which may arise directly or indirectly from the use of or reliance on such information.
All investments involve risk, and the past performance of a security, industry, sector, market, financial product, trading strategy, backtest, or individual's trading does not guarantee future results or returns. Investors are fully responsible for any investment decisions they make. Such decisions should be based solely on an evaluation of their financial circumstances, investment objectives, risk tolerance, and liquidity needs.
My Scripts/Indicators/Ideas/Algos/Systems are only for educational purposes!

Crypto Scanner Pro [FxScripts]***** FEATURES *****
Crypto Scanner Pro is both an indicator and market scanner combined. The combination allows you to have multiple eyes across the market, all from a single chart.
Each scanner is comprised of an intuitively designed 3-in-1 tool that tracks the key metrics that drive markets.
They each use advanced algorithms to gather information from multiple data points, distilled into one simplified view.
***** TREND SCANNER *****
The Trend Scanner allows you to track price action across the wider market. Instantly see pattern shifts and emerging trends; when the market moves, you can move with it.
***** MOMENTUM SCANNER *****
The Momentum Scanner offers realtime insights into momentum shifts as they occur. This allows you to monitor false breakouts and catch the moves that matter.
***** VOLUME SCANNER *****
The Volume Scanner provides unique indications into where buy and sell volume is being placed. It offers a further way of determining entry and exit points or simply confirmation that a trend is underway.
***** INSTRUMENTS *****
Crypto Scanner Pro works effortlessly with the following large cap coins:
Avalanche, Bitcoin Cash, Bitcoin, BITO, BNB, Cardano, Chainlink, Dogecoin, Ethereum, Litecoin, Polkadot, Polygon, Shiba Inu, Solana, Stellar, Toncoin, XRP (Ripple) *
***** SETTINGS OVERVIEW *****
The scanner features the following customizable settings:
~~ Trend Settings ~~
Trend Filter - adjusting this will allow you to focus on short term trends (most suitable for scalping), medium or long term (best for swing trading).
Countertrend Strength - increases the sensitivity of weaker vs stronger countertrends. As countertrends are trends that run against the main trend, this will assist in detecting the strength of a pullback or reversal and allow you to either hold, exit or reverse the trade with confidence.
~~ Momentum Settings ~~
Momentum Filter - increase or decrease the sensitivity of the momentum scanner. Increase to avoid periods of low or weak momentum, decrease to highlight stronger surges in momentum.
~~ Volume Settings ~~
Volume Filter - increase or decrease the sensitivity of the volume scanner. Increase to avoid periods where buy and sell volume can potentially cancel each other out.
~~ Volatility Settings ~~
Volatility Offset - use this to fine tune the volatility filter. A higher value generally delays the volatility filter allowing for confirmation of stronger trends, a lower value will detect trend, momentum or volume movement sooner but may be less accurate.
Each scanner has its own setting allowing you to adjust how you monitor the underlying volatility for each.
As with all settings, we recommend adjusting this to your style of trading, instrument and timeframe.
~~ Alerts ~~
Alerts can be configured to send notifications when anything from 6-10 bullish or bearish dots are showing. Exit markers can be configured when anything from 2+ dots are revealed. This adds an extra layer of sensitivity for traders who appreciate complete control over their trade.
~~ Display Settings ~~
You have the ability to hide all colored dots and only show the background or, alternatively, hide the background and only show colored dots.
***** TRIAL PERIOD *****
We offer a FREE, no questions asked, 7-day trial with every new registration. Visit the link below to register.
* list subject to change as coins increase or decrease in popularity
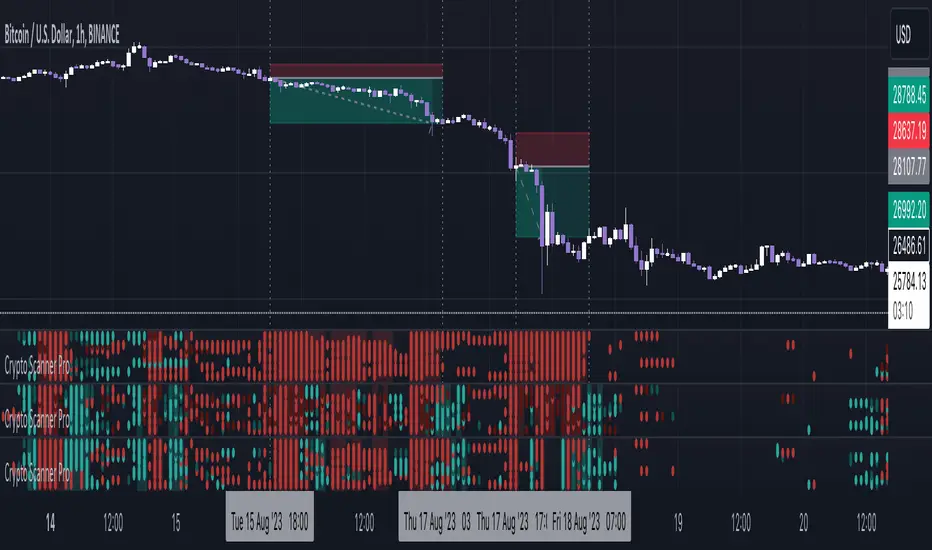
Volume Delta Trailing Stop [LuxAlgo]The ' Volume Delta Trailing Stop ' indicator uses Lower Time Frame (LTF) volume delta data which can provide potential entries together with a Volume-Delta based Trailing Stop-line .
🔶 USAGE
Our 'Volume Delta Trailing Stop' script can show potential entries/Stop Loss lines
A trigger line needs to be broken before a position is taken, after which a Volume Delta-controlled Trailing Stop-line is created:
🔶 DETAILS
🔹 Volume rises when bought or sold
🔹 When the opening price appears on the chart, a buy/sell order has been executed.
If that order is less than the available supply of that particular price, volume will rise, without moving the price.
🔹 When the opening price is the same as the closing price, the volume of that bar can be seen as "neutral volume" (nV); nor "up", nor "down" volume.
Example
A buy order doesn't fill the first available supply in the order book. This price will be the opening price with a certain volume.
When at closing time, price still hasn't moved (the first available supply in the order book isn't filled, or no movement downwards),
the closing price will be equal to the opening price, but with volume. This can be seen as "neutral volume (nV)".
🔹 Delta Volume (ΔV): this is "up volume" minus "down volume"
🔹 Standard volume is colored red when closing price is lower than opening price ( = "down volume").
🔹 Standard volume is colored green when closing price is higher OR equal (nV) than opening price ( = "up volume").
🔹 Neutral Volume
The "Neutral-Volume" is considered "Up-Volume" - setting will dictate whether nV is considered as green 'buy' volume or not.
🔶 EXAMPLE
29 July 10:00 -> 10:05, chart timeframe 5 minutes, open 29311.28, close 29313.89
close > open, so the volume (39.55) is colored green ("up volume").
(The Volume script used in the following examples is the open-source publication Volume Columns w. Alerts (V) from LucF )
Let's zoom to the 1-minute TF:
The same period is now divided into more bars, volume direction (color) is dependable on the difference between open and close.
Counting up and down volume gives a more detailed result, it remains in an upward direction though):
(ΔV = +15.51)
Let's further zoom in to the 1-second TF:
The same period is now divided into even more bars (more possibility for changing direction on each bar)
Here we see several bars that haven't moved in price, but they have volume ("neutral" volume).
(neutral volume is coloured light green here, while up volume is coloured darker green)
When we count all green and red volume bars, the result is quite different:
(ΔV = -0.35)
In total more volume is found when price went downwards, yet price went up in these 5 minutes.
-> This is the heart of our publication, when this divergence occurs, you can see a barcolor changement:
• orange: when price went up, but LTF Volume was mainly in a downward direction.
• blue: when price went down, but LTF Volume was mainly in an upwards direction.
When we split the green "up volume" into "up" and "neutral", the difference is even higher
(here "neutral volume" is colored grey):
(ΔV = -12.76; "up" - "down")
🔶 CONCEPTS
bullishBear = current bar is red but LTF volume is in upward direction -> blue bar
bearishBull = current bar is green but LTF volume is in downward direction -> orange bar
🔹 Potential positioning - forming of Trigger-line
When not in position, the script will wait for a divergence between price and volume direction. When found, a Trigger-line will appear:
• at high when a blue bar appears ( bullishBear ).
• at low when an orange bar appears ( bearishBull ).
Next step is when the Trigger-line is broken by close or high/low (settings: Trigger )
Here, the closing price went under the grey Trigger-line -> bearish position:
🔹 Trailing Stop-line
When the Trigger-line is broken, the Trailing Stop-line (TS-line) will start:
• low when bullish position
• high when bearish position
You can choose (settings -> Trigger -> Close or H/L ) whether close price or high/low should break the Trigger-line
When alerts are enabled ("Any alert() function call"), you'll get the following message:
• ' signal up ' when bullish position
• ' signal down' when bearish position
After that, the TS-line will be adjusted when:
• a blue bullishBear bar appears when in bullish position -> lowest of {low , previous blue bar's high or orange bar's low}
• an orange bearishBull bar appears when in bearish position -> highest of {high, previous blue bar's high or orange bar's low}
When alerts are enabled ("Any alert() function call"), and the TS-line is broken, you'll get the following message:
• ' TS-line broken down ' when out bullish position
• ' TS-line broken up ' when out bearish position
🔹 Reference Point
Default the direction of price will be evaluated by comparing closing price with opening price.
When open and close are the same, you'll get "neutral volume".
You can use "previous close" instead (as in built-in volume indicator) to include gaps.
If close equals open , but close is lower than previous close , it will be regarded as " down volume ",
similar, when close is higher than previous close , it will be regarded as " up volume "
Note, the setting applies for the current timeframe AND Lower timeframe:
Based on: " open " (close - open)
Based on: " previous close " (close - previous close)
🔹 Adjustment
When the TS-line changes, this can be adjusted with a percentage of price , or a multiple of " True Range "
Default (Δ line -> Adjustment - 0)
Δ line -> Adjustment 0.03% (of price)
Δ line -> Mult of TR (10)
🔶 SETTINGS
🔹 LTF: choose your Lower TimeFrame: 1S (seconds), 5S, 10S, 15S, 30S, 1 minute)
🔹 Trigger: Choose the trigger for breaking the Trigger-line ; close or H/L (high when bullish position, low when bearish position)
🔹 Δ line ( Trailing Stop-line ): add/subtract an adjustment when the TS-line changes ( default: Adjustment ):
• Adjustment ( default: 0 ): add/subtract an extra % of price
• Mult of TR : add/subtract a multiple of True Range
🔹 Based on: compare closing price against:
• open
• previous close
🔹 "Neutral-Volume" is considered "Up-Volume" : this setting will dictate whether nV is considered as green 'buy' volume or not.
🔶 CONSIDERATIONS
🔹 The lowest LTF (1S) will give you more detail and will get data close to tick data.
However, a maximum of 100,000 intrabars can be used in calculations .
This means on the daily chart you won't see anything since 1 day ~ 86400 seconds. (just over 1 bar)
-> choose a lower chart timeframe, or choose a higher LTF (5S, 10S, ... 1 minute)
🔹 Always choose a LTF lower than the current chart timeframe.
🔹 Pine Script™ code using this request.security_lower_tf() may calculate differently on historical and real-time bars, leading to repainting .
