TrendMaAlignmentStrategy - Long term tradesThis is another strategy based on moving average alignment and HighLow periods. This is more suitable for long term trend traders and mainly for stocks.
Candle is colored lime if : Lookback Period has at least one bar with moving averages fully aligned OR None of the bars in Lookback periods has negatively aligned moving averages (More than half are positively aligned).
Candle is colored orange if : Lookback Period has at least one bar with moving averages fully aligned in negative way OR none of the bars in lookback has positively aligned moving averages (More than half are negatively aligned).
If either of above conditions are met, candle is colored silver.
Moving average alignment parameters:
Moving Average Type : MA Type for calculating Aligned Moving Average Index
Lookback Period : Lookback period to check highest and lowest Moving Average index.
HighLow parameters:
Short High/Low Period: Short period to check highs and lows
Long High/Low Period: Longer Period to check highs and lows.
If short period high == long period high, which means, instrument has made new high in the short period.
ATR Parameters:
ATR Length: ATR periods
StopMultiplyer: To set stop loss.
ReentryStopMultiplyer: This is used when signal is green buy stop loss on previous trade is hit. In such cases, new order will not be placed until it has certain distance from stop line.
Trade Prameters:
Exit on Signal : To be used with caution. Enabling it will allow us to get out on bad trades early and helps exit trades in long consolidation periods. But, this may also cause early exit in the trend. If instrument is trending nicely, it is better to keep this setting unchecked.
Trade direction : Default is long only. Short trades are not so successful in backtest. Use it with caution.
Backtest years : limit backtesting to certain years.
Part of the logic used from study's below:
Other strategies based on these two studies are below (which are meant for short - medium terms):
Trendtrading

Trend Algo (Zeiierman)█ Overview
Trend Algo (Zeiierman) converts raw price movement into a cohesive, volatility-aware trend map. Rather than static moving averages, it builds an adaptive trend core that responds to market state changes, then layers regime-sensitive clouds (Infinite Sky) and horizon-bounded channels (HorizonX), plus precise trend-change and continuation signals. The result is a clean framework for reading direction, timing pullbacks, and validating momentum.
The indicator visualizes the active trend line, adaptive clouds, and stateful signals to reveal transition zones, trend acceleration, and exhaustion. It suits intraday execution, swing confirmations, and structural regime assessment.
⚪ Why This One Is Unique
Unlike conventional trend tools, this version combines volatility-normalized trend estimation, AI-style regime clustering, and horizon-bounded support/resistance channels. Its framework uses multi-phase smoothing, adaptive width scaling, and state detection that aligns entries and continuations with current market inertia—reducing whipsaw while preserving responsiveness.
█ Main features
⚪ Dynamic Clouds
The Dynamic Trend Line provides a stabilized, noise-aware trajectory of price, color-coded by directional bias. Two cloud systems overlay the core trend:
Infinite Sky (AI) — a regime-aware cloud that distinguishes fast vs. slow trend states.
HorizonX — adaptive channels that operate as dynamic support/resistance and define trend boundaries.
⚪ Candle Coloring
The candle coloring is designed to highlight trend momentum peaks, allowing you to instantly recognize when the trend is accelerating or slowing down. This visual feedback makes it easier to interpret the strength and speed of directional moves directly on the chart, seamlessly complementing the Dynamic Trend Line and Cloud systems.
⚪ Trend Change Signals & Trend Continuation Signals
The main signals are the Trend Change Signals , designed to trigger when the current trend structure begins to shift its state. These signals give you an instant sense of when a potential trend reversal or directional change might occur.
To complement them, we’ve added Trend Continuation Signals , which only activate within an established trend. These signals confirm the current direction and indicate that the trend is gaining strength and preparing for another move in the same direction.
⚪ Trend Line
Two types of trend lines are integrated: Stability and Dynamic.
The Stability Line follows the current price action in a smooth, drift-like manner — staying closer to price to act as a faster support and resistance zone.
The Dynamic Line adapts to volatility, ensuring that continuous movements within the trend are taken into account. This helps traders stay aligned with the trend and capture extended moves during periods of higher market activity.
█ How to Use
⚪ Trend Changes
Trend Change Signals appear when the current trend structure begins to shift, signaling a potential reversal or directional transition. These signals help traders anticipate moments when momentum weakens or changes direction, offering early insight into possible turning points in the market. Combine Trend Change Signals with Candle Coloring or Cloud behavior to confirm entries and strengthen trend reversal validation.
⚪ Trend Continuations
Trend Continuation Signals trigger within an established trend, confirming that the current direction remains strong. They often appear after pullbacks or pauses, suggesting that the market is ready for another move in the same direction. These signals work best when paired with the Dynamic Trend Line, allowing traders to stay confidently aligned with powerful ongoing trends.
⚪ Support and Resistance
The Stability Trend Line acts as a reactive support and resistance guide, staying close to price and highlighting areas where market reactions are most likely to occur. It offers traders a clear view of short-term structure and helps identify potential bounce or rejection zones with precision.
The Dynamic Trend Line adapts to volatility, forming flexible support and resistance zones that expand during strong momentum and contract during quieter phases, keeping the visual structure balanced and responsive to changing market conditions.
HorizonX defines the outer adaptive boundaries of the trend. These dynamic channels operate as broader support and resistance frameworks, helping traders anticipate trend exhaustion or continuation zones beyond the immediate price action.
The Infinite Sky (AI) cloud adds a regime-aware layer that distinguishes fast and slow trend states, visually framing the strength of support or resistance regions as they evolve and allowing traders to read both momentum and structure in a single glance.
█ How It Works
⚪ Dynamic Trend Core
A volatility-normalized estimator generates the primary trajectory and color state, balancing stability vs. agility by adapting to dispersion and displacement.
Calculation: Multi-phase weighted smoothing with volatility-scaled adjustments and adaptive phase control to minimize lag while preserving curvature.
⚪ Infinite Sky (AI Regime Cloud)
Differentiates fast vs. slow trend states and paints a regime-aware cloud that guides timing and risk.
Calculation: Windowed return modeling (with optional consolidation), two-pole response filtering, and distribution-center clustering to classify regimes and modulate the envelope.
⚪ HorizonX Trend Channels
Defines dynamic support/resistance “horizons” that expand/contract with conditions and filter counter-trend noise when strong-trend mode is enabled.
Calculation: A volatility-aware core that evolves with changing price dynamics, maintaining precision across all market conditions.
⚪ Trend Line & Continuations
A fast reaction line confirms pullbacks and validates continuation only when aligned with prevailing bias and structure.
Calculation: Short-horizon smoothing with phase-managed weighting, slope/position gating, and context checks against regime and horizon levels.
⚪ Impulse Detection
Identifies statistically meaningful bursts that precede expansion or warn of exhaustion after extended runs.
Calculation: Nonlinear impulse-response mapping emphasizing second-order changes in directional energy while suppressing micro-noise.
⚪ Trend Bands
Upper/lower bands visualize the active envelope for timing adds, trims, or exits within trend.
Calculation: Percentile-guided banding blended with adaptive anchors to retain structural relevance through regime shifts.
⚪ Bar Color Integration
Bars can inherit trend/gradient context to make state shifts obvious at a glance.
Calculation: Algorithmic gradient model integrating directional momentum intensity to render bar coloration in sync with market flow.
-----------------
Disclaimer
The content provided in my scripts, indicators, ideas, algorithms, and systems is for educational and informational purposes only. It does not constitute financial advice, investment recommendations, or a solicitation to buy or sell any financial instruments. I will not accept liability for any loss or damage, including without limitation any loss of profit, which may arise directly or indirectly from the use of or reliance on such information.
All investments involve risk, and the past performance of a security, industry, sector, market, financial product, trading strategy, backtest, or individual's trading does not guarantee future results or returns. Investors are fully responsible for any investment decisions they make. Such decisions should be based solely on an evaluation of their financial circumstances, investment objectives, risk tolerance, and liquidity needs.
Tập lệnh trả phí

Breakout Trend Trading Strategy - V2This is an alternate version of Breakout Trend Trading Strategy - V1
Only difference is, this strategy places stop orders based on calculated targets whereas V1 waits for price to close target levels and then places market orders. Hence, you will receive the target prices before trade executes in strategy.
Parameters are same as that of Breakout Trend Trading Strategy - V1
There is one additional parameter on Trade Type - which permits user to allow only breakout, pullback or reverse trading or combination of all.
Backtesting parameters remain same :
Capital and position sizing : Capital and position sizing parameters are set to test investing 2000 wholly on certain stock without compounding.
Initial Capital : 2000
Order Size : 100% of equity
Pyramiding : 1
Test cases remain same :
Positive : AAPL , AMZN , TSLA , RUN, VRT , ASX:APT
Negative Test Cases: WPL , WHC , NHC , WOW, COL, NAB (All ASX stocks)
Special test case: WDI
Negative test cases still show losses in back-testing. I have attempted including many conditions to eliminate or reduce the loss. But, further efforts has resulted in reduction in profits in positive cases as well. Still experimenting. Will update whenever I find improvements. Comments and suggestions welcome :)

Breakout Trend Trading Strategy - V1Strategy in nutshell:
This strategy is made to be used in daily time-frames. Works better on trending instruments where volume is available. Hence, this is more suitable for trending shares rather than currencies, commodities and indexes where volume data is either not present or not reliable.
Breakout signifies the continuation of trend. Hence, trade in the direction of breakouts. Breakouts are calculated based on high volume and price movement in a day. This will be combined with few other conditions to generate buy and sell signals along with stop and compound targets. Supertrend is used for trend bias. Our buy and sell targets do not directly depend on the bias. But, entry criteria in opposite trend is made much difficult than that of trend direction. Further explanation of method and input parameters are explained below.
Backtesting parameters :
Capital and position sizing : Capital and position sizing parameters are set to test investing 2000 wholly on certain stock without compounding.
Initial Capital : 2000
Order Size : 100% of equity
Pyramiding : 1
ExitOnSignal : If unchecked exit is triggered solely on trailing stop
Trade Direction : Long, Short or All. Short condition is riskier than long conditions and often results in losses as per my observation. On most of the stocks trending up, strategy will not generate any short signals. This is achieved by comparing yearly high lows to previous two years to decide whether to allow short or long entries.
allowImmediateCompound : Applicable only if compounding/pyramiding is enabled in trade. If checked allows to place compounding orders immediately. If unchecked, it waits for stopline to cross order price before placing next compound.
Display Mode :
Targets : Whenever breakout happens, show marker for upTarget and downTarget
TargetChannel : Show up target and downtarget as a channel
Target With Stop : Along with targets, show also stop levels for breakouts
Up Channel : Channel created from UpTarget and respective stops
Down Channel : Channel created from DownTarget and respective stops
ShowTrailingStop : Shows trailing stop and compound lines when there is a trading position.
ShowTargetLevels : Shows Buy Sell target levels along with stop and compound lines. Trades are done as market orders. Hence, target levels are displayed after strategy makes the trade. Since only one order allowed per side without compounding, target, stop and compound levels are shown sometimes even without trade being made. These can be considered as entry levels if there is no existing position.
ShowPreviousLevels : Shows previous buy/sell target levels. When enabled, layout can look messy.
StopMultiplyer: To Set trailing stop loss.
BacktestYears: Number of years to include in backtest
So far my test cases are:
Positive : AAPL, AMZN, TSLA, RUN, VRT, ASX:APT
Negative Test Cases: WPL, WHC, NHC, WOW, COL, NAB (All ASX stocks)
Special test case: WDI
Negative test cases still show losses in backtesting. I have attempted including many conditions to eliminate or reduce the loss. But, further efforts has resulted in reduction in profits in positive cases as well. Still experimenting. Will update whenever I find improvements. Comments and suggestions welcome :)

Market ProfileHello All,
This is Market Profile script. "Market Profile is an intra-day charting technique (price vertical, time/activity horizontal) devised by J. Peter Steidlmayer. Steidlmayer was seeking a way to determine and to evaluate market value as it developed in the day time frame. The concept was to display price on a vertical axis against time on the horizontal, and the ensuing graphic generally is a bell shape--fatter at the middle prices, with activity trailing off and volume diminished at the extreme higher and lower prices." You better search it on the net for more information, you can find a lot of articles and books about the Market Profile.
You have option to see Value Area, All Channels or only POC line, you can set the colors as you wish.
Also you can choose the Higher Time Frame from the list or the script can choose the HTF for you automatically.
Enjoy!

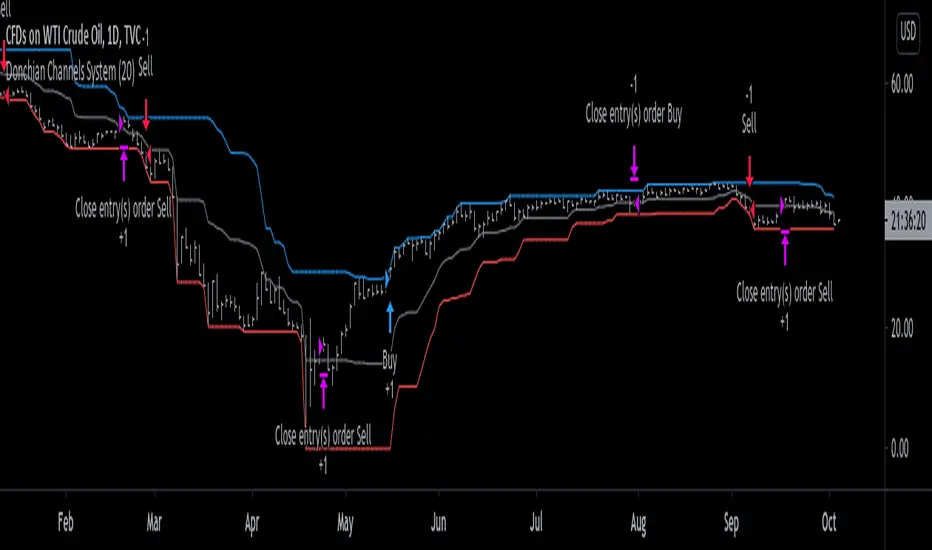
Donchian Channels System [racer8]Donchian Channels was developed by Richard Donchian in 1949. They have been used with great success by the Turtles, a group of traders in the 1980s who managed to obtain returns of 80% annually. Truly incredible story.
This particular indicator is a trend trading system I coded that shows you when to enter long or short and when to exit those longs or shorts.
In addition, this indicator shows the past performance results that are incredibly valuable information for backtesting this system.
The high, mid, and low lines have been plotted to show how this system works. The blue line is the high line. The gray line is the mid line. The red line is the low line.
Entry signals are generated when the current close closes above the highest price for a long trade or below the lowest price for a short trade over n periods.
Exit signals are generated when the current close crosses the mid-line (aka. baseline) and closes.
Baseline = (highest price + lowest price)/2
I encourage you to play around with the settings, although I reccomend avoiding any period below 14.
This system is no bullshit, it's the real deal.
Good luck traders, and enjoy ;)
Multi Time Frame CandlesHello Traders,
This script can show (upto) 3 candles of another time frames without changing chart time frame realtime . You can choose the time frame and number of candles in the options. You have option to change body and wick colors as well.
in this example number of candles is 2:
You can set body and wick colors:
In this example, weekly candles are shown on 1h chart:
Enjoy!

GODXBT 2.0 GODXBT 2.0
This script helps you to understand the market situation
Script includes :
. Support & resistance tool
. Smoothing filter to reduce noise on the signals
. Take Profits points
. 222 EMA (Works as Support and resistance , customizable you can change the length as per your requirement )
customizable switches to turn on/off
* S/R Switch (Support/Resistance)
* Smoothing filter Switch (to reduce noise)
* TP points (take profits piont)
how to trade :
Buy/Long when " BUY " signal appears
Sell/Short when " SELL " signal appears
take profits on " TP+ " for shorts and " TP- " for longs
for stop loss use support and resistance lines ( mentioned in chart )
small cross above/below the candle shows Support/Resistance getting built
Signal confirmation on candle Close
and Bar colors for trend strength
Red bearish , white for sell exhaustion
Blue bullish , white for buyers exhaustion
Script includes Alerts for BUY and SELL signals as well as TP+ and TP- signals
*** all the details I have mentioned on chart please check the chart ***
DM FOR ACCESS

XBrat AlgoXbrat Algo
Think of an Experienced Traders’ Brain as a blueprint for a trading algorithm. Then the desire to keep charts as clutter free as possible. What you get is a blueprint of Paul Bratby’s thought process but even he admits, he is getting too old to focus on all of these at once!
By aligning various ‘Decision Points’ from multiple indicators such as a configuration of EMA’s, EMA Clouds, Stochastics, MACDs as well as a number of other indicators. Add this to experienced decision making, we have the basis of our Algo.
It’s not just indicators, it’s how they are combined and the settings of each individual indicator, which are not default, that makes up 12 Decision points for grading a trade.
• Minimum of 10 Decision Points before Paul considers grading the trade a 3* trade
• Then another special Decision Point will make it a 4* trade
• Another for 5* trade
• And Finally, a total of 12 Decision Points being correct before he grades a trade 6* trade

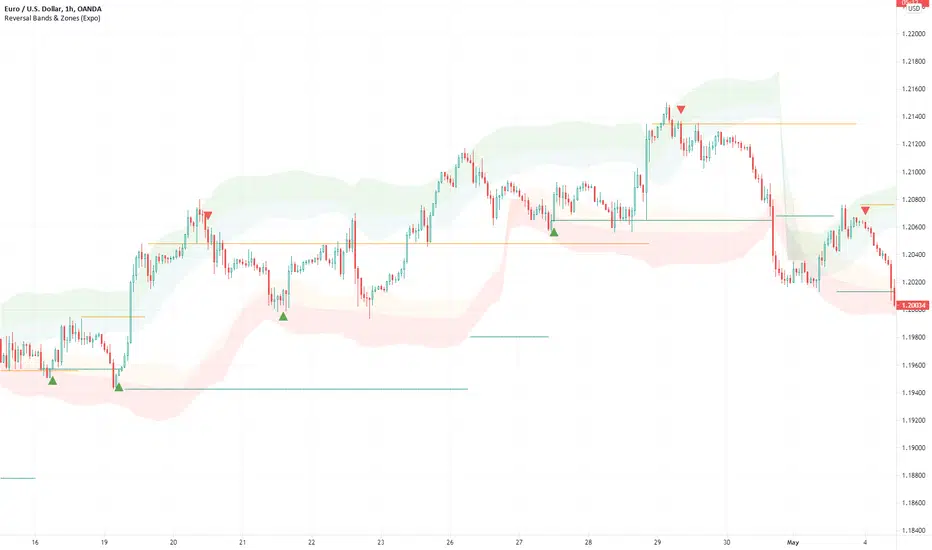
Reversal Bands & Zones (Expo) "It has never been easier to find high probability trades"
Reversal Bands & Zones (Expo) is an algorithm that analyzes the market in real-time and identifies reversal points, key market zones, and trends. The advanced and unique reversal bands act as support & resistance zones, and together with the trend tracking feature, it serves as a trend confirmation. The real-time market zones are displayed where there is a high probability of finding support/resistance. The algorithm does also map out key pivot levels based on the current market structure.
> Reversal points and key market zones have alerts.
Real-time
No repainting
Works on any market and in any timeframe
The indicator can be used standalone or as a part of your current trading strategy.
☖ Reversals
The algorithm identifies areas of potential turning points, these are displayed as Upper and Lower Reversal Cloud. When the price hits the cloud and bounces off there is a high probability that the price will reverse. If the price stays in the reversal cloud, there is a high probability that a trend is forming.
☖ Trends
Positive Trend: If the price is in or close to the upper green reversal band and above the trend- tracking line, we can be sure that the market is in a positive trend until the price crosses down from the reversal cloud and the trend tracking line.
NegativeTrend: If the price is in or close to the lower red reversal band and below the trend- tracking line, we can be sure that the market is in a negative trend until the price crosses up from the reversal cloud and the trend tracking line.
☖ Zones
"It hasn't been easier to display, in real-time, one of the most important and useful technical analysis, namely key support and resistance zones"
The algorithm analyzes the market structure in real-time and maps out key supply/resistance and demand/support zones. The user gets an instant understanding of the market structure. Support and resistance can be used to determine the range of a market, to trade reversals, bounces, or breakouts.
☖ Pivots
The indicator does also displays key pivot levels. Pivots can be used to determine the range of a market, to trade reversals, bounces, or breakouts.
HOW TO USE
- Use the indicator to identify reversals.
- Use the indicator to identify the range of the market.
- Use the indicator to identify key support/resistance zones.
- Use the indicator to identify trends.
INDICATOR IN ACTION
1-hour chart
I hope you find this indicator useful , and please comment or contact me if you like the script or have any questions/suggestions for future improvements. Thanks!
I will continually work on this indicator, so please share your experience and feedback as it will enable me to make even better improvements. Thanks to everyone that has already contacted me regarding my scripts. Your feedback is valuable for future developments!
-----------------
Disclaimer
Copyright by Zeiierman.
The information contained in my scripts/indicators/ideas does not constitute financial advice or a solicitation to buy or sell any securities of any type. I will not accept liability for any loss or damage, including without limitation any loss of profit, which may arise directly or indirectly from the use of or reliance on such information.
All investments involve risk, and the past performance of a security, industry, sector, market, financial product, trading strategy, or individual’s trading does not guarantee future results or returns. Investors are fully responsible for any investment decisions they make. Such decisions should be based solely on an evaluation of their financial circumstances, investment objectives, risk tolerance, and liquidity needs.
My scripts/indicators/ideas are only for educational purposes!
ACCESS THE INDICATOR
• Contact me on TradingView or use the links below
Support Resistance - Aging [Example]Hello All,
First all of Thanks to Pine Team for adding Arrays to Pine!
In this script I tried to make example for
1. Finding S/R lines using highest/lowest function
2. Using 1D array as 2D (we keep S/R levels and age)
3. "Age" usage for S/R levels, getting older on each candle and changing colors by their age (maximum age is 127 then it disappears)
You can use "Close"/Open " or " High/Low " as source.
There is an option for the background color, by default it's Black, do not forget to set it accordingly :)
Enjoy!

Ehlers 2 Pole Super Smoother Filter V2 [CC]The 2 Pole Super Smoother Filter was created by John Ehlers (Cycle Analytics For Traders pg 32) and this follows the price very closely and very useful because it is consistent with uptrends and falls sharply during a sudden downtrend so it should be able to help you stay more profitable. Buy when the indicator line turns green and sell when it turns red.
Let me know if there are other indicators you would like to see me publish or if you want something custom done!

Cumulative Delta VolumeHello Traders,
This is Cumulative Delta Volume script. Delta refers to the difference between buying and selling volume at each price level. Cumulative Delta builds upon this concept by recording a cumulative tally of these differences in buying vs selling volume. The Cumulative Delta indicator plots as candlesticks or line. One of the main uses of Cumulative Delta is to confirm or deny market trends. you may need to search it for yourself ;)
You have option to see it as Candles or a Line. also there are options to show 2 SMAs and 2 EMAs with different Lengths, you can set the lengths as you wish.
By default it shows CDV as Heikin Ashi Candles, it can also show it as normal candles:
It can show CDV as a line:
Also you may need to check divergence:
Enjoy!

Rolling ATR Channel (Expo)Rolling ATR Channel (Expo) is a sophisticated indicator that identifies the underlying trend as well as identifies ATR based trading ranges. In a trending market, the price will be within the Upper or Lower band. If the market is in a trading range , the price will bounce between the upper and lower ATR zones, until the price breaks through and creates a new trend. The user will no longer have to guess in which state the market is in, the indicator displays it clearly.
So, the indicator displays real-time Range (ATR based) support and resistance zones as well as if the market is in a trend.
If you know the current market state, you have the ability to choose the most applicable market strategy.
Real-time
No repainting
Works on any market and in any timeframe
HOW TO USE
- Use the indicator to identify trading range support and resistance zones.
- Use the indicator to identify when the price breaks through the trading range.
- Use the indicator to identify if the market is in a trend.
INDICATOR IN ACTION
4 Hour chart
I hope you find this indicator useful , and please comment or contact me if you like the script or have any questions/suggestions for future improvements. Thanks!
I will continually work on this indicator, so please share your experience and feedback as it will enable me to make even better improvements. Thanks to everyone that has already contacted me regarding my scripts. Your feedback is valuable for future developments!
-----------------
Disclaimer
Copyright by Zeiierman.
The information contained in my scripts/indicators/ideas does not constitute financial advice or a solicitation to buy or sell any securities of any type. I will not accept liability for any loss or damage, including without limitation any loss of profit, which may arise directly or indirectly from the use of or reliance on such information.
All investments involve risk, and the past performance of a security, industry, sector, market, financial product, trading strategy, or individual’s trading does not guarantee future results or returns. Investors are fully responsible for any investment decisions they make. Such decisions should be based solely on an evaluation of their financial circumstances, investment objectives, risk tolerance, and liquidity needs.
My scripts/indicators/ideas are only for educational purposes!
-----------------
ACCESS THE INDICATOR
• Contact me on TradingView or use the links below

Support Resistance - Dynamic v2Hello Traders!
After the addition of "Arrays" to the Pine, I developed new and improved version of Support Resistance - Dynamic script as version 2. In this script Arrays were used. This can be used as Support Resistance tool, also it will be an example for the people who want to learn Array usage in Pine. Many thanks to Pine Team for adding Arrays!
The script finds the Pivot Points and check them in channels if there can be S/R or not, and draws mid line of the channel as S/R line. you can set number of PPs and channel width in the options. Each channel width is optimized dynamically according to Pivot Points. Also you can choose " High/Low " or " Close/Open " as source for Pivot Points.
There is an option for maximum number of S/R levels. S/R levels are found and sorted dynamically and number of S/R lines with enough strength changes dynamically.
Some other options for coloring and line width. (Solid, Dashed or Dotted)
S/R levels are shown in the Labels and Label colors are changed automatically, if S/R line is below the closing price then it's color is Green (as Support), otherwise its color is Red (as Resistance).
Examples:
Enjoy!

TBS - Trend Buy and Sell IndicatorTrend Buy and Sell Indicator
TBS identifies trend based on price cross-over/cross-under to a moving average. Confirmed Up-trend is displayed in green and Down-trend in red backgrounds. Before a trend is confirmed price cross-over is displayed in blue and cross-under in orange backgrounds. Once an uptrend is confirmed, TBS suggest buys based on touch downs to a Support moving average by a green arrow under the candle . A sell is suggested by TBS by a red arrow on top of the candle when the price reaches a certain percentage above support moving average. Motivation and Tolerance levels are provided to fine tune buying and selling signals.
Example : Default settings for BTC Weekly charts are Trend Moving Average = 50, Support Moving Average = 21, Motivation Buy = 10, Tolerance Buy = 5, Motivation Sell = 50 and Tolerance Sell = 90. That means in uptrend identified by green background every time the closing price touches 10% higher than 21 week moving average value TBS suggests buy, so a trader can choose to buy 80% of intended position at this level. If the price continues to drop down and touches 5% below 21 week moving average, a trader may choose to buy another 20% at this level. In the likely scenarios of price hike from here a trader may choose to sell 80% at the Motivation Sell level 50% higher than 21 week moving average. If the price reaches Tolerance Sell level at 90% higher than 21 week moving average a trader may choose to sell remaining 20% of the position.
Note 1 : TBS suggest Buys and sells but the execution of buy and sell is up to trader's discretion for example using Stop Buy order or Limit Buy order etc.
Note 2 : TBS is designed to be a medium to long term indicator for example weekly and monthly timescales. Traders might find it useful on shorter term time-frames but its not designed for short term time frame in mind.
Note 3 : Most of the parameters in TBS indicator are configurable as Trend Moving Average and Support Moving Average vary significantly across assets. Default parameters are set for Bitcoin Weekly time frame. Traders should play around with parameters to find best fit for Trend Moving Average and Support Moving Average for the asset of interest. For example TBS is very relevant and useful for Gold Weekly time frame with Trend Moving Average = 100, Support Moving Average = 30, Motivation Buy = 1, Tolerance Buy = 0, Motivation Sell = 11 and Tolerance Sell = 20.

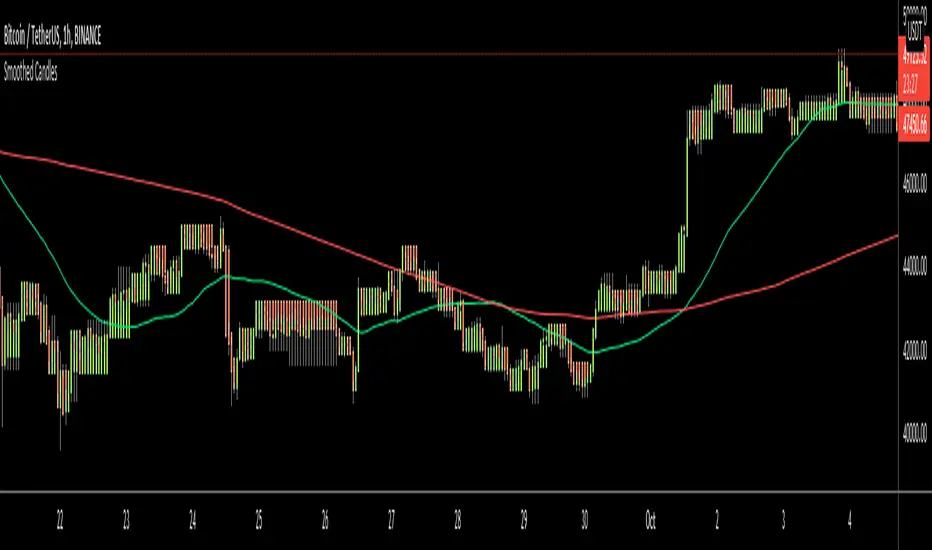
Smoothed CandlesHello Traders,
This is " Smoothed Candles " script to get rid of noises and to get a smoothed chart to figure out breakouts and price movements easily.
There are three scaling methods: User Defined, Dynamic (ATR) and Percentage
Optionally you can add 2 Simple Moving Averages and 2 Exponential Moving Averages
Optionally you can hide the Wicks, example:
You can add moving averages:
Easily find breakouts:
Enjoy!
Higher Timeframe Trend Indicator V3.0What is it?
An indicator that depicts the trend of up to 5 higher timeframes on the same chart without needing to context-switch between charts.
Features
- Supports up to 5 timeframes
- Trends indicated by 5 colored buttons: one for each timeframe
- Varying shades of green: uptrend
- Varying shades of red: downtrend
- White/silver: sideways/neutral
- Configurable length (time period) for each timeframe
- Increase length to capture long term trends; decrease it to capture only short term ones
- Configurable sensitivity for each timeframe
- Sensitivity determines what angle is considered trending and what is not
- Increase sensitivity to capture weak trends
- Decrease sensitivity to filter out weak trends and capture only strong/steep ones
- Sensitivity ranges from 1 (least sensitive) to 3 (most sensitive)
- Move the labels around vertically for better visibility by changing the "Location" and "Offset" parameters
How should one use it?
Use it to quickly browse through charts to understand the context across timeframes, and zero in on only those that have trends aligning on the higher and lower timeframes as per your strategy. For e.g., a chart that is trending up strongly on the 15min and 60min (indicated by dark green colored buttons), and trending down on the 1 and/or 5 min (indicated by red-colored buttons), can be shortlisted for a potential pullback trade. Use your favorite pullback strategy (Supply/Demand, Support/Resistance, Moving Averages, etc.) to hop in on the trend.
How are trends determined?
The indicator uses normalized %change in price of the linear regression line segment of the chosen price sources (close, high, low, MA, etc.) over a specified length to determine trend direction and intensity
Known Issues
Will indicate the trend correctly only for timeframes *higher* than the current (visible) resolution/timeframe of the chart. Might not indicate it correctly for lower timeframes ( i.e., lower than the current (visible) resolution/timeframe of the chart). For this reason, all timeframes lower than the current resolution will be hidden in the present release.
Future releases
- I am still experimenting with various sensitivity levels and the corresponding trend shades to make the tool as accurate and intuitive as possible. These modifications might come in
- Sensitivity levels might be increased.
- Bug fixes, if any

Trend Following with Moving AveragesHello Traders,
With the info "Trend is Your Friend ", you should not take position against the trend. This script checks multipte moving averages if they are above/below the closing price and try to find trend. The moving averages with the length 8, 13, 21, 34, 55, 89, 144, 233, 377 used. these are fibonacci numbers, but optionally you can change the lengths of each moving averages. while it's green you better take long positions, while it's red you better take short positions according to other indcators or tools.
Optionally you have "smoothing" option to get rid of whipsaws. it's enabled by default.
You have option to use following moving average types: EMA, SMA, RMA, WMA, VWMA. by default it's EMA
Also the script has "Resolution" option. with this option you can get the trend for other time frames, in following example 1h was set as for higher time frame on 15m chart:
This should not be used as buy/sell signal indicators as it's tries to find trend but not entry points, you should use other indicators (such RSI, Momentum) or other tools to find buy/sell signals.
Enjoy!

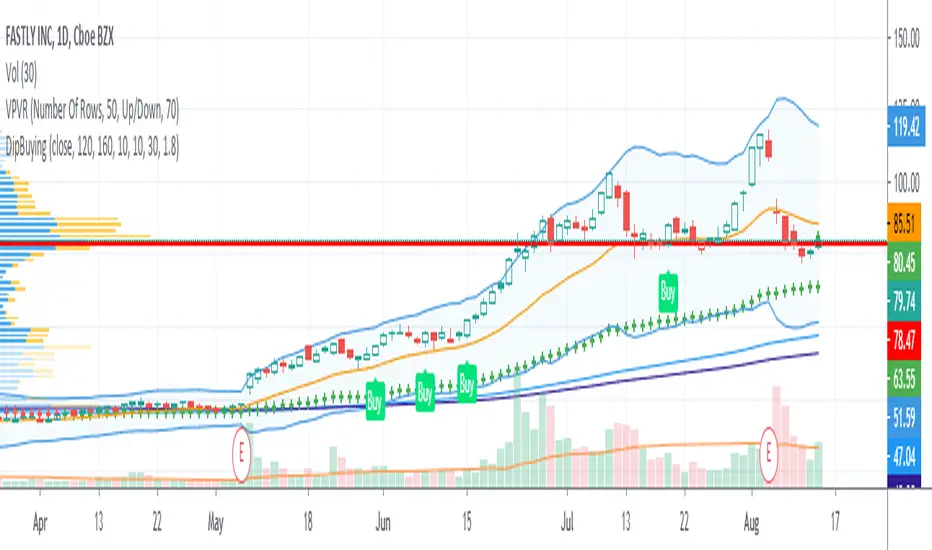
Nerd Dip Buying for StocksThis script is intended to generate BUY signals during pullbacks in stocks which are in the midst of mid to long-term uptrends. The ideal timeframe is Daily.
Signals should be acted upon at or near the close, or at open next bar.
I use 2 simple moving averages (SMA1 and SMA2) to determine whether the stock is currently in an uptrend. The default parameters are:
SMA1 = 120
SMA2 = 160
Buy signals are only produced when SMA1 is above SMA2.
As an additional filter I also use the Adaptive Moving Average (AMA) developed by Perry Kaufman. The settings are (10, 10, 30). Buy signals are allowed only when the bar closes above the AMA.
Lastly, the Buy signal itself is computed utilizing the Greatest Swing Value, a concept pioneered by Larry Williams in his book Long-Term Secrets To Short-Term Trading . You can control how often BUY signals appear by tweaking the parameter GSV Buy Factor . The smaller the number, the more often BUY signals appear. By default,
GSV Buy Factor = 1.8
This indicator has been developed with stocks trading in mind only, in particular US stocks. Feel free to apply it to other markets or asset classes and let me know the results. Thank you very much.
TREND +SIDEWAYS OPTIMIZED algo signalsThis indicator will try to capture maximum trend of a stock
it will keep trailing stoploss to capture maximum trend
Works best in trendy markets
FEATURES:
Done and backtested on indian stocks.
Trade session and exit session can be specified as inputs.
Optional Stoploss
Specially developed for intraday trading
It would be good to use on normal candlesticks and time frame between (3 to 15 min)
INPUTS:
TRADE FREQUENCY: it can be an integer from from 1 to 5 , Frequency denotes the trading frequency,
low frequency will take less number of trades and will have HIGHER risk rewads (to use lowest frequency 1 )
High freqency it will take more trades and with less profits good for scalpers , it will have low risk and low reward)
Frequency requirement can be given between 1 to 5 , 1 is the lowest and 5 is the Highest frequency
Sideways Bias:
This is an extra filter to reduce the loss in sideways movement,
Your sideways bias can be given between 0 to 3
0 if No bias on sideways
3 if biased on sideways
Reduce the risk filter:
This would try to bok profit quickly and begginers can use this
Optional stoploss:
you can define your risk in points
Trade Quantity:This is quantity you want to trade on particular day, it is used to plot buy or sell quantity on chart (quantity is not taken into consideration in backtest)
Trade session: Session for entries can be specified
Exit session: session for exit can be specified
Custom Bactesting:
This is to provide backtesting results of a stock in given range of dates

Buying/Selling Pressure & Trend Strength/Direction (Zeiierman)█ Overview
Buying/Selling Pressure & Trend Strength/Direction (Zeiierman) transforms price behavior into a continuous, evolving map of bullish and bearish pressure. The system breaks every candle into internal buying pressure, selling pressure, net dominance, and the broader structural trend environment. These elements combine into a unified visual structure that reveals how actively each side participates and how organized or fragmented the underlying trend has become.
Long/Short Covered visualization adds an additional layer of insight by highlighting moments when traders unwind positions, often exposing squeeze conditions, exhaustion zones, or developing turning points before they appear in price alone.
⚪ Why This One Is Unique
This system stands out because it reconstructs market pressure from multiple directional components rather than relying on a single trend or momentum source. Instead of treating bullish and bearish movement as a simple up/down outcome, it forms a dual-sided pressure environment that adapts to how each side is behaving relative to its own historical structure. This produces a fluid, context-aware representation of participation that moves with the market instead of fighting it.
The anomaly-based Long/Short Covered component adds another layer of uniqueness. Rather than flagging spikes mechanically, it evaluates how current pressure behavior deviates from expected balance and highlights when traders are being forced out of positions. This produces a highly intuitive map of squeeze events, capitulation, and exhaustion dynamics.
█ Main Features
⚪ Buying/Selling Pressure Candles
Visualize the balance between bullish and bearish pressure as oscillator-style candles. Traders use these to quickly see whether current bars are dominated by buying or selling aggression and how strong that pressure is relative to recent history.
Fast Trend: A highly responsive trend layer that reflects short-term pressure shifts. Use it as the earliest indication of changing momentum and as a guide for deciding whether to participate in the developing pressure move or wait for stronger confirmation.
Core Trend: The underlying long-term pressure trend that reveals the broader market direction. Values above zero indicate a bullish regime, while values below zero indicate a bearish regime. Use the Core Trend to align your trades in the same direction as the dominant market trend.
Strong Trend: Strong Trend highlights periods of unusually intense and extended trend movement. These moves can continue for a while, but they often signal that the trend is becoming stretched. Extended Strong Trend conditions can precede exhaustion, deeper pullbacks, or even full reversals, so traders should remain cautious when these appear.
Established Trend: Identifies areas where market pressure has matured into a well-developed directional trend. Use this as a high-confidence confirmation layer. If the Established Trend begins to fade or stop printing while the price weakens, it can be an early sign that a pullback or reversal is approaching.
⚪ Long/Short Covered
Highlights candles where the pressure structure suggests aggressive unwinding of existing positions (longs or shorts). These zones often align with sharp spikes, squeezes, or capitulation and can be used to time reversals, profit-taking, or fade extreme moves.
⚪ Pressure Changes
Pressure Cross
Pressure Cross events show clear shifts where one side’s pressure overtakes the other. They signal that the balance of force is changing, but they still require confirmation from the Fast or Established Trend before being used as entry triggers or position add-ons.
Pre Signals
Pre Signals appear even earlier and highlight the first hints of pressure building in the opposite direction. They act as early heads-up alerts that may reflect short-term fluctuations, so traders should wait for additional confirmation before treating them as meaningful trend movement.
█ How to Use
⚪ Breakout/Momentum Trading (Buying and Selling Pressure)
Buying and selling pressure is displayed directly through the pressure candlesticks. The stronger the coloring, the stronger the force behind the move. This makes it easy to see which side is in control and whether the market is building enough pressure for a breakout or continuation. Traders can use this to gauge the strength of a move and align their entries with the dominant side of the market.
Breakout Trading
When strong green pressure candles appear as the price approaches resistance, it shows that buyers are actively pushing the breakout. Likewise, strong red pressure candles during a breakdown indicate decisive selling pressure. These surges help confirm whether a breakout has real strength behind it and reduce the chances of entering weak or false moves.
Bullish Breakout
Bearish Breakout
Momentum Trading
The deeper the candle coloration, the stronger the underlying momentum. Intense green candles reflect an accelerating bullish drive, while intense red candles reflect an accelerating bearish drive. Traders can use these moments to enter in the direction of momentum, focusing on strong moves that are more likely to continue.
Note: To capture longer and more sustained momentum moves, increase the candle length above 30.
⚪ Trend Trading
The indicator provides several components to evaluate trend direction and trend maturity. The pressure candlesticks and the Core Trend form the foundation of trend detection, while the Established Trend and Strong Trend features help confirm when a trend has developed into a mature, sustained phase. These layers together help identify trends with a higher likelihood of continuation or potential exhaustion when the move becomes extended.
Note: To capture longer and more sustained trend moves, increase the candle length above 30. You can also raise the Smoothed value into the 10–30 range for additional stability.
Candlesticks or Fast Trend
The pressure candlesticks and the Fast Trend can both be used to read trend direction. When green candles dominate and extend above the +200 region, and the Fast Trend is rising while red candles stay above the −200 region, the market is operating in a bullish environment. When red candles dominate below the −200 region, and the Fast Trend is falling while green candles stay below the +200 region, the environment is bearish. Stronger candle coloration and a firmly aligned Fast Trend both signal stronger trend behavior.
Core Trend
The Core Trend complements the candlesticks by offering a clear background bias. Green histogram bars indicate bullish conditions, while red histogram bars indicate bearish conditions. Traders can use the Core Trend to validate whether the pressure structure aligns with the broader directional bias.
⚪ Pressure Changes
Pressure Changes highlight moments where buying and selling pressure begin shifting from one side to the other. These movements often appear before trend transitions, but they are not trend reversals by default. Instead, they reveal temporary or emerging changes in pressure that may or may not develop into a lasting move. Traders should treat these signals as early information that needs further confirmation.
Pressure Cross events mark clear shifts where one side’s pressure overtakes the other. These events show that the balance of force is changing, but they do not guarantee a sustained trend reversal. Traders should confirm the shift by checking alignment with the Fast Trend, Core Trend, or Established Trend before acting on the signal.
Pre Signals appear even earlier than Pressure Cross events and highlight the first hints of pressure building in the opposite direction. These signals offer early awareness but can represent short-term fluctuations rather than meaningful shifts. Traders should use them as heads-up alerts and rely on additional confirmation tools to determine whether the pressure change will evolve into a genuine trend movement.
⚪ Reversal/Pullback Trading (Long/Short Covered)
Long traders eventually need to sell, and short traders eventually need to buy back. These actions can create meaningful pressure spikes that often appear near reversal zones or trend pullback areas.
Long Covered events tend to occur when long positions are being unwound, often marking potential reversal points or areas where price may find support within an existing uptrend. This can provide early clues that the current move is losing steam or preparing to reset.
Short Covered events tend to occur when short positions are being closed, often appearing near resistance zones or within strong downtrends where the market temporarily retraces. These signals can act as early warnings of pullbacks or exhaustion within broader bearish flows.
⚪ Overbought/Oversold
When the pressure candles reach the upper or lower limits, the market may be entering an extended condition. These zones often precede pauses, pullbacks, or full reversals, depending on the broader context. Traders can treat these boundaries as early caution areas where strong moves may temporarily lose strength.
⚪ Divergence Trading
The pressure candles naturally highlight divergences. When price makes a new high or low but the pressure candles fail to confirm with equally strong activity, it suggests that buying or selling pressure is fading. These divergence patterns can help traders identify potential reversal points or weakening momentum in ongoing trends.
█ How It Works
⚪ Buying/Selling Pressure
The indicator reframes each bar through a two-channel transformation that separately models bullish and bearish pressure. Instead of interpreting movement as a single directional value, the system generates a pair of opposing pressure streams that evolve against each other. This creates a dynamic field where dominance, imbalance, acceleration, and exhaustion can be observed simultaneously.
Calculation: Constructs a bi-directional pressure surface using normalized displacement relationships, volatility-adjusted scaling, and directional competition modeling.
⚪ Adaptive Strength Normalization
To avoid flat readings, each side’s pressure is evaluated relative to its own historical envelope, producing a normalized strength scale. This allows the model to interpret current motion in the context of what has recently been “strong” or “weak,” rather than relying on static reference levels.
Calculation: Applies rolling extremum mapping and nonlinear rescaling, converting raw directional activity into a bounded strength metric that reflects real-time contextual significance.
⚪ Geometric Trend Core Engine
Trend state is derived by combining directional pressure into a geometrically structured core. This core reacts not only to direction but to symmetry, dispersion, and slope of the pressure environment. When the core flattens while pressure expands, the system recognizes structural organization, flagging strong trends.
Calculation: Uses geometric mean transformations and smoothed envelope interactions to build a stable trend backbone that identifies when movement transitions from noise into coordinated directional behavior.
⚪ Long/Short Covered Anomaly
Long/Short Covered events emerge from a comparison of expected vs. actual pressure symmetry. When bullish and bearish gradients diverge beyond a context-defined limit, the system interprets it as forced unwinding or aggressive covering. These anomalies often signal structural stress, squeezes, or capitulation.
Calculation: Implements a bidirectional gradient comparison model, where deviation from the neutral equilibrium curve produces a significance score. If this score exceeds its adaptive threshold, an anomaly event is triggered.
-----------------
Disclaimer
The content provided in my scripts, indicators, ideas, algorithms, and systems is for educational and informational purposes only. It does not constitute financial advice, investment recommendations, or a solicitation to buy or sell any financial instruments. I will not accept liability for any loss or damage, including without limitation any loss of profit, which may arise directly or indirectly from the use of or reliance on such information.
All investments involve risk, and the past performance of a security, industry, sector, market, financial product, trading strategy, backtest, or individual's trading does not guarantee future results or returns. Investors are fully responsible for any investment decisions they make. Such decisions should be based solely on an evaluation of their financial circumstances, investment objectives, risk tolerance, and liquidity needs.
Tập lệnh trả phí

Trend Lines ProHello Traders!
We need to make things better & better to solve the puzzle and I try to do my best on this way. now I am here with my new Trend Lines Pro script.
As you know, Trend Lines is very subjective and many people (even professionals) draw different Trend Lines on the same chart. This is confusing and there must be an automation to make the life easer. with this tool I tried to automate it.
The idea in this script is different from my previous trend lines scripts. In this, I use channel idea so it can check number of pivot points it contains, it checks H/L/C in the channels as well. it also checks the angle while choosing trend lines. then we get stronger and useful Trend Lines automatically.
There are some option in the script, let see one by one:
Pivot Period: The Length to calculate Pivot Highs/Lows
Source : Option to use "High/Low" or "Close" as the source for Pivot Points
Threshold Rate : This rate is used for channel width. it you give bigger numbers then you get bigger channels. it's 4 by default
Minimum Angle Rate for new Trendline: if there are different trend lines, there must be an angle between them to choose best trend lines. you can set the angle with this option.
Minimum Strength: there can be many trend lines but we need to choose/use stronger ones. with this option you can set the number of pivot points a trend channel have to contains.
Maximum Loopback Length: by default the script can check 40 pivot highs and 40 pivot lows but to make the script faster and useful I needed to add a limitation for the number of bars that the script can go back.
Show Trendlines as: you can see trend lines as "Trendline", "Channel", "Trend Channel". you can see examples below.
Enable Weak Trend Lines: if there is no trend lines strong enough (as defined in "Minimum Strength" option) you have option to see a weak trend line. that is useful sometimes. if you enable this option weak lines are shown as dotted lines.
Show Price Labels on Trendlines: the script can show the price levels to break trend lines. the examples are below
Line Style: trend lines can be Solid or Dashed as you wish
Color theme: colors of the Up/Down Trend lines can be set. 'Red', Lime, Blue, White, Black, Olive, Gray
you can see the Trend Lines as channels:
you can see Trend Channels to see the big picture.also there is dotted trend line as weak trend line defined above.
you can set color/width of trend lines as you wish.
the script is fast enough to run on 1sec chart:
you can use this script on any chart, fx pairs, stocks, indices etc
I made a short video to explain how to use it and some options:
Please PM for access.
Enjoy!
DISCLAIMER: No sharing, copying, reselling, modifying, or any other forms of use are authorized for our documents, script / strategy, and the information published with them. This informational planning script / strategy is strictly for individual use and educational purposes only. This is not financial or investment advice. Investments are always made at your own risk and are based on your personal judgement. I am not responsible for any losses you may incur. Please invest wisely.
Tập lệnh trả phí
