Colored EMAThis is a modified version of the exponential moving average indicator to change color based on trend (red/bearish if price has closed below EMA, green/bullish if price has closed above EMA).Chỉ báo Pine Script®của ZenAndTheArtOfTradingCập nhật 66 1.6 K
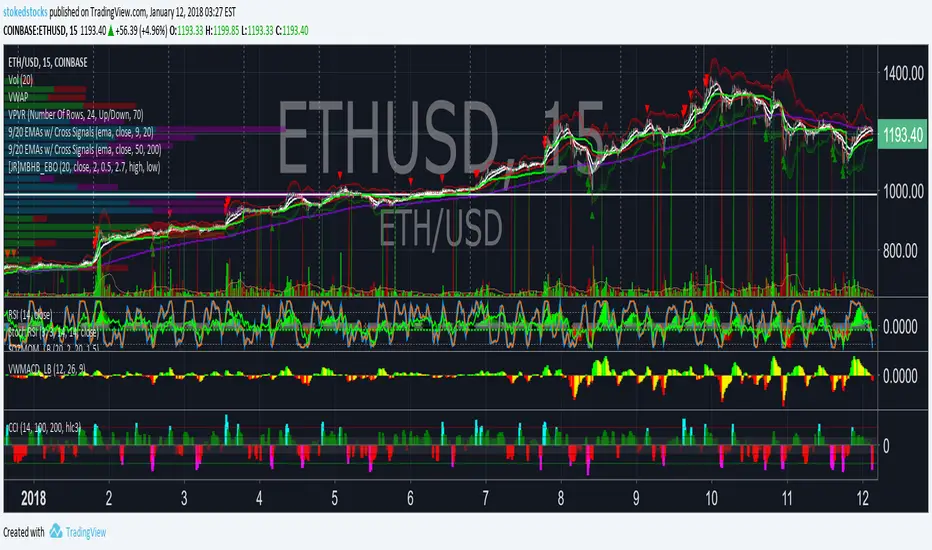
Volume Strength Candles / Colored BarsIs Price Action Higher or Lower on STRONG or WEAK VOLUME from lookback (Strong or Weak Bulls // Strong or Weak Bears) Candles / Bars Indicate the Following (default 13 period lookback / Length) MAROON Bear Candle with STRONG VOLUME more than 150% of the lookback / length (13 default), STRONG Bear Candle Confirmed With Volume RED Bear Candle while VOLUME is BETWEEN 50% & 150% of the Lookback / Length (13 default), Neutral Bear Volume Neither strong or weak ORANGE Bear Candle with WEAK VOLUME (Less than 50% of the Length / Lookback) DARK GREEN Bull Candle with STRONG VOLUME MORE than 150% of lookback GREEN Bull Candle with Neutral VOLUME BETWEEN 50% & 150% of the lookback / Length AQUA Bull Candle with WEAK VOLUME less than 50% of the Lookback Is price confirmed by volume? Can Change the Lookback / Length from 13 Can Change the Colors and Transparency to easily see based off your chart background colors I recommend ZERO Transparency to easily identify volume strength (i use white background but many use black or other) Chỉ báo Pine Script®của stokedstocks44583
Color Volume Bars V 0.1Preliminary version. Color Volume Bars will indicate the volume % related to the historical average by painting the bars on the graph. Nice to identify when a large amount of deals are closed at a certain price level.Chỉ báo Pine Script®của guirf001155
Color Volume Bars V 0.1 - Paints bars accrding to its volume.Preliminary version of volume % compared exclusively to series (volume) average painted on each bar, according to adjustable parameters. Chỉ báo Pine Script®của guirf007796
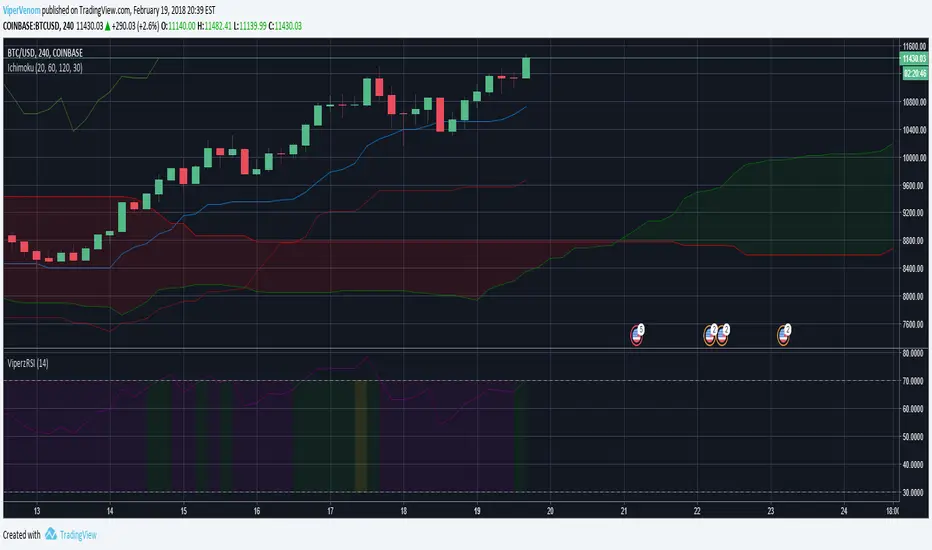
Viperz RSI v1.2The color of the RSI inner bands will change from Purple to Green if RSI >70 and they will change to yellow if RSI >75. Nothing else has been changed from the standard RSI. Please understand I'm testing how publishing indicators works in Trading View. I have only done a minor adjustment to the RSI indicator, but I plan to do much more once I fully understand the publishing process. Thank you. Hope you enjoy. :)Chỉ báo Pine Script®của ViperVenomCập nhật 6610
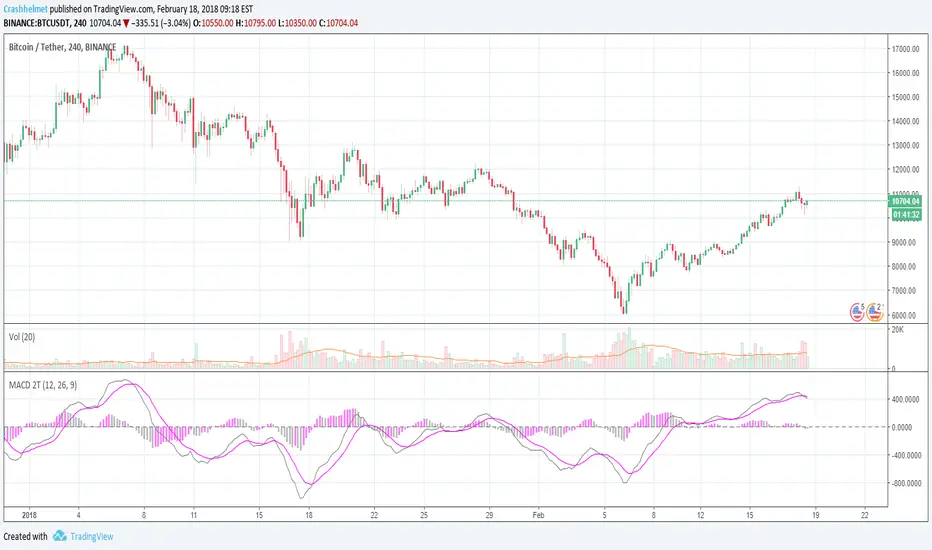
MACD Two-toneCombines color toggle/swap for histogram prediction with standard MA lines.Chỉ báo Pine Script®của Crashhelmet28
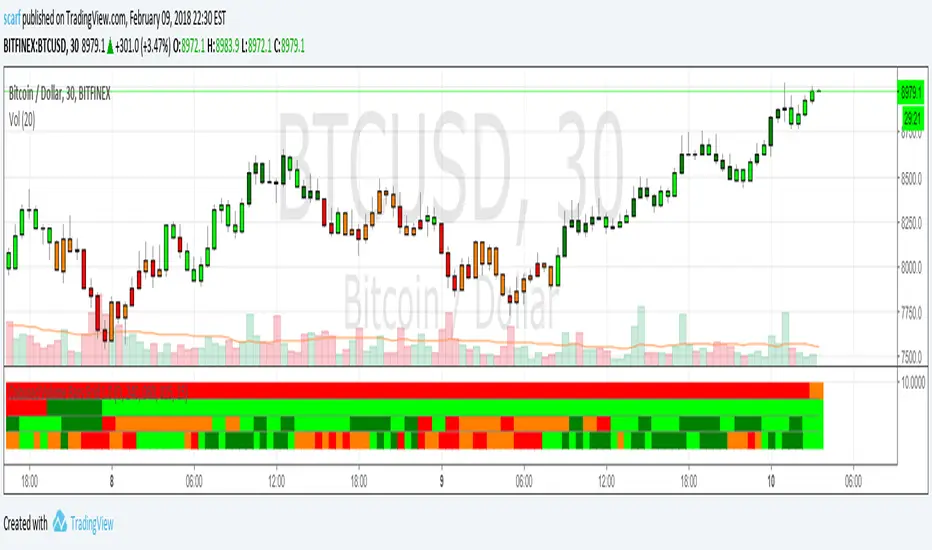
Coloured Volume Grid 1.0Candles are coloured based on relative price and volume: - If today’s closing price and volume are greater than (n) bars ago, color today’s volume bar green. - If today’s closing price is greater than (n) bars ago but volume is not, color today’s volume bar lime. - Similarly, if today’s closing price and volume is less than (n) bars ago, color today’s volume bar orange. - If today’s closing price is less than (n) bars ago but volume is not, color today’s volume bar red. The above logic in itself gives pretty remarkable considering how simple the idea is. I have added a multi-timeframe feature where the same logic is applied to 4 other timeframes. This way you can quickly be aware without having to check. There are four layers and the default settings show (from top to bottom) daily, 4h, 1h and 15m All timeframes are adjustable in the settings.Chỉ báo Pine Script®của scarf44264
CCI Histogram w/ Color STOKEDSTOCKSCCI Histogram w/ Color Has EMA option to calculate CCI STOKEDSTOCKS Finds oversold and Overbought conditionsChỉ báo Pine Script®của stokedstocks11252
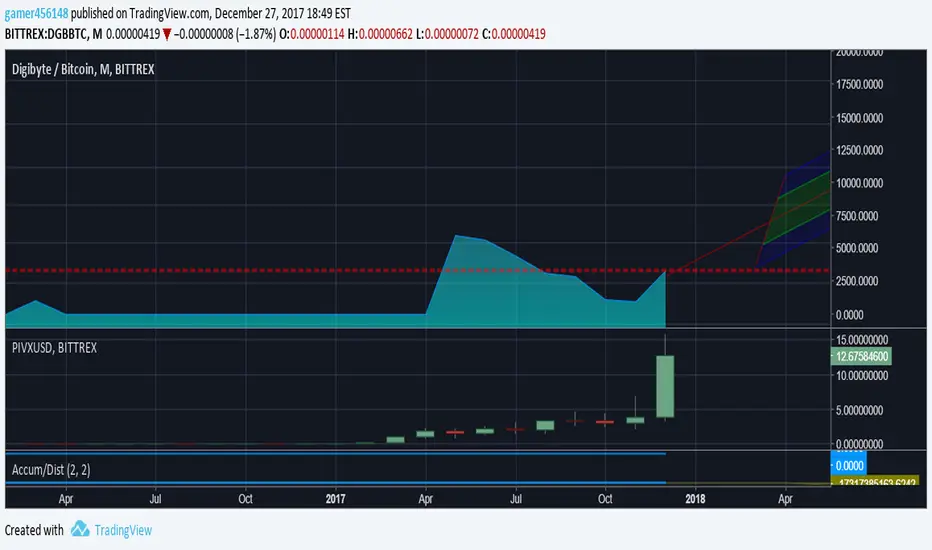
Accumulation/Distribution ViewsThis is a script for a view I wanted to go along with the Autoview plugin I bought. Keep in mind this is my first script and was created for me to learn the Pinescript framework. This isn't meant to be perfect. Indicator colors are usually blue or green or red. Also keep in mind since this is my first script in a new framework, the more stuff I build the better improvement. This is just something I wanted to first create with settings I wanted for variance and colors. The things I create in the future will obviously be an improvement.Chỉ báo Pine Script®của gamer45614846
Inside Bars Multiple Time Frames ColorHello, this is just a script that helps to identify "inside bars" on the current time frame or a higher one, by coloring them with the selected color.Chỉ báo Pine Script®của DayTradingItalia1414447
Multi Bollinger Bands V7 [SuperTrend Color] Multi Bollinger Bands V7 is for trading volatility and trend . You can user Multi Bollinger Bands V7 for Pyramid TradingChỉ báo Pine Script®của JBusiness66913
B3 ECOBlau's Ergodic Candlestick Oscillator = a decent trend finder, however slightly lagged. It can help you to see a reversal entry if you are looking for one. I find the one line ECO hard to use, so I have created this histogram version with a signal line. The colors help to show you whats going on with the ECO and its bias. This indicator shows up in a couple books by people other than Blau, and namely by Krausz. You can also see divergences, for example in pic above the lower or second of the two green humps showing that the general uptrend might be weakened as this run contained less momentum. Tighten up the signal line to see a faster change in its color. These settings are the B3 input settings for default, meaning the ones I use in trading. They are not however the default values you might read about other places.Chỉ báo Pine Script®của HammondB322290
HEIKIN ASHI COLOUR CHANGE ALERTThis can be used to trigger an alert if Heikin Ashi bar changes color :)Chỉ báo Pine Script®của some1o177 2.3 K
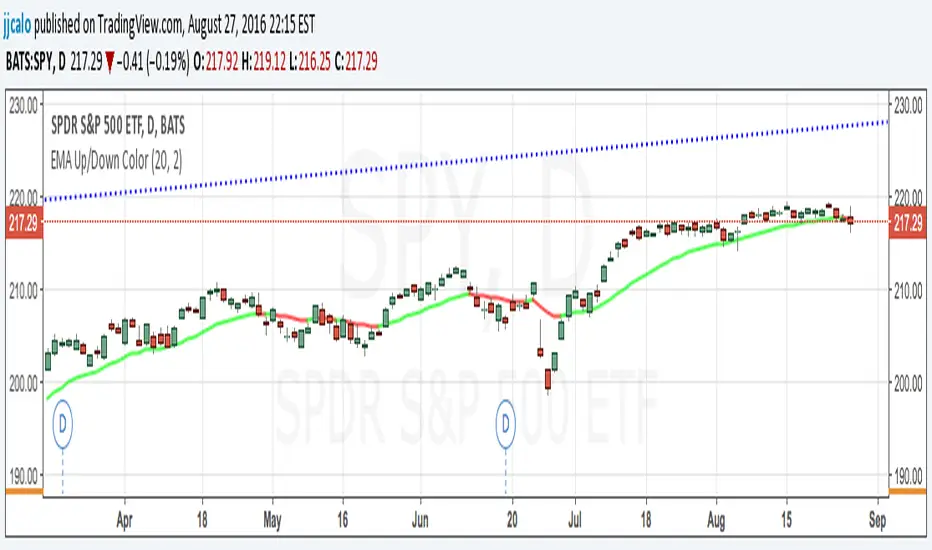
EMA Up/Down ColorPlot an EMA lime green when it's going up and red when it's going down. Chỉ báo Pine Script®của jjcalo22138
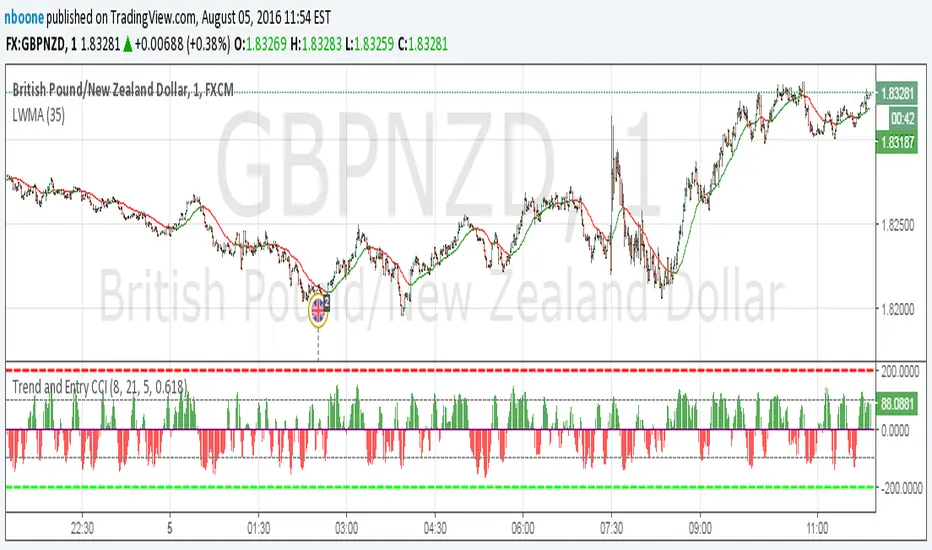
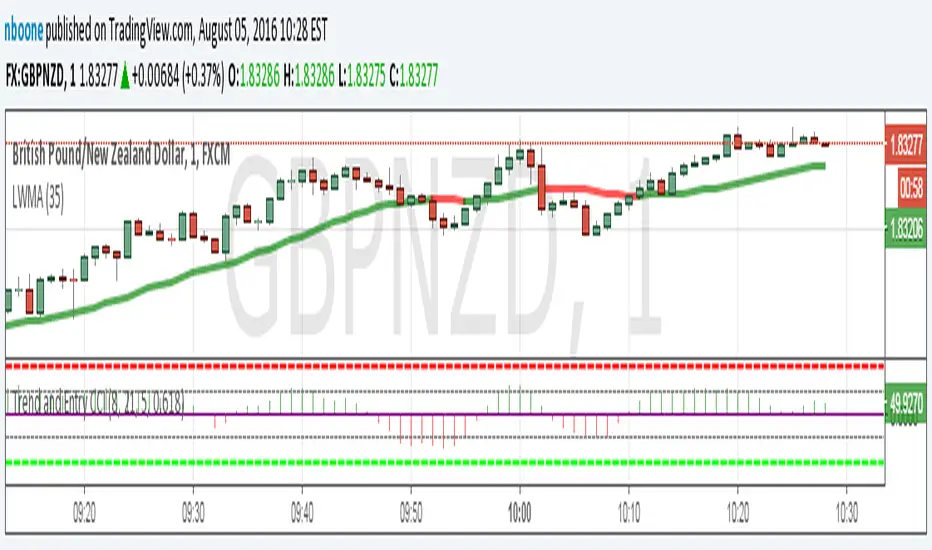
LWMA w/ Color ChangeLinear Weighted MA that changes colors based on slope. Green = slope up from last bar Yellow = slope is 0 from last bar Red = slope down from last bar This time with the ability to change the period.Chỉ báo Pine Script®của nboone33464
LWMA w/ Color ChangeLinear Weighted MA that changes colors based on slope. Green = slope up from last bar Yellow = slope is 0 from last bar Red = slope down from last barChỉ báo Pine Script®của nboone22172
Fisher Transform with Up/Down colours - squattterCredit to HPotter - colour code borrowed from his AO script.Chỉ báo Pine Script®của squattter126
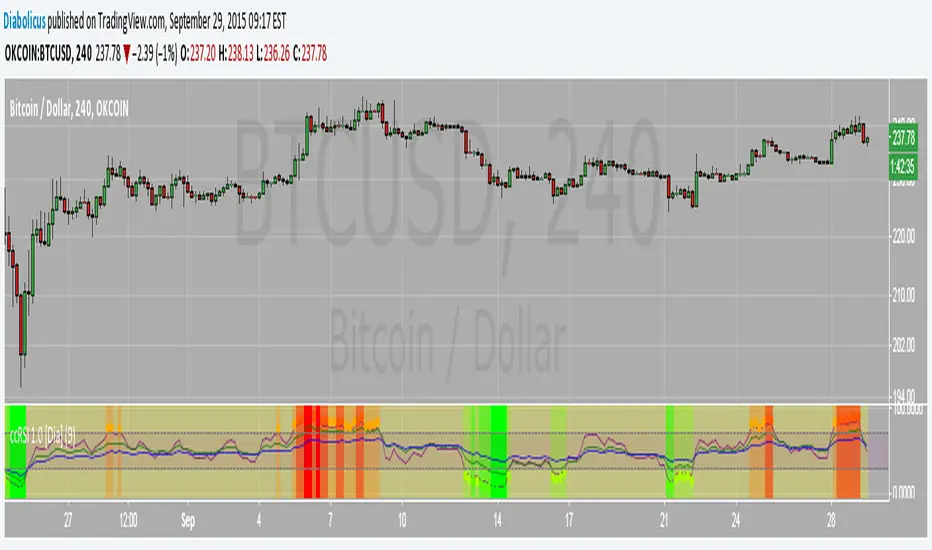
color-coded Relative Strength Indexcolor coded RSI that looks at larger time frame RSIs for confirmation (2 times and 4 times the selected RSI length).Chỉ báo Pine Script®của Diabolicus44140
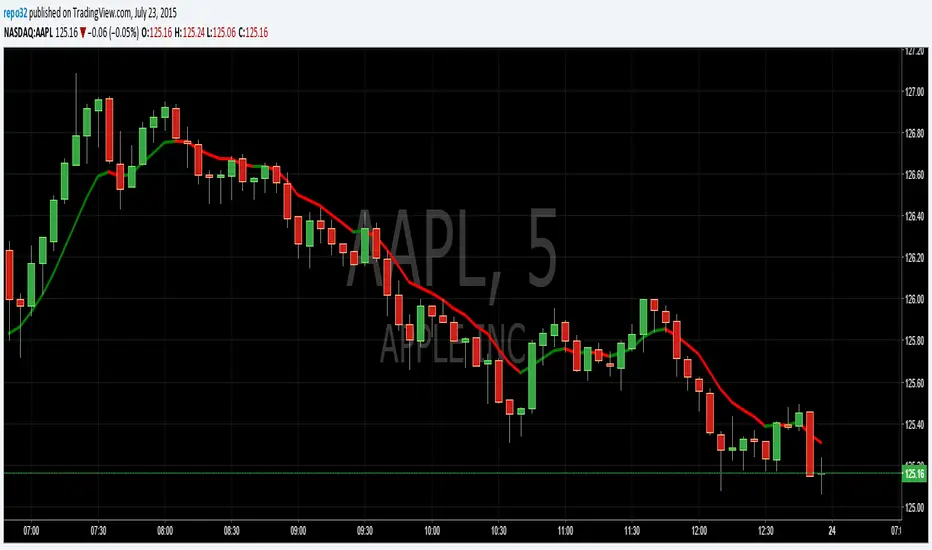
Moving Average Colored EMA/SMAThis script will give you the ability to put an EMA and/or SMA on the chart that changes color based upon the direction. Default at startup is EMA visible and SMA hidden. When the MA is moving up, it is green. When the MA is moving down, it is red. You can change the color to whatever you like.Chỉ báo Pine Script®của repo326161 13.2 K
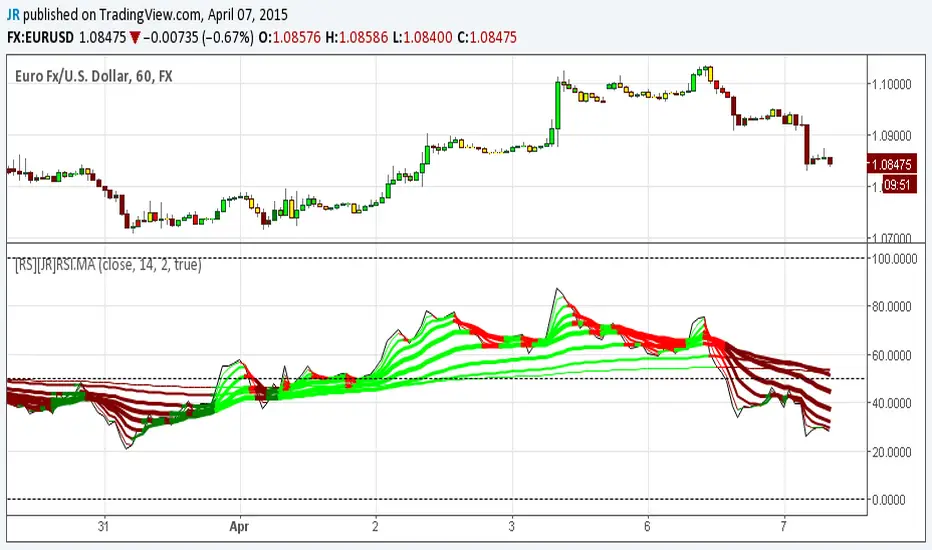
[RS][JR]RSI Ribbon + CandleRSI Ribbon + Candle By Ricardo Santos and JR In this chart rendering we are combining RSI and Moving Averages. For an added features we included colors to the candles and ribbons. Lime and green displays a strong bullish trend, yellow is caution or no trade, red and maroon are bearish trends. You can also find divergences using the ribbon. Divergence Chỉ báo Pine Script®của QuantitativeExhaustion66740