Laguerre Filter Trend Navigator [QuantAlgo]🟢 Overview
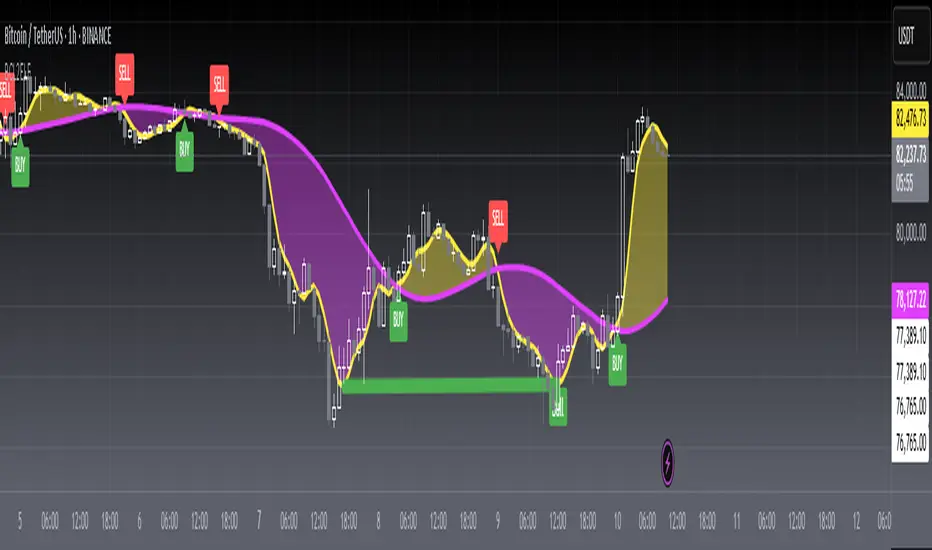
The Laguerre Filter Trend Navigator employs advanced polynomial filtering mathematics to smooth price data while minimizing lag, creating a responsive yet stable trend-following system. Unlike simple moving averages that apply equal weight to historical data, the Laguerre filter uses recursive calculations with exponentially weighted polynomials to extract meaningful directional signals from noisy market conditions. Combined with dynamic volatility-adjusted boundaries, this creates an adaptive framework for identifying high-probability trend reversals and continuations across all tradable instruments and timeframes.
🟢 How It Works
The indicator leverages Laguerre polynomial filtering, a mathematical technique originally developed for digital signal processing applications. The core mechanism processes price data through four cascaded filter stages (L0, L1, L2, L3), each applying the gamma coefficient to recursively smooth incoming information while preserving phase relationships. This multi-stage architecture eliminates random fluctuations more effectively than traditional moving averages while responding quickly to genuine directional shifts.
The gamma coefficient serves as the primary smoothing control, determining how aggressively the filter dampens noise versus tracking price movements. Lower gamma values reduce smoothing and increase filter responsiveness, while higher values prioritize stability over reaction speed. Each filter stage compounds this effect, creating progressively smoother output that converges toward true underlying trend direction.
Surrounding the filtered price line, the algorithm constructs adaptive boundaries using dynamic volatility regime measurements. These calculations quantify current market turbulence independently of direction, expanding during active trading periods and contracting during quiet phases. By multiplying this volatility assessment by a user-defined scaling factor, the system creates self-adjusting bands that automatically conform to changing market conditions without manual intervention.
The trend-following engine monitors price position relative to these volatility-adjusted boundaries. When the upper band falls below the current trend line, the system shifts downward to track bearish momentum. Conversely, when the lower band rises above the trend line, it elevates to follow bullish movement. These crossover events trigger color transitions between bullish (green) and bearish (red) states, providing clear visual confirmation of directional changes validated by volatility-normalized thresholds.
🟢 How to Use
Green/Bullish Trend Line: Laguerre filter positioned in upward trajectory, indicating momentum-confirmed conditions favorable for establishing or maintaining long positions (buy)
Red/Bearish Trend Line: Laguerre filter trending downward, signaling regime-validated environment suitable for initiating or holding short positions (sell)
Rising Green Line: Accelerating bullish filter with expanding separation from price lows, demonstrating strengthening upward momentum and increasing confidence in trend persistence with optimal long entry timing
Declining Red Line: Steepening bearish filter creating growing distance from price highs, revealing intensifying downside pressure and enhanced probability of continued decline with favorable short positioning opportunities
Flattening Trends: Horizontal or oscillating filter movement regardless of color suggests directional uncertainty where price action contradicts filter positioning, potentially indicating consolidation phases or impending volatility expansion requiring cautious trade management
🟢 Pro Tips for Trading and Investing
→ Preset Selection Framework: Match presets to your trading style - Scalping preset employs aggressive gamma (0.4) with tight volatility bands (1.0x) for rapid signal generation on sub-15-minute charts, Day Trading preset balances responsiveness and stability for hourly timeframes, while Swing Trading preset maximizes smoothing (0.8 gamma) with wide bands (2.5x) to filter intraday noise on daily and weekly charts.
→ Gamma Coefficient Calibration: Adjust gamma based on market personality - reduce values (0.3-0.5) for highly liquid, fast-moving assets like major currency pairs and tech stocks where quick filter adaptation prevents lag-induced losses, increase values (0.7-0.9) for slower instruments or trending markets where excessive sensitivity generates false reversals and whipsaw trades.
→ Volatility Period Optimization: Tailor the volatility measurement window to information cycles. Deploy shorter lookback periods (7-10) for instruments with rapid regime changes like individual equities during earnings seasons, standard periods (14-20) for balanced assessment across general market conditions, and extended periods (21-30) for commodities and indices exhibiting persistent volatility characteristics.
→ Band Width Multiplier Adaptation: Scale boundary distance to current market phase. Contract multipliers (1.0-1.5) during range-bound consolidations to capture early breakout signals as soon as genuine momentum emerges, expand multipliers (2.0-3.0) during trending markets or high-volatility events to avoid premature exits caused by normal retracement activity rather than authentic reversals.
→ Multi-Timeframe Filter Alignment: Implement the indicator across multiple timeframes, using higher intervals (4H/Daily) to identify primary trend direction via filter slope and lower intervals (15min/1H) for precision entry timing when filter colors align, ensuring trades flow with dominant momentum while optimizing execution at favorable price levels.
→ Alert-Driven Systematic Execution: Configure trend change alerts to capture every filter-validated directional shift from bullish to bearish conditions or vice versa, enabling consistent signal response without continuous chart monitoring and eliminating emotional decision-making during critical transition moments.
Laguerre

Continuation Index [DCAUT]█ Continuation Index
📊 OVERVIEW
Continuation Index (CI) is an advanced trend analysis indicator developed by John F. Ehlers. This indicator provides early warning signals for trend onset, continuation, and exhaustion, with values oscillating between -1 and +1 to offer clear trend state identification for traders.
Based on the article TASC 2025.09 "Trend Onset And Trend Exhaustion - The Continuation Index" by John F. Ehlers.
💡 CORE VALUE
Unlike traditional trend indicators, the Continuation Index provides:
- Advanced dual-filter architecture (Ultimate Smoother + Laguerre Filter)
- Inverse Fisher Transform for enhanced signal-to-noise ratio
- Adaptive gamma parameter allowing market-specific tuning
- Binary state output (+1/-1) eliminating interpretation ambiguity
🎯 CONCEPTS
Signal Interpretation
CI > 0.5 : Strong bullish trend continuation - consider holding/adding long positions
CI = +1 : Maximum bullish signal - strong uptrend in progress
CI < -0.5 : Strong bearish trend continuation - consider holding/adding short positions
CI = -1 : Maximum bearish signal - strong downtrend in progress
CI near 0 : Neutral zone - trend uncertain, wait for clear signals
Brief pullbacks from extreme states : Potential reentry opportunities in trend direction
Primary Applications
Trend Onset Detection : Early warning signals for trend initiation
Trend Exhaustion Signals : Identify potential trend reversals
Position Management : Clear binary states for entry/exit decisions
Market Timing : Adaptive filtering reduces false signals
📋 PARAMETER SETUP
Source : Data source for calculation (default: close)
Length : The calculation length for the filters (default: 40, min: 1)
Gamma : Controls the phase response of the Laguerre filter. Smaller values increase responsiveness (default: 0.8, range: 0.0-1.0)
Laguerre Order : The order of the Laguerre filter, which directly affects its lag (default: 8, range: 1-10)
📊 COLOR CODING
Green : CI > 0.5 - Bullish trend continuation
Red : CI < -0.5 - Bearish trend continuation
Gray : Neutral zone - Trend unclear

[Pandora] Laguerre Ultimate Explorations MulticatorIt's time to begin demonstrations differentiating the difference between known and actual feasibility beyond imagination... Welcome to my algorithmic twilight zone .
INTRODUCTION:
Hot off my press, I present this Laguerre multicator employing PSv6.0, originally formulated by John Ehlers for TASC - July 2025 Traders Tips. Basically I transcended Ehlers' notions of transversal filtration with an overhaul of his Laguerre design with my "what if" Pandora notions included. Striving beyond John Ehlers' original intended design. This action packed indicator is a radically revamped version of his original filter using novel techniques. My aim was to explore whether providing even more enhanced responsiveness and lesser lag is possible and how. Presented here is my mind warping results to witness.
EHLERS' LAGUERRE EXPLAINED:
First and foremost, the concept of Ehlers' Laguerre-izing method deserves a comprehensive deep dive. Ehlers' Laguerre filter design, as it functions originally, begins with his Ultimate Smoother (US) followed by a gang of four LERP (jargon for Linear intERPolation) filters. Following a myriad of cascading LERPs is a window-like FIR filter tapped into the LERP delay values to provide extra smoothness via the output.
On a side note, damping factor controlled LERP filters resemble EMAs indeed, but aren't exactly "periodic" filters that would have a period/length parameter and their subsequent calculations. I won't go into fine-grained relationship details, but EMA and LERP are indeed related in approach, being cousins of similar pedigree.
EXAMINING LAGUERRE:
I focused firstly on US initialization obstacles at Pine's bar_index==0 with nz() in abundance. The next primary notion of intrigue I mostly wondered about was, why are there four LERP elements instead of fewer or more. Why not three or why not two LERPs, etc... 1-4-6-4-1, I remember seeing those coefficients before in high pass filters.
Gathering my thoughts from that highpass knowledge base, I devised other tapped configuration modes to inspect their behavior out of curiosity. Eureka! There is actually more to Laguerre than Ehlers' mind provided, now that I had formulated additional modes. Each mode exhibits it's own lag/smoothness characteristics better than the quad LERPed version. I narrowed it down to a total of 5 modes for exploration. Mode 0 is just the raw US by itself.
ANALYZING FILTER BEHAVIORS:
Which option might be possibly superior, and how may I determine that? Fortunately, I have a custom-built analyzer allowing me to thoroughly examine transient responses across multiple periodicities simultaneously, providing remarkable visual insights.
While Ehlers has meagerly touched upon presenting general frequency responses in his books, I have excelled far beyond that. This robust filter analysis capability enables me to observe finer aspects hidden to others, ultimately leading to the deprecation of numerous existing filters. Not only this, but inventing entirely new species of filtration whether lowpass, highpass, or bandpass is already possible with a thorough comprehensive evaluation.
Revealing what's quirky with each filter and having the ability to discover what filters may be lacking in performance, is one of it's implications. I'm just going to explain this: For example US has a little too much overshoot to my liking, along with nonconformant cutoff frequency compliance with the period parameter. Perhaps Ehlers should inspect US coefficients a bit closer... I hope stating this is not received in an ill manner, as it's not my intention here.
What this technically eludes to is that UltimateSmoother can be further improved, analogous to my Laguerre alterations described above. I will also state Laguerre can indeed be reformulated to an even greater extent concerning group delay, from what I have already discussed. Another exciting time though... More investigative research is warranted.
LAGUERRE CONCLUSIONS:
After analyzing Laguerre's frequency compliance, transient responses, amplitudes, lag, symmetry across periodicities, noise rejection, and smoothness... I favor mode 3 for a multitude of reasons over the mode 4 configuration, but mostly superb smoothing with less lag, AND I also appreciated mode 1 & 2 for it's lower lag performance options.
Each mode and lag (phase shift) damping value has it's own unique characteristics at extremes, yet they demonstrate additional finesse in it's new hybrid form without adding too much more complexity. This multicator has a bunch of Laguerre filters in the overlay chart over many periodicities so you can easily witness it's differing periodic symmetries on an input signal while adjusting lag and mode.
LAGUERRE OSCILLATOR:
The oscillator is integrated into the laguerreMulti() function for the intention of posterity only. I performed no evaluation on it, only providing the code in Pine. That wasn't part of my intended exploration adventure, as I'm more TREND oriented for the time being, focusing my efforts there.
Market analysis has two primary aspects in my observations, one cyclic while the other is trending dynamics... There's endless oscillators, but my expectations for trend analysis seems a little lesser explored in my opinion, hence my laborious trend endeavors. Ehlers provided both indicator facets this time around, and I hope you find the filtration aspect more intriguing after absorption of this reading.
FUNCTION MODULES EXPLAINED:
The Ultimate Smoother is an advanced IIR lowpass smoothing filter intended to minimize noise in time series data with minimal group delay, similar to a traditional biquad filter. This calculation helps to create a smoother version of the original signal without the distortions of short-term fluctuations and with minimal lag, adjustable by period.
The Modified Laguerre Lowpass Filter (MLLF) enhances the functionality of US by introducing a Laguerre mode parameter along side the lag parameter to refine control over the amount of additional smoothing/lag applied to the signal. By tethering US with this LERPed lag mechanism, MLLF achieves an effective balance between responsiveness and smoothness, allowing for customizable lag adjustments via multiple inputs. This filter ends with selecting from a choice of weighted averages derived from a gang of up to four cascading LERP calculations, resulting with smoother representations of the data.
The Laguerre Oscillator is a momentum-like indicator derived from the output of US and a singular LERPed lowpass filter. It calculates the difference between the US data and Laguerre filter data, normalizing it by the root mean square (RMS). This quasi-normalization technique helps to assess the intensity of the momentum on any timeframe within an expected bound range centered around 0.0. When the Laguerre Oscillator is positive, it suggests that the smoothed data is trending upward, while a negative value indicates a downward trend. Adjustability is controlled with period, lag, Laguerre mode, and RMS period.

TASC 2025.07 Laguerre Filters█ OVERVIEW
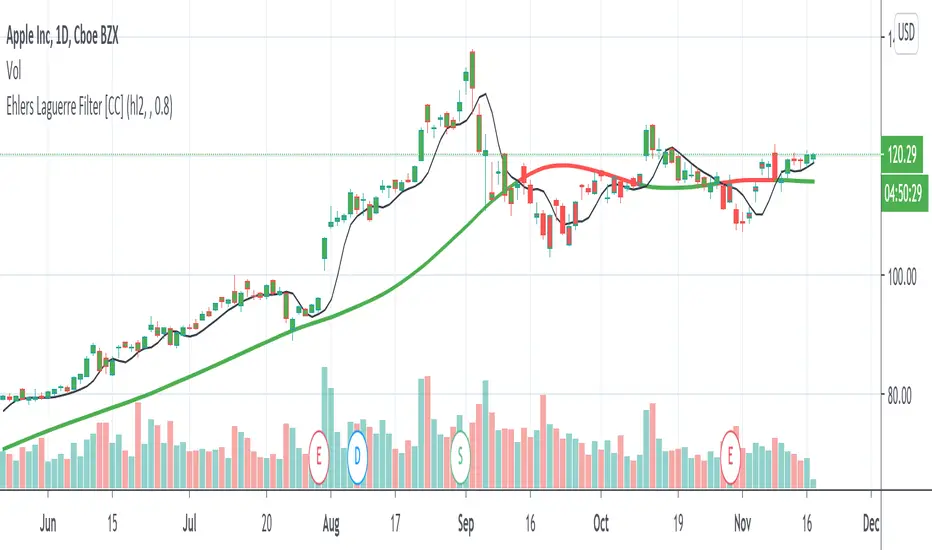
This script implements the Laguerre filter and oscillator described by John F. Ehlers in the article "A Tool For Trend Trading, Laguerre Filters" from the July 2025 edition of TASC's Traders' Tips . The new Laguerre filter utilizes the UltimateSmoother filter in place of an exponential moving average (EMA) in its calculation, offering improved responsiveness and reduced lag.
█ CONCEPTS
As Ehlers explains in his article, the Laguerre filter is a form of transversal filter . A transversal filter calculates an output signal using a tapped delay line . It creates multiple delayed versions of an input signal, applies weight to each delay, and then calculates their sum to generate the filtered result.
The Laguerre filter's structure relies on Laguerre polynomials — solutions to a differential equation solved by Edmond Laguerre in the 1800s. When Ehlers analyzed the formula for these polynomials on discrete systems (e.g., financial time series), he found that the first term's expression corresponds to an EMA response, and all subsequent terms correspond to an all-pass response. In contrast to other filter types, an all-pass filter produces phase shift (i.e., delay) in an input signal's components without affecting its amplitude.
Ehlers observed that these characteristics of Laguerre polynomials make them suitable for use in a transversal filter structure, and thus the Laguerre filter was born. However, he notes that EMAs are not great filters in general. As such, to improve on the Laguerre filter's design, Ehlers modified it by replacing the EMA term with his UltimateSmoother filter. The resulting Laguerre filter has significantly reduced lag, achieving a tighter response to market fluctuations while maintaining smoothness. Ehlers suggests that traders can analyze crossings between the UltimateSmoother and this Laguerre filter, or those between two Laguerre filters of different order, for helpful buy and sell signals.
In addition to the Laguerre filter, Ehlers derived a smooth, low-lag oscillator based on the difference between the first and second terms in the modified filter structure, scaled by the root mean square (RMS). The resulting oscillator provides an alternative filtered representation of market data, which can help traders identify swing and mean-reversion signals.
█ USAGE
This indicator calculates both the Laguerre filter and the Laguerre oscillator described in Ehlers' article. It displays the Laguerre filter on the main chart pane and the oscillator in a separate pane.
Users can control the behavior of the filter and oscillator with the inputs in the "Settings/Inputs" tab:
The "Period" input defines the critical period of the UltimateSmoother used in the Laguerre filter and oscillator calculations. Its default value is 30.
The "Gamma" input determines the weighting behavior of the Laguerre filter and oscillator. It accepts a positive value between 0 and 1. Use a lower value for quicker responsiveness to market changes, and a higher value for trends. The default value is 0.5.
The "RMS length" input determines the length of the RMS calculation for oscillator normalization. The default value is 100 bars.

Relative Momentum Index with Laguerre FilterThe Relative Momentum Index
The Relative Momentum Index (RMI) is an oscillator that is a variation of the Relative Strength Index (RSI), but incorporates momentum over a variable lookback period rather than just consecutive price changes, which can help identify reversals and filter out noise.
It measures the momentum of price changes over a specified period, rather than just the magnitude of price changes like the RSI does.
It counts up and down days from the current closing price relative to the closing price a certain number of days ago (e.g. 5 days ago), instead of just comparing consecutive daily closes like the RSI
It is calculated by taking the ratio of the average upward price changes to the average downward price changes over a given period, where each change is measured from the close X days ago (X is the “momentum” period)
Like the RSI, the RMI oscillates between 0 and 100, with readings above 70 considered overbought and below 30 oversold.
In trending markets, the RMI tends to remain in overbought or oversold territory for extended periods. In trading ranges, it oscillates more predictably between the overbought and oversold levels.
The RMI is generally considered better than the RSI at identifying potential reversal points, as it incorporates a momentum factor rather than just strength.
It can be used in a similar way to the RSI for trade signals, such as buying when it rises above 30 from below, or selling when it falls below 70 from above
The Laguerre filter
A Laguerre filter is a type of infinite impulse response (IIR) filter used for smoothing signals or data. The Laguerre filter provides a way to apply variable smoothing to a signal by adjusting its pole position, allowing you to control the balance between smoothness and lag based on your preferences. It is an alternative to simple moving averages that can better preserve the shape of the original signal.

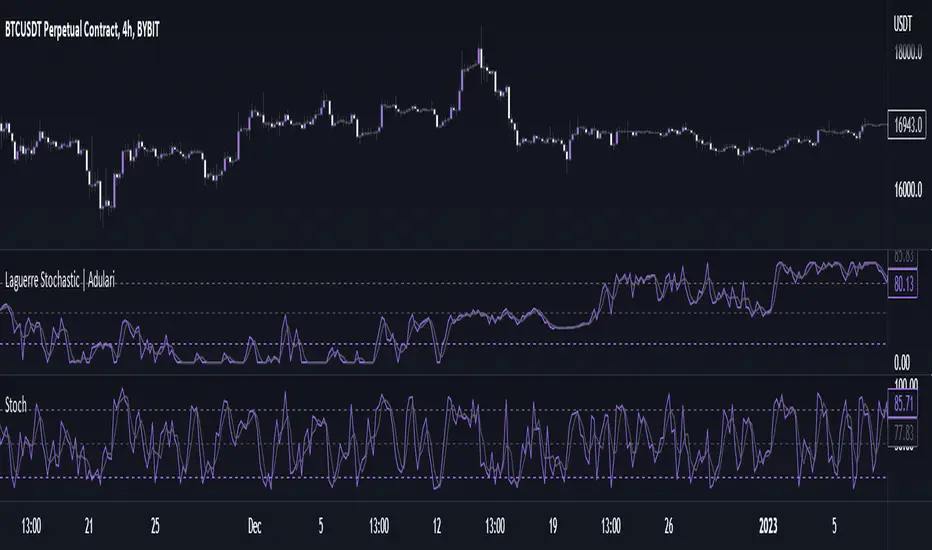
Laguerre Stochastic | AdulariDescription:
The Laguerre Stochastic is similar to a 4-period regular Stochastic, except that a Laguerre transform has been applied for price smoothing. The Laguerre transform is a mathematical technique that allows smooth indicators to be built using small amounts of data.
How do I use it?
Never use this indicator as standalone trading signal, it should be used as confluence.
When the value is above the middle line this shows the bullish trend is strong.
When the value is below the middle line this shows the bearish trend is strong.
When the value crosses above the upper line this indicates the trend may reverse downwards.
When the value crosses below the lower line this indicates the trend may reverse upwards.
When the value crosses above the signal this indicates the current bearish trend is getting weak and may reverse upwards.
When the value crosses below the signal this indicates the current bullish trend is getting weak and may reverse downwards.
Features:
Oscillator value indicating the difference between highs and lows fractioned by the close price.
%D value acting as a smoothed version of the %K.
Horizontal lines such as oversold, overbought and middle lines, indicating possible interest zones.
How does it work?
1 — Calculate regular Stochastic value.
2 — Apply the Laguerre transform.
3 — Calculate %D value by applying smoothing to the %K value.
[DuDu95] SSL 4C MACD Laugerre RSI StrategyHello Guys! Nice to meet you all!
Before I start, my nickname has changed to 'DuDu95'!!
This is the Strategy introduced by youtube channel.
I made this based on the open source indicator by kevinmck100, vkno422, KivancOzbilgic. Thank you All!
### Entry Logic
1. Long Entry Logic
- close > SSL Hybrid baseline upper k (keltner channel)
- macd signal > 0 and current MACD value > previous MACD value
- Laguerre RSI < overbought Line.
2. short Entry Logic
- close < SSL Hybrid baseline lower k (keltner channel)
- macd signal < 0 and current MACD value < previous MACD value
- Laguerre RSI > overbought Line.
### Exit Logic
1. Long Exit Logic
- close < SSL Hybrid baseline lower k (keltner channel)
- macd signal < 0
2. short Entry Logic
- close > SSL Hybrid baseline upper k (keltner channel)
- macd signal > 0
### StopLoss
1. Can Choose Stop Loss Type: Percent, ATR, Previous Low / High.
2. Can Chosse inputs of each Stop Loss Type.
### Take Profit
1. Can set Risk Reward Ratio for Take Profit.
- To simplify backtest, I erased all other options except RR Ratio.
- You can add Take Profit Logic by adding options in the code.
2. Can set Take Profit Quantity.
### Risk Manangement
1. Can choose whether to use Risk Manangement Logic.
- This controls the Quantity of the Entry.
- e.g. If you want to take 3% risk per trade and stop loss price is 6% below the long entry price,
then 50% of your equity will be used for trade.
2. Can choose How much risk you would take per trade.
### Plot
1. Added Labels to check the data of entry / exit positions.
2. Changed and Added color different from the original one. (green: #02732A, red: #D92332, yellow: #F2E313)

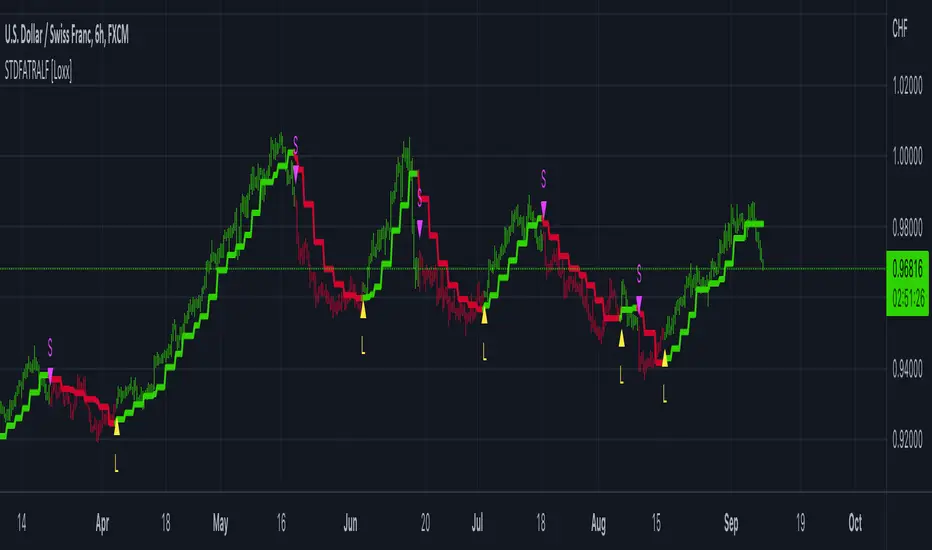
STD-Filtered, ATR-Adaptive Laguerre Filter [Loxx]STD-Filtered, ATR-Adaptive Laguerre Filter is a standard Laguerre Filter that is first made ATR-adaptive and the passed through a standard deviation filter. This helps reduce noise and refine the output signal. Can apply the standard deviation filter to the price, signal, both or neither.
What is the Laguerre Filter?
The Laguerre RSI indicator created by John F. Ehlers is described in his book "Cybernetic Analysis for Stocks and Futures". The Laguerre Filter is a smoothing filter which is based on Laguerre polynomials. The filter requires the current price, three prior prices, a user defined factor called Alpha to fill its calculation. Adjusting the Alpha coefficient is used to increase or decrease its lag and it's smoothness.
Included:
Bar coloring
Signals
Alerts
Loxx's Expanded Source Types
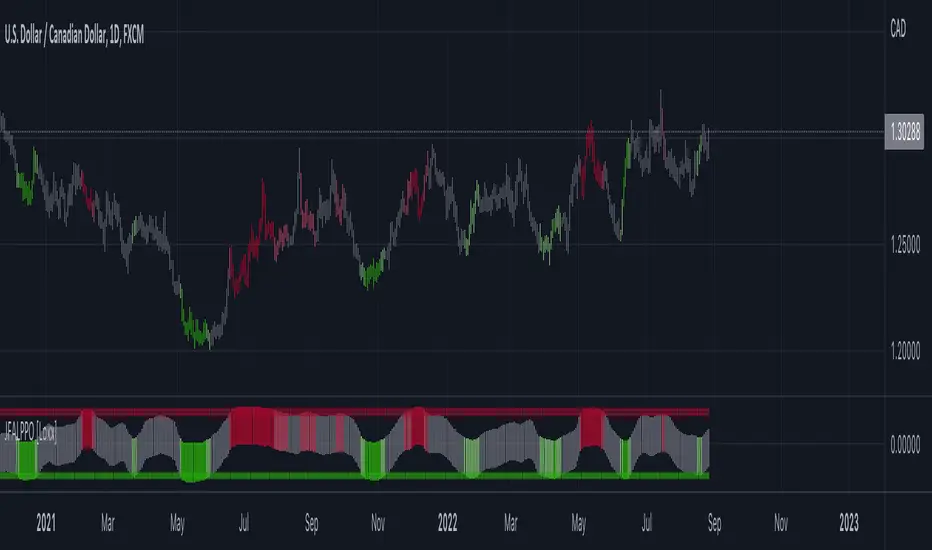
Jurik-Filtered, Adaptive Laguerre PPO [Loxx]Jurik-Filtered, Adaptive Laguerre PPO is an indicator used to find reversals. Smoothing with a Jurik Filter reduces noise and better identifies reversal points.
What is Laguerre Filter?
The Adaptive Laguerre is based on the Laguerre filter, described by John Ehlers in his paper “Time Warp – Without Space Travel”. It applies a variable gamma factor, based on how well the filter is tracking previous price movement. As with other adaptive moving averages, the Adaptive Laguerre tracks trending markets closely but will see less changes in range-bound markets.
The Adaptive Laguerre filter allows for an adjustment of the simple Laguerre filter. When price moves away from the filter, it becomes faster. When price moves sideward, the filter gets slower. Accordingly, this indicator belongs to the same class of moving average as the Kaufman Adaptive Moving Average (KAMA). It similar to the Volatility Index Dynamic Average (VIDYA) developed by Tushar Chande. The Adaptive Laguerre filter is smoother than the VIDYA and will adjust slower to price action after consolidations.
What is Jurik Volty?
One of the lesser known qualities of Juirk smoothing is that the Jurik smoothing process is adaptive. "Jurik Volty" (a sort of market volatility ) is what makes Jurik smoothing adaptive. The Jurik Volty calculation can be used as both a standalone indicator and to smooth other indicators that you wish to make adaptive.
What is the Jurik Moving Average?
Have you noticed how moving averages add some lag (delay) to your signals? ... especially when price gaps up or down in a big move, and you are waiting for your moving average to catch up? Wait no more! JMA eliminates this problem forever and gives you the best of both worlds: low lag and smooth lines.
Ideally, you would like a filtered signal to be both smooth and lag-free. Lag causes delays in your trades, and increasing lag in your indicators typically result in lower profits. In other words, late comers get what's left on the table after the feast has already begun.
Included:
-Toggle on/off bar coloring
Vortex Indicator w/ ALFAdded Adaptive Laguerre Filters (ALF) to built-in TradingView Vortex Indicator.
Use these ALFs similar to an MA or ROC on the VI+ or VI-, as they indicate the strength of the uptrend/downtrend and can help spot tops and bottoms earlier (when the VI line crosses through the ALF the ALF will change color)
- Added configurable horizontal lines to show periods of extremely high/low trend strength. Also can be used to help call tops/bottoms.
- Add horizontal ranges with background color/
- Added background color for when RSI is above a certain level (50 by default). Etienne Botes has mentioned using Vortex with RSI of the same period being over 50.0 can filter out false signals.
- Added background color for when VI+ and VI- cross.
- Added adaptive lookback length based on timeframes. I don't recommend daytrading using multiple vortex timeframes, but it can be useful when screening/analyzing stocks.

Laguerre FilterThis is the Laguerre Filter by John F. Ehlers. He published this filter design in the article Time Wrap - Without Space Travel.
This study open gamma and weight of each filter for to customize the filter design.
For example, setting gamma to 0.2, 0.7, 0.8,0.8 and weight 1,2,2,1, the curve is a very nice simulation to ALMZ(50),
setting gamma to 0.3, 0.3, 0.8, 0.9 and weight of 1,3,3,1 will produce a curve close to EMA(20),
basically, the Laguerre filter can simulate various type of moving averages.
The beauty of this Filter is it use only one data point and 3 filters output to reproduce various moving average, it is
an innovative approach to develop smoothing lines, and to avoid whipsaws on the price.
Each filter can be plotted for evaluation too.
Data of the first filter allows to input any bar, eg. 0 for current bar, 1 for one previous, for the purpose to evaluate forecasting idea.
Follows Ehlers' paper, this study allows to plot the weighted average line with all filter off.

7 Moving Averages [Plus]Moving Averages are price based, lagging (or reactive) indicators that display the average price of a security over a set period of time. A Moving Average is a good way to gauge momentum as well as to confirm trends, and define areas of support and resistance. Essentially, Moving Averages smooth out the “noise” when trying to interpret charts. Noise is made up of fluctuations of both price and volume. Because a Moving Average is a lagging indicator and reacts to events that have already happened, it is not used as a predictive indicator but as an interpretive one for confirmations and analysis.
Bollinger Bands (BB) are a widely popular technical analysis instrument created by John Bollinger. The BB consist of a band of three lines which are plotted in relation to security prices. The line in the middle is usually a Simple Moving Average (SMA) set to a period of 20 days (the type of trend line and period can be changed by the trader; however a 20 day moving average is by far the most popular). The SMA then serves as a base for the Upper and Lower Bands which are used as a way to measure volatility by observing the relationship between the Bands and price. Typically the Upper and Lower Bands are set to two standard deviations away from the SMA (The Middle Line); however the number of standard deviations can also be adjusted by the trader.
This script shows 6 moving averages and Bollinger Bands.
Features:
- Standard MA inputs.
- MA type.
- MA period.
- MA source.
- MA resolution (time frame).
- MA Offset.
- Forecasting : forcasted prices are calculated using our MAType and MASource for the MAPeriod.
- Trail: Show only candles not included in the MA calculation.
The color of MA1 depends on the chosen strategy, by default this is the 3EMA strategy. You can also select "Pivot Point Supertrend" or "Ichimoku Trend"
Added "Parabolic Stop and Reverse (PSAR)" . The PSAR is a time and price technical analysis tool primarily used to identify points of potential stops and reverses. In fact, the SAR in Parabolic SAR stands for "Stop and Reverse". The indicator's calculations create a parabola which is located below price during a Bullish Trend and above Price during a Bearish Trend.
Added "Linear Regression Channel" which can be correctly plotted on logarithmic charts. A linear regression channel consists of a median line with 2 parallel lines, above and below it, at the same distance. Those lines can be seen as support and resistance. The median line is calculated based on linear regression of the closing prices but the source can also be set to open, high or low. The height of the channel is based on the deviation of price to the median line. Extrapolating the channel forward can help to provide a bias and to find trading opportunities.

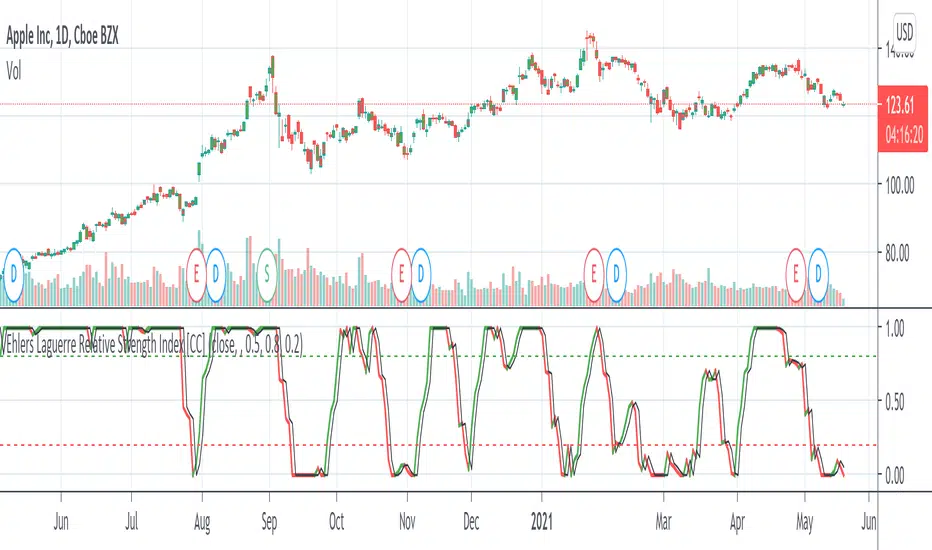
Ehlers Laguerre Relative Strength Index [CC]The Laguerre Relative Strength Index was created by John Ehlers and this is essentially his version of the RSI but I find that the buy and sell signals work better with his version as you can see. Buy when the line turns green and sell when the line turns red.
Let me know if there are any other indicators you want me to publish!
Combo Backtest 123 Reversal & Laguerre-based RSI This is combo strategies for get a cumulative signal.
First strategy
This System was created from the Book "How I Tripled My Money In The
Futures Market" by Ulf Jensen, Page 183. This is reverse type of strategies.
The strategy buys at market, if close price is higher than the previous close
during 2 days and the meaning of 9-days Stochastic Slow Oscillator is lower than 50.
The strategy sells at market, if close price is lower than the previous close price
during 2 days and the meaning of 9-days Stochastic Fast Oscillator is higher than 50.
Second strategy
This is RSI indicator which is more sesitive to price changes.
It is based upon a modern math tool - Laguerre transform filter.
With help of Laguerre filter one becomes able to create superior
indicators using very short data lengths as well. The use of shorter
data lengths means you can make the indicators more responsive to
changes in the price.
WARNING:
- For purpose educate only
- This script to change bars colors.

[blackcat] L2 Ehlers Laguerre FilterLevel: 2
Background
John F. Ehlers introuced Laguerre Filter in his "Cybernetic Analysis for Stocks and Futures" chapter 14 on 2004.
Function
The Laguerre transform can be represented as an exponential moving average (EMA) low-pass filter (the first term) followed by a succession of allpass elements instead of unit delays (the k − 1 terms). All terms have exactly the same damping factor γ (gamma). We see that these are all pass networks by examining the frequency response. Dr. Ehlers made a filter using the Laguerre elements instead of the unit delay, whose coefficients are also /6 as with the FIR filter. The difference is that we have warped the time between the delay line
taps.
Key Signal
FIR ---> Laguerre Filter fast line
Filt ---> Laguerre Filter slow line
Pros and Cons
100% John F. Ehlers definition translation of original work, even variable names are the same. This help readers who would like to use pine to read his book. If you had read his works, then you will be quite familiar with my code style.
Remarks
The 33th script for Blackcat1402 John F. Ehlers Week publication.
Readme
In real life, I am a prolific inventor. I have successfully applied for more than 60 international and regional patents in the past 12 years. But in the past two years or so, I have tried to transfer my creativity to the development of trading strategies. Tradingview is the ideal platform for me. I am selecting and contributing some of the hundreds of scripts to publish in Tradingview community. Welcome everyone to interact with me to discuss these interesting pine scripts.
The scripts posted are categorized into 5 levels according to my efforts or manhours put into these works.
Level 1 : interesting script snippets or distinctive improvement from classic indicators or strategy. Level 1 scripts can usually appear in more complex indicators as a function module or element.
Level 2 : composite indicator/strategy. By selecting or combining several independent or dependent functions or sub indicators in proper way, the composite script exhibits a resonance phenomenon which can filter out noise or fake trading signal to enhance trading confidence level.
Level 3 : comprehensive indicator/strategy. They are simple trading systems based on my strategies. They are commonly containing several or all of entry signal, close signal, stop loss, take profit, re-entry, risk management, and position sizing techniques. Even some interesting fundamental and mass psychological aspects are incorporated.
Level 4 : script snippets or functions that do not disclose source code. Interesting element that can reveal market laws and work as raw material for indicators and strategies. If you find Level 1~2 scripts are helpful, Level 4 is a private version that took me far more efforts to develop.
Level 5 : indicator/strategy that do not disclose source code. private version of Level 3 script with my accumulated script processing skills or a large number of custom functions. I had a private function library built in past two years. Level 5 scripts use many of them to achieve private trading strategy.
Ehlers Laguerre Filter [CC]The Laguerre Filter was created by John Ehlers (Cybernetic Analysis For Stocks And Futures pg 216) and this indicator works well with letting you know both the short and long term trend as well as a pretty good moving average. If the indicator line is above the black line then it is a long term uptrend and below the black line is a long term downtrend. Buy when the indicator line is green and sell when it turns red.
Let me know if there are other scripts you would like to see me publish or if you want something custom done!
Laguerre RSI by KivancOzbilgic STRATEGYBacktesting.
" Laguerre RSI is based on John EHLERS' Laguerre Filter to avoid the noise of RSI .
Change alpha coefficient to increase/decrease lag and smoothness.
Buy when Laguerre RSI crosses upwards above 20.
Sell when Laguerre RSI crosses down below 80.
While indicator runs flat above 80 level, it means that an uptrend is strong.
While indicator runs flat below 20 level, it means that a downtrend is strong. "
Developer: John EHLERS
Author: KivancOzbilgic

Laguerre RSILaguerre RSI is based on John EHLERS' Laguerre Filter to avoid the noise of RSI.
Change alpha coefficient to increase/decrease lag and smoothness.
Buy when Laguerre RSI crosses upwards above 20.
Sell when Laguerre RSI crosses down below 80.
While indicator runs flat above 80 level, it means that an uptrend is strong.
While indicator runs flat below 20 level, it means that a downtrend is strong.
Developer: John EHLERS
Author: KivancOzbilgic

Trend-Following Combo-SuperTrend, EMA, Aroon, DMI, Laguerre RSIThis is a trend-following indicator which condenses two SuperTrend indicators -- one based on analysis over a shorter period of time (1.5, 7), and one based on analysis over a longer period of time (1.65, 100) -- into a single indicator which appears on your chart only when both the shorter- and longer-term analysis indicates a "SuperTrend" in the same direction.
Additionally, potential trade entry indicators are displayed in the form of up and down arrows when (by default) three of the following five indicators suggest that the market is trending in the same direction as both the shorter- and longer-term SuperTrend indicators:
EMA Crossover (8, 15)
Aroon Indicator (8)
Aroon Oscillator (8)
Directional Movement Index (DI +/-) (8)
Laguerre RSI (13)
You may update the parameters of any of the indicators to match your own preferences.
Additionally, you may also adjust the "Threshold" of indicators that must be in agreement with the SuperTrend to show a potential trade entry arrow. Bear in mind that if you set the Indicator Threshold too low, you will see more frequent trade entry arrows, many of which will not be profitable if taken. Similarly, set this value too high, and you will see fewer trade entry arrows that may not appear until after most of the "juice" in the trend has evaporated. Ideal values for the threshold seem to be between 2-4, depending on the symbol you are trading.
The following image shows all of the indicators referenced above on a 5-minute chart of the SPY during a single trading day:
And, here is the same period of time showing only the Trend-Following Combo indicator with default settings:
This indicator would not have been possible save for work contributed by the following:
SuperTrend by Rajandran R
Aroon w/ crossovers highlighted by seiglerj
Aroon Oscillator by jcrewolinsky
Directional Movement Index by TradingView
Laguerre RSI (Self Adjusting Alpha with Fractals Energy) by everget

(13) Twists Swing/Day VS-478TWISTS adds a simple, but very effective twist to utilizing a multiple moving average crossover systems, enabling the effective and profitable trading of any stock, crypto or commodity. This enables trend, swing and day traders to dramatically improve their results over a similar, short-term simple, smoothed, exponential or weighted moving average crossover system.
Four distinct Laguerre filters are applied to the price, one fast, one medium one long and one very long. The default Laguerre settings are: Short = 0; Medium = 0.33, Long = 0.55 XLong = 0.77. The correlation between the length of time and the Laguerre output is adjustable in the format > inputs pane for this indicator and are referred to as gamma. The first three lengths produce two major bands or ribbons. During up trends the top band is filled with green and during down trends this top band will be filled with red. Obviously these bands or ribbons are twisting or flipping positions when the direction of the price trends change. Trading indicator dots are produced during both phases. Green dots for uptrends and red dots during down trends. During consolidation phases it is possible that there will be no dots produced because of the rule set applied to these Entry/hold and Exit/short indicator dots.
TWISTS is a triple moving average trading system using an advanced smoothing filter developed by John Ehlers. You can read about this dramatic advancement in moving averages in the following article: Time Warp -- Without Space Travel. You can find the link to this article on our site.
Access this Genie indicator for your Tradingview account, through our web site. (Links Below) This will provide you with additional educational information and reference articles, videos, input and setting options and trading strategies this indicator excels in.

(12) Pass Band Muti VS-97PBM transforms volatile and conflicting candles into obvious and easy trading decisions. It’s this simple; stocks trending in an upward direction will be above the zero line (1) in the chart below. Stock trending downward will be below the zero line (2). Zero line crossovers are indicating turning points and trading opportunities (3). This gives you advanced warning of when your trades are approaching the next turning point, as the indicator will migrate back toward the zero line. Momentum, Volatility and Rate-of-Change are each unique and distinctive attributes of stocks in strong trends. The Pass Band Multi indicator provides the trader with a collective or merged indication of these attributes, all reflected by this indicator as the height or distance the Pass Band, sin-wave, signal line is from the zero line (4).
When a stock’s PBM indicator advances rapidly, moving far above or far below the zero line you are seeing stocks in a strong trend with strong momentum. This strength and correspondingly the momentum will diminish over time in the absence of new market motivating factors such as rumors, news or earnings. As this occurs, the signal line will again drift down and approach the zero line even if the price has not moved against this most recent trend(5). This is a function of most oscillators and is referred to as detrending.
The closer your trade comes to the zero line the more likely you are to see a reversal in the stock's price in the near future. The PBM signal moving inside the center band (gold lines/blue fill)(6) indicates to you that this upward momentum has neutralized and an exit may be required as the stock’s price approaches the zero line. If you have a strong convection of this stock’s long term potential, then you can hold the stock as long as the Pass Band signal does not move below the zero line.
Stocks approaching the zero line, moving inside of the blue center band with gold boarders or tracking very near to the zero line indicate to traders that some action may be required by them to preserve capital in the near future. Short signals are exactly the opposite of the above description.
Over extended prices are signaled by green or red background flags and periods of consolidation are flagged with gold a background color.
Pass Band Multi is an excellent indicator for any class of equity, but as you can see from the example chart, it is also an excellent crypto trading indicator.
Access this Genie indicator for your Tradingview account, through our web site. (Links Below) This will provide you with additional educational information and reference articles, videos, input and setting options and trading strategies this indicator excels in.

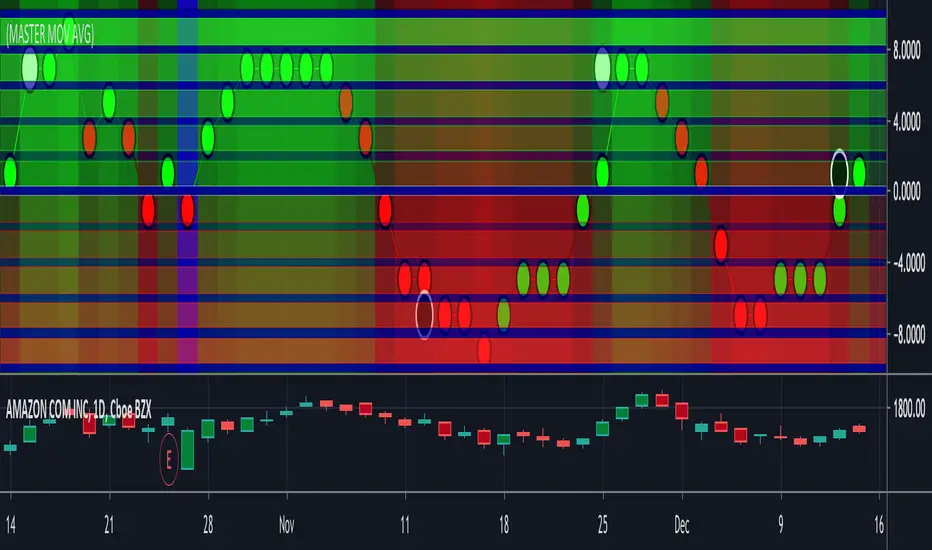
(11) Master Moving Average VS-168Moving Averages have been a staple of technical traders for a lot longer than computers have been available to accomplish the calculations. Luckily today we are able to easily produce very sophisticated, reactive moving averages using multiple algorithms designed by individuals with different backgrounds, talents and skill sets. The Master Moving Average Envelope calculates 9 distinct moving averages and then utilizes a knockout scoring system to produce a single combined score between -10 and +10. When we refer to a knockout scoring system, it simply means that if one of these indicators is positive and one is negative they cancel each other out. The majority of the survivors wins and that calculated total produces the MMAE dot's score and determines the dots location on the MMAE indicator chart.
The envelope refers to the area produced by multiple moving averages of different lengths. When you have a short time frame and a long time frame the two lines will contain between them, the majority of the candles. The area between these two lines is the, "envelope" and it allows us to stay in a trade during a pre-determined amount of volatility. This keeps us in trades when the stock might be experiencing short term counter trend trading action. As these two lines converge as the stocks price changes direction the envelope become smaller and smaller until it disappears briefly as the stock price changes direction. The center line of this indicator indicates a turning point in the price action where the envelope has become very small or nonexistence. Moving average are not reliable indicators as the envelop disappears and a crossover point nears. This indicator is most reliable when the stock price is not near the center demarcation line.
Access this Genie indicator for your Tradingview account, through our web site. (Links Below) This will provide you with additional educational information and reference articles, videos, input and setting options and trading strategies this indicator excels in.
(5) Volume Price Projection VS-93Volume Price Projection, displays only the differences the current volume represents above or below the current moving average of volume. This isolates only significant volume events for the trader. When utilized in combination with a simple volume/price matrix chart, traders are provided with a powerful tool-set, alerting traders of potential opportunities while providing strong conformations of your trading decisions.
Volume is a direct reflection of the current level of interest in this equity. What is important about interest levels, regardless of sentiment (positive or negative,) produced by any event, is if the event or news is to have an impact on share price, the volume will increase as a result. This volume increase provides the liquidity required to allow market dynamics to fuel changes in price. This makes significant volume increases the hallmark of any meaningful changes, first in interest, which results in higher volume, and second, in influencing sentiment with the end result being a change in price.
We consider volume increases over the moving average of volume (significant volume increases) to be such an important trading principal that the blue background flag it triggers is built into all other Genie Indicators.
Volume Price Projection was originally published in the Journal of Technical Analysis of Stocks and Commodities; Oct., 2017. by Michael Slattery.
Access this Genie indicator for your Tradingview account, through our web site. (Links Below) This will provide you with additional educational information and reference articles, videos, input and setting options and trading strategies this indicator excels in.
