Tỷ lệ thay đổi giá (ROC)
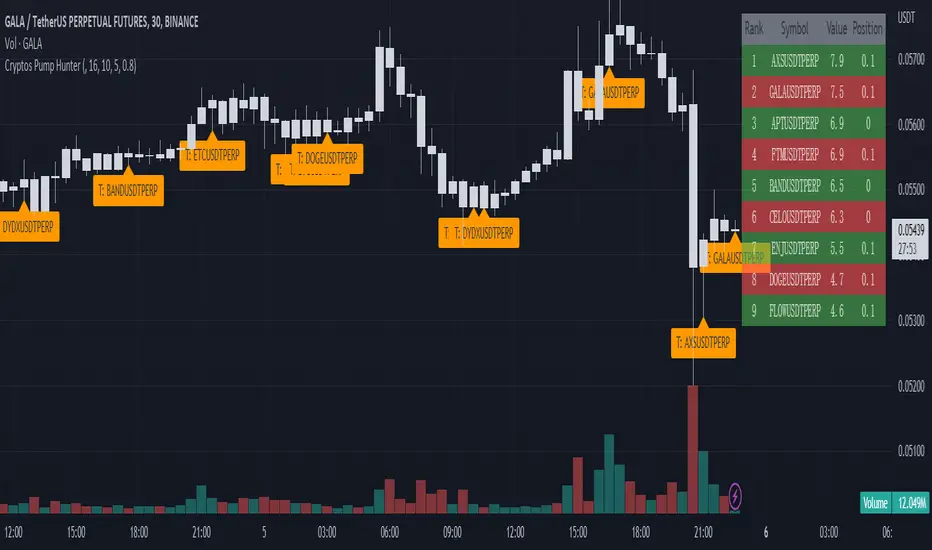
Cryptos Pump Hunter[liwei666]🔥 Cryptos Pump Hunter captured high volatility symbols in real-time, Up to 40 symbols can be monitored at same time.
Help you find the most profitable symbol with excellent visualization.
🔥 Indicator Design logic
🎯 The core pump/dump logic is quite simple
1. calc past bars highest and lowest High price, get movement by this formula
" movement = (highest - lowest) / lowest * 100 "
2. order by 'movement' value descending, you will get a volatility List
3. use Table tool display List, The higher the 'movement', the higher the ranking.
🔥 Settings
🎯 2 input properties impact on the results, 2 input impact on display effects, others look picture below.
pump_bars_cnt : lookback bar to calc pump/dump
resolution for pump : 1min to 1D
show_top1 : when ranking list top1 change, will draw a label
show pump : when symbol over threhold, draw a pump lable
🔥 How TO USE
🎯 only trade high volatility symbols
1. focus on top1 symbol on Table panel at top-right postion, trading symbols at label in chart.
2. Short when 'postion' ~ 0, Long when 'postion' ~ 1 on Table Cell
🎯 Monitor the symbols you like
1. 100+ symbols added in script, cancel remarks in code line if symbol is your want
2. add 1 line code if symbol not exist. if you want monitor 'ETHUSDTPERP ', then add
" ETHUSDTPERP = create_symbol_obj('BINANCE:ETHUSDTPERP'), array.unshift(symbol_a, ETHUSDTPERP ) "
🎯 Alert will be add soon, any questions or suggestion please comment below, I would appreciate it greatly.
Hope this indicator will be useful for you :)
enjoy! 🚀🚀🚀
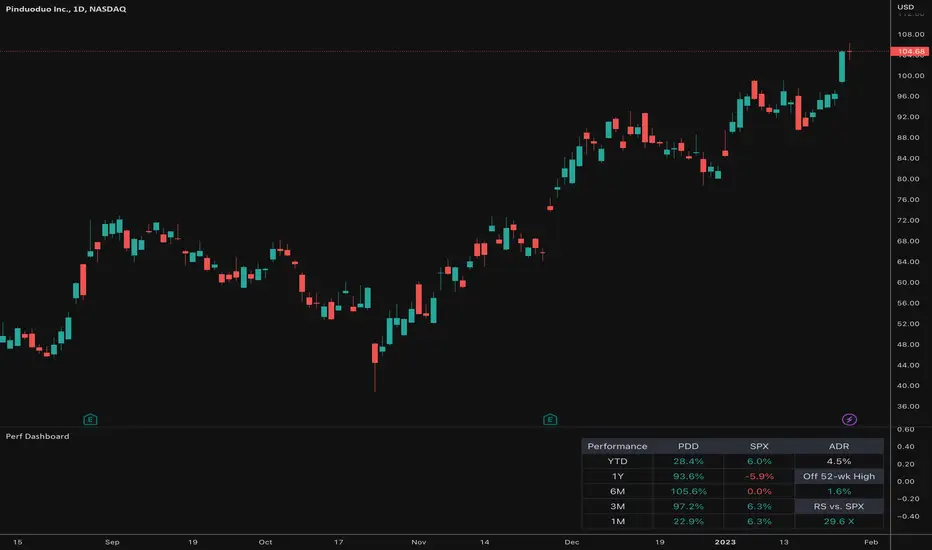
Relative Performance Dashboard v. 2This is a smaller and cleaner version of my previous Relative Performance table. It looks at the rate of change over 1M, 3M, 6M, 1YR & YTD and displays those for the current chart's ticker vs. an index/ticker of your choosing (SPX is default). I also have some fields for the ADR of the displayed chart, how far away the displayed chart is from 52-week highs, and a single number that compares the average relative strength of the displayed chart vs. the index. The way this average calculates is customizable by the user.
I like using this table next to an Earnings/Sales/Volume table that already exists by another user in the same pane and I designed this one so it can look just like that one to give a great view of the both fundamental and technical strength of your ticker in the same pane.
Keeping fundamental data independent from performance data allows you to still be able to see performance on things without fundamental data (i.e. ETFs, Indices, Crypto, etc.) as any script that uses fundamental data will not display when a chart that does not have fundamental data is displayed.
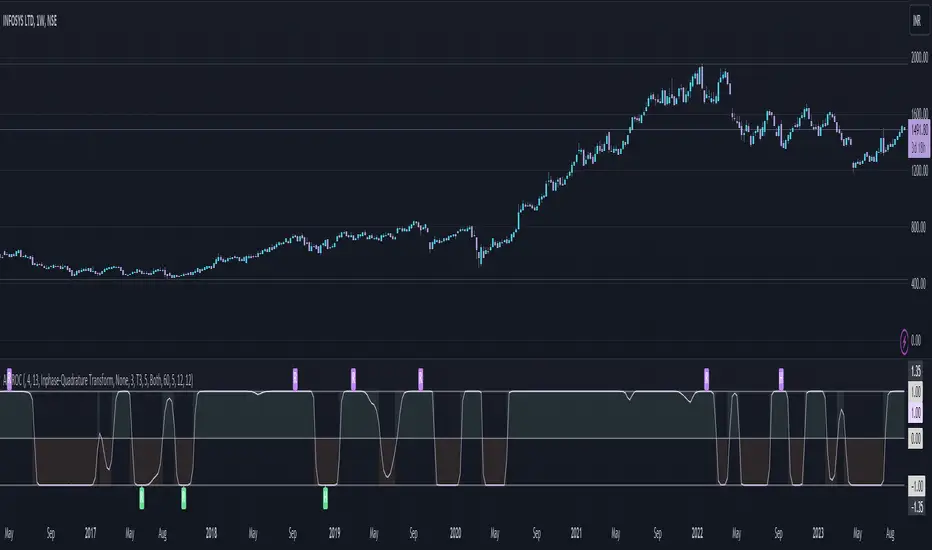
ROC (Rate of Change) Refurbished▮ Introduction
The Rate of Change indicator (ROC) is a momentum oscillator.
It was first introduced in the early 1970s by the American technical analyst Welles Wilder.
It calculates the percentage change in price between periods.
ROC takes the current price and compares it to a price 'n' periods (user defined) ago.
The calculated value is then plotted and fluctuates above and below a Zero Line.
A technical analyst may use ROC for:
- trend identification;
- identifying overbought and oversold conditions.
Even though ROC is an oscillator, it is not bounded to a set range.
The reason for this is that there is no limit to how far a security can advance in price but of course there is a limit to how far it can decline.
If price goes to $0, then it obviously will not decline any further.
Because of this, ROC can sometimes appear to be unbalanced.
(TradingView)
▮ Improvements
The following features were added:
1. Eight moving averages for the indicator;
2. Dynamic Zones;
3. Rules for coloring bars/candles.
▮ Motivation
Averages have been added to improve trend identification.
For finer tuning, you can choose the type of averages.
You can hide them if you don't need them.
The Dynamic Zones has been added to make it easier to identify overbought/oversold regions.
Unlike other oscillators like the RSI for example, the ROC does not have a predetermined range of oscillations.
Therefore, a fixed line that defines an overbought/oversold range becomes unfeasible.
It is in this matter that the Dynamic Zone helps.
It dynamically adjusts as the indicator oscillates.
▮ About Dynamic Zones
'Most indicators use a fixed zone for buy and sell signals.
Here's a concept based on zones that are responsive to the past levels of the indicator.'
The concept of Dynamic Zones was described by Leo Zamansky (Ph.D.) and David Stendahl, in the magazine of Stocks & Commodities V15:7 (306-310).
Basically, a statistical calculation is made to define the extreme levels, delimiting a possible overbought/oversold region.
Given user-defined probabilities, the percentile is calculated using the method of Nearest Rank.
It is calculated by taking the difference between the data point and the number of data points below it, then dividing by the total number of data points in the set.
The result is expressed as a percentage.
This provides a measure of how a particular value compares to other values in a data set, identifying outliers or values that are significantly higher or lower than the rest of the data.
▮ Thanks and Credits
- TradingView: for ROC and Moving Averages
- allanster: for Dynamic Zones

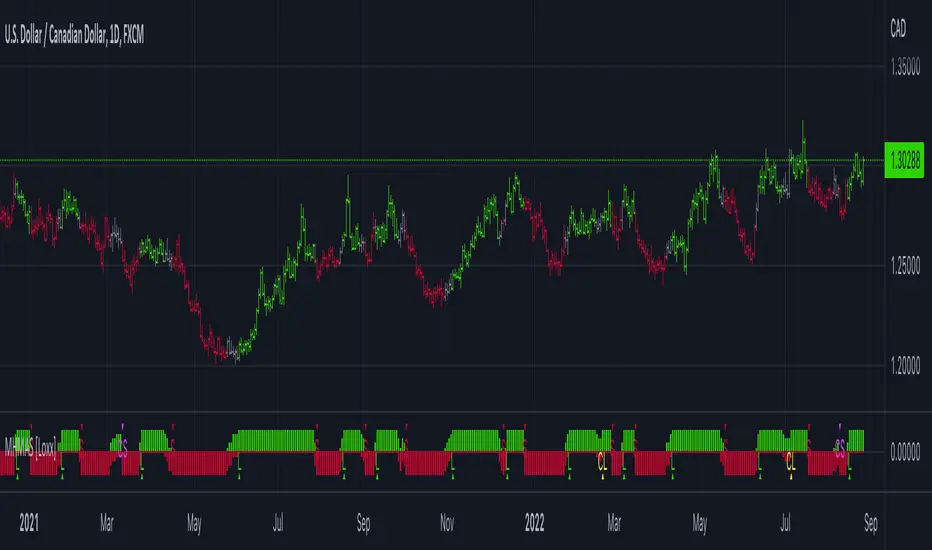
MATHR3E RAMP-MA█ OVERVIEW
MATHR3E RAMP-MA (R-MA) is a trend following indicator.
█ CONCEPTS
Disclaimer:
MATHR3E RAMP-MA indicator is intended for advanced traders and may fit your profile, whether you are a day trader or a long-term investor.
It was originally developed by a renowned market analyst and documented in numerous books. Among them is the author Jason Perl.
It is recommended to have read the trading techniques mentioned in the books covering this indicator beforehand.
How to use:
MATHR3E RAMP-MA is useful for determining if a market is trending and when so, to procure entry points to initiate a trade in line with the expected directional move.
It can be applied to markets as a stop-loss, as well as a low-risk entry qualifier in conjunction with other indicators of the same author.
Moving Average (R-MA I):
Only displayed when market is trending
• Bull trend: Green (moving avg Lows/Period)
• Bear trend: Red (moving avg Highs/Period)
Moving Average (R-MA II):
Always displayed
• Bullish outlook on the market: the 3-day moving average must be positioned above the 34-day moving average
• Bearish outlook on the market: the 3-day moving average must be positioned below the 34-day moving average
█ FEATURES & BENEFITS
Versatile:
This indicator is based on relative price action, so you can apply it to any market or time frame without having to change the default settings.
Rate of Change:
The ROC is calculated for the fast and slow periods of the R-MA (II).
R-MA (II) is colored blue when its rate of change is advancing and maroon when it is declining.
Breakout Qualifier:
A close above/below the moving average R-MA (I) that is confirmed by the following price bar's opening price
Materialized on chart with Flags:
• Green when bear trend ends
• Red when bull trend ends
Alerts
Get notified on:
• UpTrend breakout
• DnTrend breakout
• Any breakout Signal

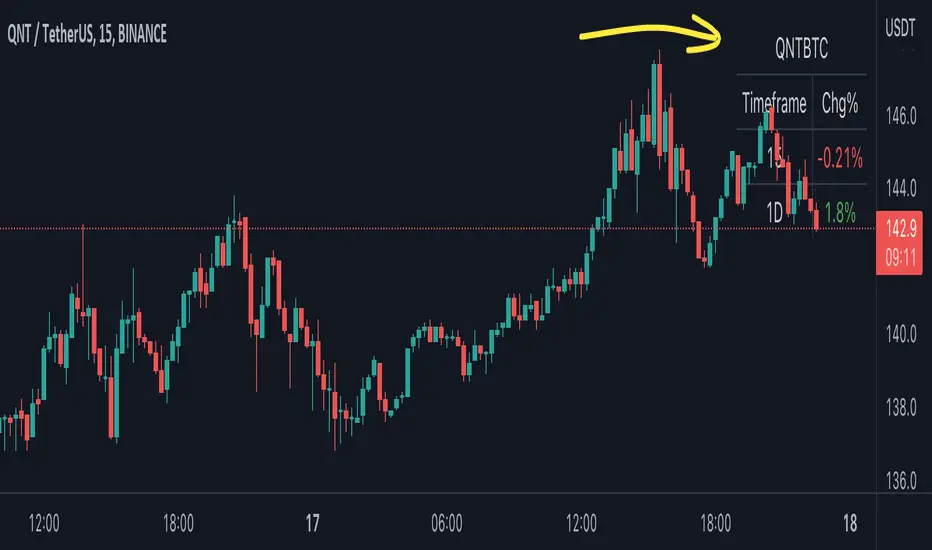
BTC Pair Change %This script makes it easier to quickly check how the BTC pair of the current symbol is performing on any pair.
It adds a " change percentage widge t" (of the BTC pair ) to the top right of the chart.
(Refer to the image for an example.)
The change percentage calculation is performed as described here:
www.tradingview.com
To match the "Chg%" that appears on TradingView watchlists, a 24H (1440min) timeframe is used, as described here:
money.stackexchange.com
In short, this script:
Searches for the BTC pair of the current symbol
Calculates the change % using the above described logic (links)
Adds a " change percentage widget " (of the BTC pair) to the top right of the chart
Allows for using 24H timeframe or the current timeframe (enable " Use current timeframe " under the script options)
Rate of Change Candle Standardized (ROCCS)ROCCS is a standardized rate of change oscillator with "error bars". Rate of change helps traders gauge momentum in a market by comparing the current price with the price "n" periods ago. What makes this special is you get to see the momentum of the momentum via the candle view. The candle transformation utilizes a moving average to smooth the signal however this is only used for the close price. The high and low prices are not smoothed. The moving average has an adjustable period, and so does the standardization.
I hope you can find great use in this upgraded roc indicator.

Adaptive Fisherized ROCIntroduction
Hello community, here I applied the Inverse Fisher Transform, Ehlers dominant cycle determination and smoothing methods on a simple Rate of Change (ROC) indicator
You have a lot of options to adjust the indicator.
Usage
The rate of change is most often used to measure the change in a security's price over time.
That's why it is a momentum indicator.
When it is positive, prices are accelerating upward; when negative, downward.
It is useable on every timeframe and could be a potential filter for you your trading system.
IMO it could help you to confirm entries or find exits (e.g. you have a long open, roc goes negative, you exit).
If you use a trend-following strategy, you could maybe look out for red zones in an in uptrend or green zones in a downtrend to confirm your entry on a pullback.
Signals
ROC above 0 => confirms bullish trend
ROC below 0 => confirms bearish trend
ROC hovers near 0 => price is consolidating
Enjoy! 🚀
[ChasinAlts] The Great Reset Hello fellow tradeurs, "The Great Reset" just tracks the % change of a coin. For whichever reset hour is chosen,
once the reset time is reached the % changes of all the coins reset to 0. This is great to find which coins have
been moving the most and to be able to see how all of them are moving compared to the rest. Once the reset interval
is up and the % change resets to 0, you can see the "*" at the end of the plots and if you hover over it the coin's
name is shown in a tooltip. Lastly, if a threshold of 5 is selected and alerts are also used then it will alert you at that % change
level as well as threshold*2 and threshold*3 so you can be notified if a coin is going on a tear and pumping through those % change
levels (the threshold, threshold*2, and threshold*3 levels are also printed as Hlines on the chart)
There is also the Printed Bar Filter to only show the coins that have been moving the most according to the values set in the filter
(if you choose to use/select to use the filter). This is the same filter on many of my other scripts so as not to
clutter up the chart with coins that have not been moving much. Hope it comes of some use to anyone.
Peace and love people...peace and love. -ChasinAlts

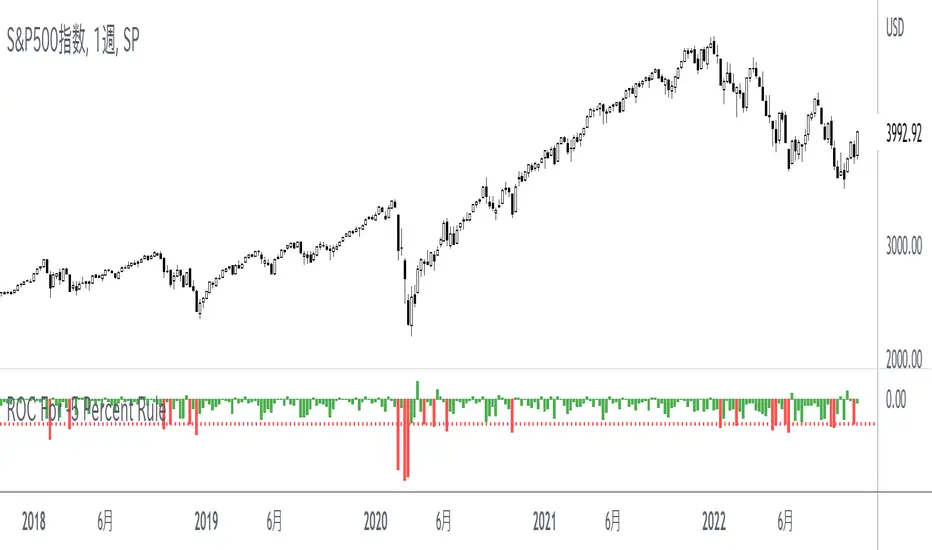
Performance Tablethis scrip is modified of Performance Table () of TradingView user @BeeHolder = Thank u very much.
-
@BeeHolder formula is based on daily basis,
but my calculation is based on respective day, week and month.
-
The formula of the calculation is (Current Close - Previous Close) * 100 / Previous Close, where Past value is:
1D = close 1 day before
5D = close 5 day before
1W - close 1 week before
4W = close 4 week before
1M - close 1 month before
3M - close 3 month before
6M - close 6 month before
12M - close 12 month before
52W - close 52 week before
Also table position cane be set.
thank you all
-

Crypto-DX Crypto Directional Index [chhslai]Crypto-DX can be used to help measure the overall strength and direction of the crypto market trend.
Furthermore, it can be used as a screener to find out cryptocurrencies which are accumulating momentum and tends to potentially pump or dump.
How this indicator works :
If the Crypto-DX cross above the zero-level, it could be an indication that there is a trend reversal into upward. You should close your short position or place a long order right away.
If the Crypto-DX cross below the zero-level, it could be an indication that there is a trend reversal into downward. You should close your long position or place a short order right away.
If the Crypto-DX is consolidated around the zero-level, it could be an indication that the trend may be ended and followed by a sideway market. You are suggested not to place any order and wait for the market moves.
Divergence based trading strategy is fully applicable, just like the MACD.
Screener features :
Plot "Crypto Index" and "5 Custom Crypto"
Plot "Crypto Index" and "Top 30 Crypto"

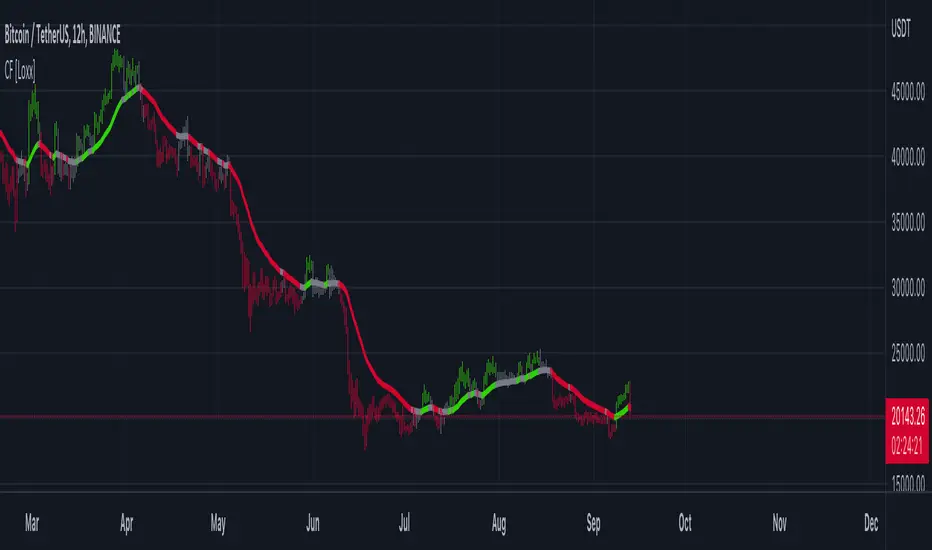
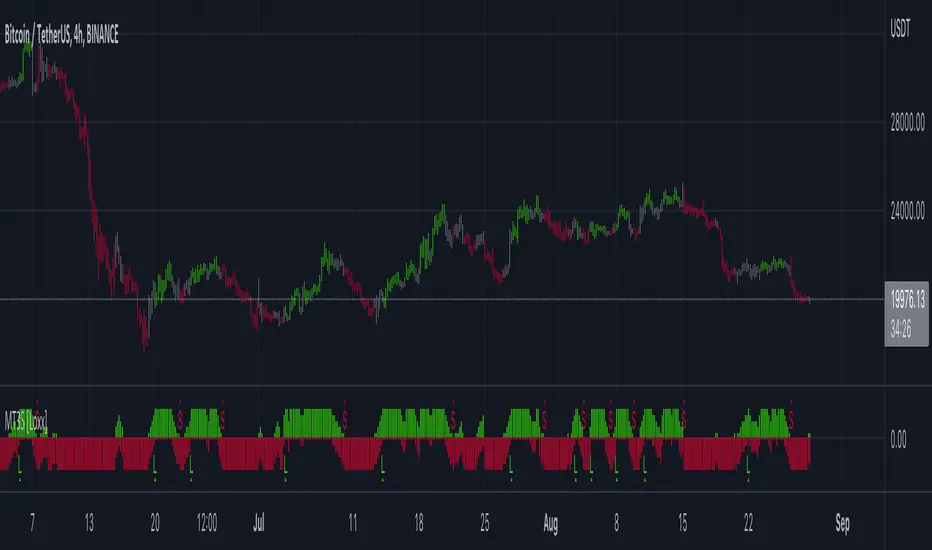
Clutter Fitler [Loxx]Clutter Fitler is a simple indicator to demonstrate a clutter filter. The purpose of this technique is to filter useless noise.
What is a Clutter Filter?
For our purposes here, this is a filter that compares the slope of the trading filter output to a threshold to determine whether to shift trends. If the slope is up but the slope doesn't exceed the threshold, then the color is gray and this indicates a chop zone. If the slope is down but the slope doesn't exceed the threshold, then the color is gray and this indicates a chop zone. Alternatively if either up or down slope exceeds the threshold then the trend turns green for up and red for down. Fro demonstration purposes, an EMA is used as the moving average. This filtering technique will be used for future indicators.
Included
Bar coloring
HMA Slope Variation [Loxx]HMA Slope Variation is an indicator that uses HMA moving average to calculate a slope that is then weighted to derive a signal.
The center line
The center line changes color depending on the value of the:
Slope
Signal line
Threshold
If the value is above a signal line (it is not visible on the chart) and the threshold is greater than the required, then the main trend becomes up. And reversed for the trend down.
Colors and style of the histogram
The colors and style of the histogram will be drawn if the value is at the right side, if the above described trend "agrees" with the value (above is green or below zero is red) and if the High is higher than the previous High or Low is lower than the previous low, then the according type of histogram is drawn.
What is the Hull Moving Average?
The Hull Moving Average ( HMA ) attempts to minimize the lag of a traditional moving average while retaining the smoothness of the moving average line. Developed by Alan Hull in 2005, this indicator makes use of weighted moving averages to prioritize more recent values and greatly reduce lag.
Included
Alets
Signals
Bar coloring
Loxx's Expanded Source Types

T3 Slope Variation [Loxx]T3 Slope Variation is an indicator that uses T3 moving average to calculate a slope that is then weighted to derive a signal.
The center line
The center line changes color depending on the value of the:
Slope
Signal line
Threshold
If the value is above a signal line (it is not visible on the chart) and the threshold is greater than the required, then the main trend becomes up. And reversed for the trend down.
Colors and style of the histogram
The colors and style of the histogram will be drawn if the value is at the right side, if the above described trend "agrees" with the value (above is green or below zero is red) and if the High is higher than the previous High or Low is lower than the previous low, then the according type of histogram is drawn.
What is the T3 moving average?
Better Moving Averages Tim Tillson
November 1, 1998
Tim Tillson is a software project manager at Hewlett-Packard, with degrees in Mathematics and Computer Science. He has privately traded options and equities for 15 years.
Introduction
"Digital filtering includes the process of smoothing, predicting, differentiating, integrating, separation of signals, and removal of noise from a signal. Thus many people who do such things are actually using digital filters without realizing that they are; being unacquainted with the theory, they neither understand what they have done nor the possibilities of what they might have done."
This quote from R. W. Hamming applies to the vast majority of indicators in technical analysis . Moving averages, be they simple, weighted, or exponential, are lowpass filters; low frequency components in the signal pass through with little attenuation, while high frequencies are severely reduced.
"Oscillator" type indicators (such as MACD , Momentum, Relative Strength Index ) are another type of digital filter called a differentiator.
Tushar Chande has observed that many popular oscillators are highly correlated, which is sensible because they are trying to measure the rate of change of the underlying time series, i.e., are trying to be the first and second derivatives we all learned about in Calculus.
We use moving averages (lowpass filters) in technical analysis to remove the random noise from a time series, to discern the underlying trend or to determine prices at which we will take action. A perfect moving average would have two attributes:
It would be smooth, not sensitive to random noise in the underlying time series. Another way of saying this is that its derivative would not spuriously alternate between positive and negative values.
It would not lag behind the time series it is computed from. Lag, of course, produces late buy or sell signals that kill profits.
The only way one can compute a perfect moving average is to have knowledge of the future, and if we had that, we would buy one lottery ticket a week rather than trade!
Having said this, we can still improve on the conventional simple, weighted, or exponential moving averages. Here's how:
Two Interesting Moving Averages
We will examine two benchmark moving averages based on Linear Regression analysis.
In both cases, a Linear Regression line of length n is fitted to price data.
I call the first moving average ILRS, which stands for Integral of Linear Regression Slope. One simply integrates the slope of a linear regression line as it is successively fitted in a moving window of length n across the data, with the constant of integration being a simple moving average of the first n points. Put another way, the derivative of ILRS is the linear regression slope. Note that ILRS is not the same as a SMA ( simple moving average ) of length n, which is actually the midpoint of the linear regression line as it moves across the data.
We can measure the lag of moving averages with respect to a linear trend by computing how they behave when the input is a line with unit slope. Both SMA (n) and ILRS(n) have lag of n/2, but ILRS is much smoother than SMA .
Our second benchmark moving average is well known, called EPMA or End Point Moving Average. It is the endpoint of the linear regression line of length n as it is fitted across the data. EPMA hugs the data more closely than a simple or exponential moving average of the same length. The price we pay for this is that it is much noisier (less smooth) than ILRS, and it also has the annoying property that it overshoots the data when linear trends are present.
However, EPMA has a lag of 0 with respect to linear input! This makes sense because a linear regression line will fit linear input perfectly, and the endpoint of the LR line will be on the input line.
These two moving averages frame the tradeoffs that we are facing. On one extreme we have ILRS, which is very smooth and has considerable phase lag. EPMA has 0 phase lag, but is too noisy and overshoots. We would like to construct a better moving average which is as smooth as ILRS, but runs closer to where EPMA lies, without the overshoot.
A easy way to attempt this is to split the difference, i.e. use (ILRS(n)+EPMA(n))/2. This will give us a moving average (call it IE /2) which runs in between the two, has phase lag of n/4 but still inherits considerable noise from EPMA. IE /2 is inspirational, however. Can we build something that is comparable, but smoother? Figure 1 shows ILRS, EPMA, and IE /2.
Filter Techniques
Any thoughtful student of filter theory (or resolute experimenter) will have noticed that you can improve the smoothness of a filter by running it through itself multiple times, at the cost of increasing phase lag.
There is a complementary technique (called twicing by J.W. Tukey) which can be used to improve phase lag. If L stands for the operation of running data through a low pass filter, then twicing can be described by:
L' = L(time series) + L(time series - L(time series))
That is, we add a moving average of the difference between the input and the moving average to the moving average. This is algebraically equivalent to:
2L-L(L)
This is the Double Exponential Moving Average or DEMA , popularized by Patrick Mulloy in TASAC (January/February 1994).
In our taxonomy, DEMA has some phase lag (although it exponentially approaches 0) and is somewhat noisy, comparable to IE /2 indicator.
We will use these two techniques to construct our better moving average, after we explore the first one a little more closely.
Fixing Overshoot
An n-day EMA has smoothing constant alpha=2/(n+1) and a lag of (n-1)/2.
Thus EMA (3) has lag 1, and EMA (11) has lag 5. Figure 2 shows that, if I am willing to incur 5 days of lag, I get a smoother moving average if I run EMA (3) through itself 5 times than if I just take EMA (11) once.
This suggests that if EPMA and DEMA have 0 or low lag, why not run fast versions (eg DEMA (3)) through themselves many times to achieve a smooth result? The problem is that multiple runs though these filters increase their tendency to overshoot the data, giving an unusable result. This is because the amplitude response of DEMA and EPMA is greater than 1 at certain frequencies, giving a gain of much greater than 1 at these frequencies when run though themselves multiple times. Figure 3 shows DEMA (7) and EPMA(7) run through themselves 3 times. DEMA^3 has serious overshoot, and EPMA^3 is terrible.
The solution to the overshoot problem is to recall what we are doing with twicing:
DEMA (n) = EMA (n) + EMA (time series - EMA (n))
The second term is adding, in effect, a smooth version of the derivative to the EMA to achieve DEMA . The derivative term determines how hot the moving average's response to linear trends will be. We need to simply turn down the volume to achieve our basic building block:
EMA (n) + EMA (time series - EMA (n))*.7;
This is algebraically the same as:
EMA (n)*1.7-EMA( EMA (n))*.7;
I have chosen .7 as my volume factor, but the general formula (which I call "Generalized Dema") is:
GD (n,v) = EMA (n)*(1+v)-EMA( EMA (n))*v,
Where v ranges between 0 and 1. When v=0, GD is just an EMA , and when v=1, GD is DEMA . In between, GD is a cooler DEMA . By using a value for v less than 1 (I like .7), we cure the multiple DEMA overshoot problem, at the cost of accepting some additional phase delay. Now we can run GD through itself multiple times to define a new, smoother moving average T3 that does not overshoot the data:
T3(n) = GD ( GD ( GD (n)))
In filter theory parlance, T3 is a six-pole non-linear Kalman filter. Kalman filters are ones which use the error (in this case (time series - EMA (n)) to correct themselves. In Technical Analysis , these are called Adaptive Moving Averages; they track the time series more aggressively when it is making large moves.
Included
Alets
Signals
Bar coloring
Loxx's Expanded Source Types

Multi HMA Slopes [Loxx]Multi HMA Slopes is an indicator that checks slopes of 5 (different period) Hull Moving Averages and adds them up to show overall trend. To us this, check for color changes from red to green where there is no red if green is larger than red and there is no red when red is larger than green. When red and green both show up, its a sign of chop.
What is the Hull Moving Average?
The Hull Moving Average (HMA) attempts to minimize the lag of a traditional moving average while retaining the smoothness of the moving average line. Developed by Alan Hull in 2005, this indicator makes use of weighted moving averages to prioritize more recent values and greatly reduce lag.
Included
Signals: long, short, continuation long, continuation short.
Alerts
Bar coloring
Loxx's expanded source types
Multi T3 Slopes [Loxx]Multi T3 Slopes is an indicator that checks slopes of 5 (different period) T3 Moving Averages and adds them up to show overall trend. To us this, check for color changes from red to green where there is no red if green is larger than red and there is no red when red is larger than green. When red and green both show up, its a sign of chop.
What is the T3 moving average?
Better Moving Averages Tim Tillson
November 1, 1998
Tim Tillson is a software project manager at Hewlett-Packard, with degrees in Mathematics and Computer Science. He has privately traded options and equities for 15 years.
Introduction
"Digital filtering includes the process of smoothing, predicting, differentiating, integrating, separation of signals, and removal of noise from a signal. Thus many people who do such things are actually using digital filters without realizing that they are; being unacquainted with the theory, they neither understand what they have done nor the possibilities of what they might have done."
This quote from R. W. Hamming applies to the vast majority of indicators in technical analysis . Moving averages, be they simple, weighted, or exponential, are lowpass filters; low frequency components in the signal pass through with little attenuation, while high frequencies are severely reduced.
"Oscillator" type indicators (such as MACD , Momentum, Relative Strength Index ) are another type of digital filter called a differentiator.
Tushar Chande has observed that many popular oscillators are highly correlated, which is sensible because they are trying to measure the rate of change of the underlying time series, i.e., are trying to be the first and second derivatives we all learned about in Calculus.
We use moving averages (lowpass filters) in technical analysis to remove the random noise from a time series, to discern the underlying trend or to determine prices at which we will take action. A perfect moving average would have two attributes:
It would be smooth, not sensitive to random noise in the underlying time series. Another way of saying this is that its derivative would not spuriously alternate between positive and negative values.
It would not lag behind the time series it is computed from. Lag, of course, produces late buy or sell signals that kill profits.
The only way one can compute a perfect moving average is to have knowledge of the future, and if we had that, we would buy one lottery ticket a week rather than trade!
Having said this, we can still improve on the conventional simple, weighted, or exponential moving averages. Here's how:
Two Interesting Moving Averages
We will examine two benchmark moving averages based on Linear Regression analysis.
In both cases, a Linear Regression line of length n is fitted to price data.
I call the first moving average ILRS, which stands for Integral of Linear Regression Slope. One simply integrates the slope of a linear regression line as it is successively fitted in a moving window of length n across the data, with the constant of integration being a simple moving average of the first n points. Put another way, the derivative of ILRS is the linear regression slope. Note that ILRS is not the same as a SMA ( simple moving average ) of length n, which is actually the midpoint of the linear regression line as it moves across the data.
We can measure the lag of moving averages with respect to a linear trend by computing how they behave when the input is a line with unit slope. Both SMA (n) and ILRS(n) have lag of n/2, but ILRS is much smoother than SMA .
Our second benchmark moving average is well known, called EPMA or End Point Moving Average. It is the endpoint of the linear regression line of length n as it is fitted across the data. EPMA hugs the data more closely than a simple or exponential moving average of the same length. The price we pay for this is that it is much noisier (less smooth) than ILRS, and it also has the annoying property that it overshoots the data when linear trends are present.
However, EPMA has a lag of 0 with respect to linear input! This makes sense because a linear regression line will fit linear input perfectly, and the endpoint of the LR line will be on the input line.
These two moving averages frame the tradeoffs that we are facing. On one extreme we have ILRS, which is very smooth and has considerable phase lag. EPMA has 0 phase lag, but is too noisy and overshoots. We would like to construct a better moving average which is as smooth as ILRS, but runs closer to where EPMA lies, without the overshoot.
A easy way to attempt this is to split the difference, i.e. use (ILRS(n)+EPMA(n))/2. This will give us a moving average (call it IE /2) which runs in between the two, has phase lag of n/4 but still inherits considerable noise from EPMA. IE /2 is inspirational, however. Can we build something that is comparable, but smoother? Figure 1 shows ILRS, EPMA, and IE /2.
Filter Techniques
Any thoughtful student of filter theory (or resolute experimenter) will have noticed that you can improve the smoothness of a filter by running it through itself multiple times, at the cost of increasing phase lag.
There is a complementary technique (called twicing by J.W. Tukey) which can be used to improve phase lag. If L stands for the operation of running data through a low pass filter, then twicing can be described by:
L' = L(time series) + L(time series - L(time series))
That is, we add a moving average of the difference between the input and the moving average to the moving average. This is algebraically equivalent to:
2L-L(L)
This is the Double Exponential Moving Average or DEMA , popularized by Patrick Mulloy in TASAC (January/February 1994).
In our taxonomy, DEMA has some phase lag (although it exponentially approaches 0) and is somewhat noisy, comparable to IE /2 indicator.
We will use these two techniques to construct our better moving average, after we explore the first one a little more closely.
Fixing Overshoot
An n-day EMA has smoothing constant alpha=2/(n+1) and a lag of (n-1)/2.
Thus EMA (3) has lag 1, and EMA (11) has lag 5. Figure 2 shows that, if I am willing to incur 5 days of lag, I get a smoother moving average if I run EMA (3) through itself 5 times than if I just take EMA (11) once.
This suggests that if EPMA and DEMA have 0 or low lag, why not run fast versions (eg DEMA (3)) through themselves many times to achieve a smooth result? The problem is that multiple runs though these filters increase their tendency to overshoot the data, giving an unusable result. This is because the amplitude response of DEMA and EPMA is greater than 1 at certain frequencies, giving a gain of much greater than 1 at these frequencies when run though themselves multiple times. Figure 3 shows DEMA (7) and EPMA(7) run through themselves 3 times. DEMA^3 has serious overshoot, and EPMA^3 is terrible.
The solution to the overshoot problem is to recall what we are doing with twicing:
DEMA (n) = EMA (n) + EMA (time series - EMA (n))
The second term is adding, in effect, a smooth version of the derivative to the EMA to achieve DEMA . The derivative term determines how hot the moving average's response to linear trends will be. We need to simply turn down the volume to achieve our basic building block:
EMA (n) + EMA (time series - EMA (n))*.7;
This is algebraically the same as:
EMA (n)*1.7-EMA( EMA (n))*.7;
I have chosen .7 as my volume factor, but the general formula (which I call "Generalized Dema") is:
GD (n,v) = EMA (n)*(1+v)-EMA( EMA (n))*v,
Where v ranges between 0 and 1. When v=0, GD is just an EMA , and when v=1, GD is DEMA . In between, GD is a cooler DEMA . By using a value for v less than 1 (I like .7), we cure the multiple DEMA overshoot problem, at the cost of accepting some additional phase delay. Now we can run GD through itself multiple times to define a new, smoother moving average T3 that does not overshoot the data:
T3(n) = GD ( GD ( GD (n)))
In filter theory parlance, T3 is a six-pole non-linear Kalman filter. Kalman filters are ones which use the error (in this case (time series - EMA (n)) to correct themselves. In Technical Analysis , these are called Adaptive Moving Averages; they track the time series more aggressively when it is making large moves.
Included
Signals: long, short, continuation long, continuation short.
Alerts
Bar coloring
Loxx's expanded source types
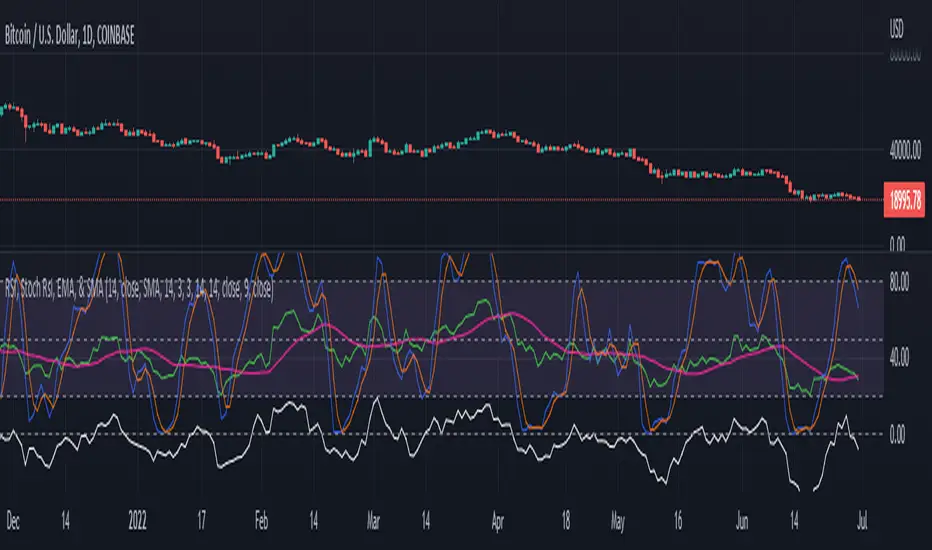
RSI, Stoch Rsi, EMA, SMA, & ROCThis indicator is simply an enhanced version of the RSI followed up by a few extra indicators that pair strongly with the RSI. This indicator allows the user to interact with various inputs based off the indicators provided. All indicators include moving average, relative strength index, stochastic relative strength index, simple moving average, exponential moving average, and rate of change. This program is unique as it is very versatile allowing the user to use as little or as many indicators as needed interchangeably.
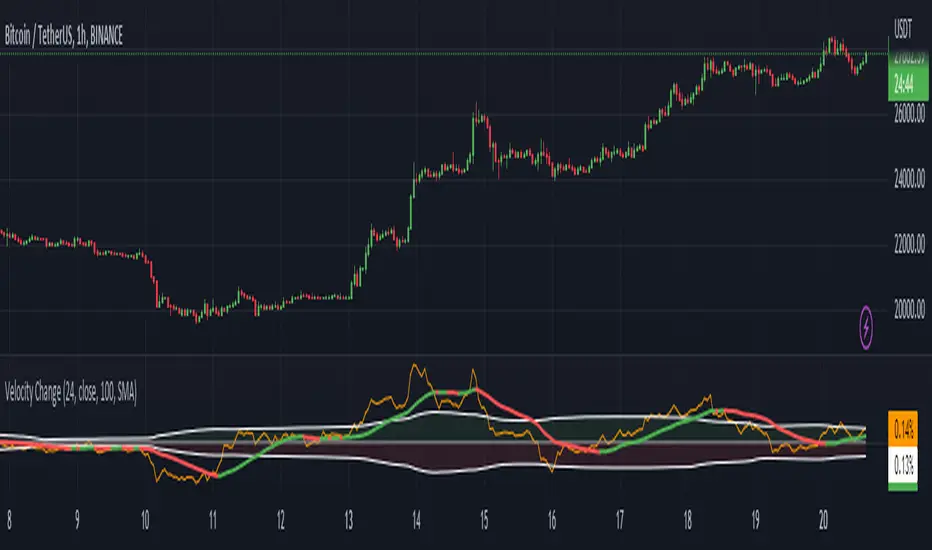
Multi-timeframe MomentumThe Multi-timeframe momentum indicator is similar in concept to a velocity indicator like rate-of-change, but visualizes smoothed price changes by applying an EMA and linear regression to price difference at every bar. Momentums from 1 minute to 1 quarter are plotted on a single chart using the request.security function. Standard and Fibonacci timeframes are available as well as the ability to hide high-timeframes to keep the chart clean. Like any oscillator, divergence in the momentums can be used to identify price reversals in conjunction with support and resistance. When linear regression is applied, high and low inflection points are used to identify reversals in a manner similar to MACD.
Much love to DumpCap! The script is presented sans secret sauce.

ToleranceThis indicator measures the Tolerance in the price, it works on all timeframes,
The main goal actually was to indicate the undefined trend zones like when the price is squeezed, the indicator value will be very close to zero (at this zone you should not place any orders)
But also the moving averages may give a good signals on the indicator, crossing up moving average indicate a long signal, you may need aid of other indicators to make sure this zone is long before going long in a bullish trap!

Simple Percentage Change IndicatorFeatures:
- Shows % change per Bar.
- Shows countdown per bar.
- Shows Day, Month, and Yearly % Change in Bottom Right Corner.

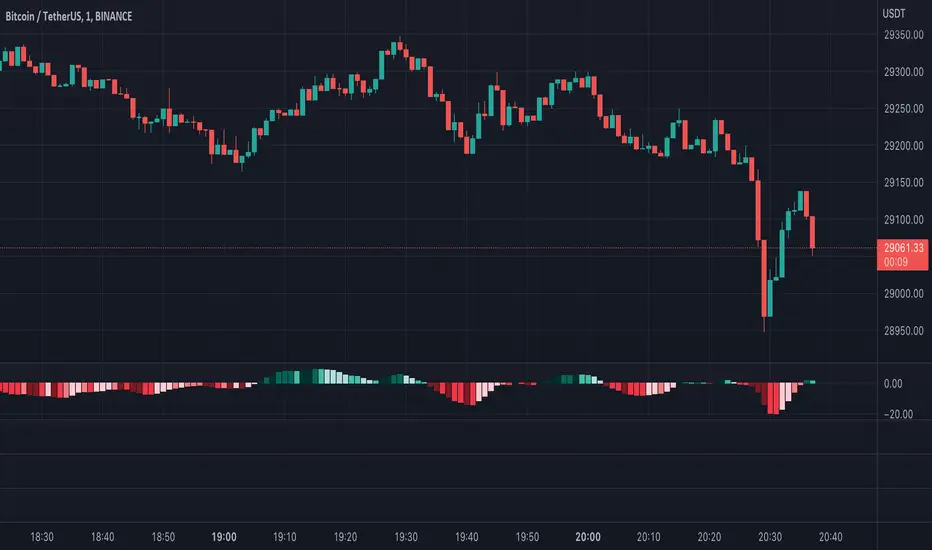
Moving Average Convergence Divergence with Rate of Change
Purpose - MACD is an awesome indicator. However, I felt I could improve the existing MACD indicator by also letting it visualize the rate of change (ROC) of the histogram (whether rate of change is increasing or decreasing - just like a derivative). By doing so, the indicator will better show the rate of change of the trend.
How It's Done - To the original MACD indicator, I have added a bit more conditional statements that automatically calculates the ROC in MACD histogram and visualizes through 8 different colors.
Interpretation - While the histogram is above 0, darker color indicates the stronger up trend, and lighter the color, weaker the up trend and potentially indicates the bears are overtaking, and vice versa for the case where the histogram is below 0.
Pchange10xModified version of pchange NM, changed to 10x
Plots the percentage change of one data point to the next
