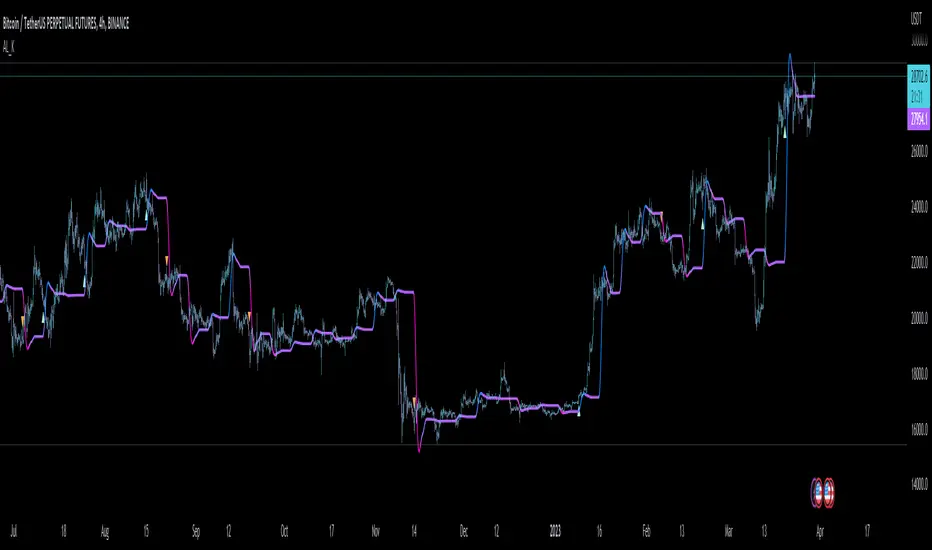
Isotonic Regression [LuxAlgo]The Isotonic Regression indicator provides a monotonic fit to price data, ensuring the resulting line is either non-decreasing or non-increasing over a specified lookback period. This tool is particularly useful for identifying underlying trends and significant price plateaus without the lagging or "overshooting" common in standard moving averages or linear regressions.
Note: This indicator calculates its values based on a historical lookback window, which means the regression line will repaint as new bars are added and the window shifts.
🔶 USAGE
Isotonic regression is used to find the best-fitting line to a set of data points under the constraint that the line must move in a specific direction (always up or always down). This creates a "staircase" effect where the model alternates between trending segments and flat plateaus.
🔹 Direction Modes
The indicator offers three ways to determine the fit direction:
Auto: Automatically detects the trend by comparing the start and end prices of the lookback period. If the end price is higher, it fits a non-decreasing line; otherwise, it fits a non-increasing line.
Non-Decreasing: Forces the fit to only move upwards or stay flat, ideal for analyzing bullish structures.
Non-Increasing: Forces the fit to only move downwards or stay flat, ideal for analyzing bearish structures.
🔹 Flat Period Extensions
One of the most powerful features of isotonic regression is the identification of "blocks" or price levels where the trend pauses. When the duration of such a plateau exceeds the Flat Period Threshold , the indicator extends a dashed horizontal line to the current bar, highlighting potential support or resistance levels derived from the regression model.
🔶 DETAILS
The script implements the Pool Adjacent Violators Algorithm (PAVA) , which is the standard method for computing isotonic regression.
The algorithm works by partitioning the data into "blocks." If a subsequent data point violates the monotonicity constraint (e.g., price drops in a "non-decreasing" fit), the algorithm pools the current block with the previous one and calculates a weighted average. This process repeats until the entire sequence is monotonic.
For performance efficiency, the indicator utilizes the polyline.new() function to render the regression line as a single continuous object rather than hundreds of individual line segments.
🔶 SETTINGS
Lookback Length: The number of bars used to calculate the isotonic fit.
Source: The price data used for the calculation (default is Close).
Direction: Sets the monotonicity constraint (Auto, Non-Decreasing, or Non-Increasing).
Flat Period Threshold: The minimum number of bars a price plateau must last to be highlighted with an extension line.
🔹 Style
Fit Bullish/Bearish: Colors for the regression line based on the detected trend.
Fit Style/Width: Controls the visual representation (Solid, Dashed, Dotted) and thickness of the main regression line.
Ext Bullish/Bearish: Colors for the flat period extension levels.
Ext Style/Width: Controls the visual representation and thickness of the plateau extensions.
Chỉ báo Pine Script®