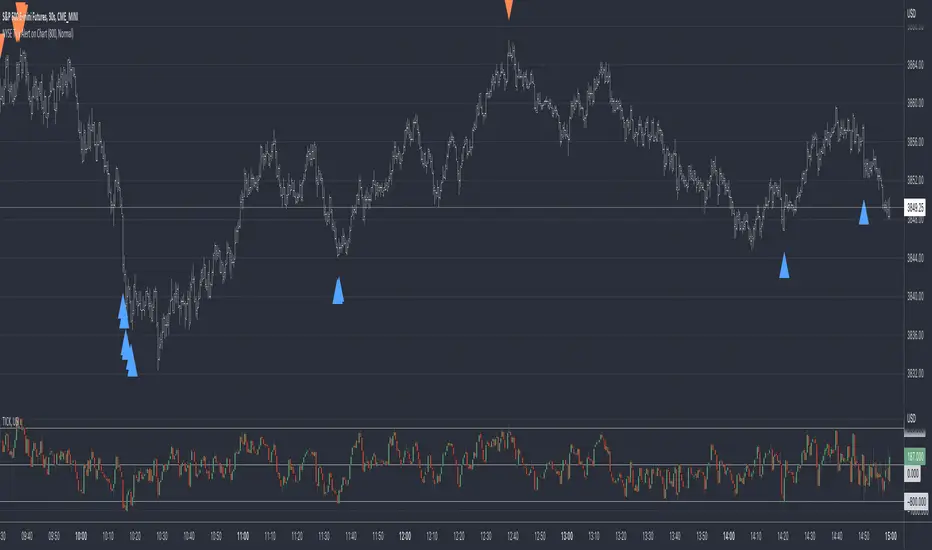
Hi traders , this is lonelygrass again 😄, and I am going to show what you don't often see out there and share it with you. This indicator is called "s&p 500 sector strength index"😎 , which allows you to distinguish strengths and weaknesses between different sectors in s&p500, and to create meaningful trading frameworks around it. Similar to the RSI indicator ,...
Generates buy or sell signal if monthly candle closes above or below the signal MA. Long positions only. Inputs: -Change timeframe MA -Change period MA -Use SMA or EMA -Display MA -Use another ticker as signal -Select time period for backtesting This script is not necessarily written to maximize profits, but to minimize losses. Although it can outperform 'Buy &...
This indicator shows 1 and 2 standard deviation price move from the VWAP based on VIX. Implied Volatility (IV) is being used extensively in the Option world to project the Expected Move for the underlying instrument. VIX is used as a proxy for SPY's IV for 30 days. This indicator is meaningful only for SPY but can be used in any other instrument which has a...
I am going to start taking requests to open source my indicators and they will also be updated to Version 4 of Pinescript. I added some features to the original code such the ability to smooth the oscillator and select the look back periods for the historical volatility. Link to original: Original post: "The idea for this started here: www.tradingview.com...
This script plot a NYSE ADVANCING DECLINING VOLUME LINE on a WMA histogram of SPY. Very new at coding pine script, so use at your own risk
I found this useful tool among the indicators but it wasn't doing the correlation study correctly. Everything in markets, with only a few exceptions, are rising in value over time and therefore trended to time. The simplest method I found is to use link relative or first difference detrending, before calculating a correlation between assets. I also updated it to...
The entry and exit levels here are NOT derived from any specific indicator but are coming from our A.I. driven proprietary models. This is an attempt at exploring the trading community here at TradingView and sharing our daily trading plans published at our site with the community here in the form a Pine Script - just starting and learning this platform. Please...
Colors background green if AMEX:SPY 1 day performance is positive Colors background red if AMEX:SPY 1 day performance is negative
This indicator is based on Volatility and Market Sentiment. When volatility is high, and market sentiment is positive, the indicator is in a low or 'buy state'. When volatility is low and market sentiment is poor, the indicator is high. The indicator uses the VIX as it's volatility input. The indicator uses the spread between the Call Volume on SPX/SPY and the...
An update to: Made it into and indicator. v. 0.0.1 DESIGNED FOR DAILY CHARTS
Works best as an intraday indicator Background black & line green = Long VIX Background black & red line = No trade Background orange & line green = Consider selling Background orange & line red = Short VIX
I updated this version used for Forex with Stock&Index related instruments. Enjoy.
Please do read the information below as well, especially if you are new to Forex. The Cowabunga System is a type of Mechanical Trading System that filters trades based on the trend of the 4 hour chart with EMAs and some other familiar indicators (RSI, Stochastics and MACD) while entering trades base on 15 minute chart. I have coded (quite amateurishly) the basic...
This strategy was designed to be traded on daily data on the ES and SPY—the strategy was originally developed for NinjaTrader, which displays daily ES data based on RTH hours instead of 24 hours (1440 minute) like TradingView does, so we are presenting the results on the SPY until we figure out how to overcome this hurdle. The strategy combines the two ideas from...
This strategy was designed to be traded on daily data on the ES and SPY—the strategy was originally developed for NinjaTrader, which displays daily ES data based on RTH hours instead of 24 hours (1440 minute) like TradingView does, so we are presenting the results on the SPY until we figure out how to overcome this hurdle. Strategy #02 Quantity 100 Slippage:...
The strategy was designed to be traded based on daily data on the ES and SPY--the strategy was originally developed on NinjaTrader using approximately 50% out of sample data with a slippage of 1 tick on the ES. This is our first strategy that we converted from NinjaTrader to TradingView, so if you see any issues with our conversion, please let us know as we are...
this script marks off the extended hours trading for NY session. Shades the off hours and overnight data. Highlights the regular trading session for NY session. It can be adjusted for any particular market. I use it specifically to show the missing data on the SPY as compared with the continuous data on the SPX500.
These Bollinger bands feature Fibonacci retracements to very clearly show areas of support and resistance. The basis is calculate off of the Volume Weighted Moving Average. The Bands are 3 standard deviations away from the mean. 99.73% of observations should be in this range.