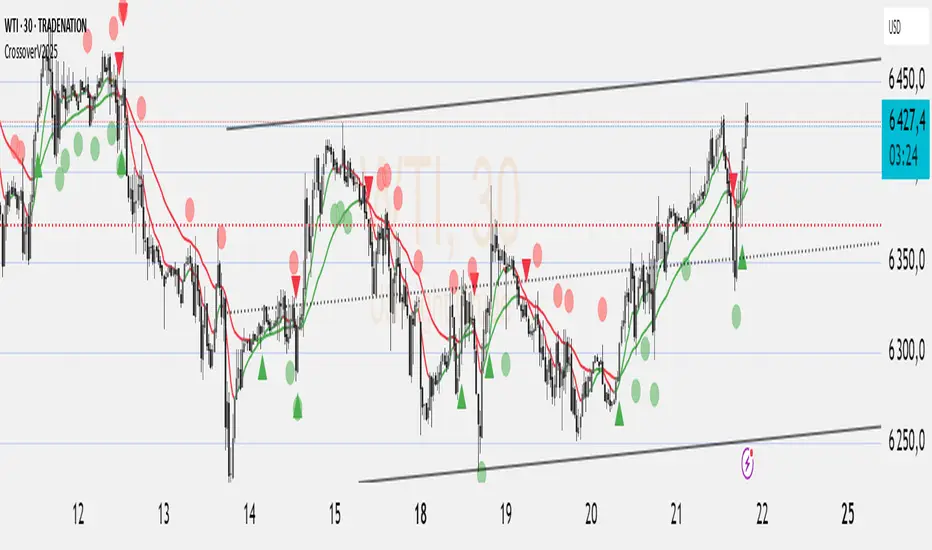
NeoChartLabs EMAsOne of our Favorite Indicators - the NeoChart Labs 20/50/100/200 EMAs
20 = Blue and very thin
50 = Orange and thin
100 = Purple and thick
200 = White and very thick
When 20 Crosses above and below any other expect action.
50 crossing 200 on the 1D is the death cross.
Shout out to drsweets for the original script
Exponentialmovingaverages

Alper-EMAAlper-EMA
Description:
This indicator allows you to display 5 customizable EMAs (Exponential Moving Averages) on a single chart. Each EMA can be configured independently with length, color, visibility, and calculation timeframe.
Features:
5 fully customizable EMAs
Set individual length and color for each EMA
Toggle visibility for each EMA
Multi-timeframe calculation: e.g., display EMA300 calculated on a 30-minute timeframe while viewing a 1-minute chart
Labels display EMA period and timeframe for clarity
Adjustable label size: tiny / small / normal / large
Clear and readable plot lines
Use Cases:
Monitor multiple timeframe EMAs simultaneously
Analyze trend and support/resistance levels
Track EMA crossovers for strategy development
Note:
This indicator is suitable for both short-term (scalping) and medium-to-long term analysis. The multi-timeframe feature allows you to see different EMA perspectives on a single chart quickly.

paigep.llc - SuperMA
SuperMA is a multi-layered moving-average and candle-coloring system that combines SMA, EMA, and optional HMA logic to help traders visualize trend shifts, pullbacks, and momentum changes in a clean, structured way.
The script includes multiple modules: trend-based moving averages, pullback signals, exit logic, and an optional HMA cross engine.
📌 Core Features
1. Full SMA + EMA Framework
The indicator plots multiple moving averages (8, 9, 13, 20, 50, 200) using both SMA and EMA calculations. Each line automatically colors bullish or bearish based on its relationship to the 200-period baseline. Users can toggle SMAs and EMAs independently for clearer chart control.
2. Main Trend Entry & Exit Logic (8×200 and 8×20)
Built-in crossover logic detects:
Main Entry: SMA 8 crossing above/below EMA 200
Main Exit: SMA 8 and SMA 20 cross (with an option to choose which SMA is treated as the “fast” leg)
A “first exit only” option allows the script to ignore additional exit signals until a new trend regime begins.
3. Pullback Module (20 SMA Interaction)
Pullback entries and exits occur when price crosses the 20 SMA during existing trend conditions.
This includes:
Pullback entries through the 20 SMA
Pullback exits back across the 20 SMA
Labels and candle colors are available for all pullback events.
4. Optional HMA Cross Module
A separate module allows traders to use two Hull Moving Averages (HMA) with customizable:
Lengths
Independent timeframes
Line colors
Cross-based entries and exits
This module has its own events, labels, and optional candle coloring.
5. Advanced Candle Coloring System
Candle coloring is layered in priority order, based on:
Main trend entries
Main exits
HMA entries
HMA exits
Pullback entries
Pullback exits
Trend-only candles (based on SMA 8 relative to EMA 200)
Users may also independently color wicks and borders.
6. Configurable Alerts (Fully Decoupled from Visuals)
Alerts are available for all major events, including:
Main Entries (8×200)
Main Exits (8×20)
Pullback Entries and Exits
HMA Entries and Exits
Bull or Bear Trend candles
Any colored candle event
Alerts can fire on bar close only or intrabar, depending on user preference.
Use Cases
SuperMA helps traders visualize:
Trend direction using SMA/EMA structure
Momentum shifts through HMA crosses
Pullback zones around the 20 SMA
Early regime transitions based on the 8×200 relationship
Candle-level context through color-coded bars
The indicator works across all markets and timeframes.
⚠️ Note
This tool is for visual and analytical assistance only. It does not guarantee future performance and should be combined with additional analysis and risk management.

TradeScope: MA Reversion • RVOL • Trendlines • GAPs • TableTradeScope is an all-in-one technical analysis suite that brings together price action, momentum, volume dynamics, and trend structure into one cohesive and fully customizable indicator.
An advanced, modular trading suite that combines moving averages, reversion signals, RSI/CCI momentum, relative volume, gap detection, trendline analysis, and dynamic tables — all within one powerful dashboard.
Perfect for swing traders, intraday traders, and analysts who want to read price strength, volume context, and market structure in real time.
⚙️ Core Components & Inputs
🧮 Moving Average Settings
Moving Average Type & Length:
Choose between SMA or EMA and set your preferred period for smoother or more reactive trend tracking.
Multi-MA Plotting:
Up to 8 customizable moving averages (each with independent type, color, and length).
Includes a “window filter” to show only the last X bars, reducing chart clutter.
MA Reversion Engine:
Detects when price has extended too far from its moving average.
Reversion Lookback: Number of bars analyzed to determine historical extremes.
Reversion Threshold: Sensitivity multiplier—lower = more frequent signals, higher = stricter triggers.
🔄 Trend Settings
Short-Term & Long-Term Trend Lookbacks:
Uses linear regression to detect the slope and direction of the short- and long-term trend.
Results are displayed in the live table with color-coded bias:
🟩 Bullish | 🟥 Bearish
📈 Momentum Indicators
RSI (Relative Strength Index):
Adjustable period; displays the current RSI value, overbought (>70) / oversold (<30) zones, and trending direction.
CCI (Commodity Channel Index):
Customizable length with color-coded bias:
🟩 Oversold (< -100), 🟥 Overbought (> 100).
Tooltip shows whether the CCI is trending up or down.
📊 Volume Analysis
Relative Volume (RVOL):
Estimates end-of-day projected volume using intraday progress and compares it against the 20-day average.
Displays whether today’s volume is expected to exceed yesterday’s, and highlights color by strength.
Volume Trend (Short & Long Lookbacks):
Visual cues for whether current volume is above or below short-term and long-term averages.
Estimated Full-Day Volume & Multiplier:
Converts raw volume into “X” multiples (e.g., 2.3X average) for quick interpretation.
🕳️ Gap Detection
Automatically identifies and plots bullish and bearish price gaps within a defined lookback period.
Gap Lookback: Defines how far back to search for gaps.
Gap Line Width / Visibility: Controls the thickness and display of gap lines on chart.
Displays the closest open gap in the live table, including its distance from current price (%).
🔍 ATR & Volatility
14-day ATR (% of price):
Automatically converts the Average True Range into a percent, providing quick volatility context:
🟩 Low (<3%) | 🟨 Moderate (3–5%) | 🟥 High (>5%)
💬 Candlestick Pattern Recognition
Auto-detects popular reversal and continuation patterns such as:
Bullish/Bearish Engulfing
Hammer / Hanging Man
Shooting Star / Inverted Hammer
Doji / Harami / Kicking / Marubozu / Morning Star
Each pattern is shown with contextual color coding in the table.
🧱 Pivot Points & Support/Resistance
Optional Pivot High / Pivot Low Labels
Adjustable left/right bar lengths for pivot detection
Theme-aware text and label color options
Automatically drawn diagonal trendlines for both support and resistance
Adjustable line style, color, and thickness
Detects and tracks touches for reliability
Includes breakout alerts (with optional volume confirmation)
🚨 Alerts
MA Cross Alerts:
Triggers when price crosses the fast or slow moving average within a tolerance band (default ±0.3%).
Diagonal Breakout Alerts:
Detects and alerts when price breaks diagonal trendlines.
Volume-Confirmed Alerts:
Filters breakouts where volume exceeds 1.5× the 20-bar average.
🧾 Live Market Table
A fully dynamic table displayed on-chart, customizable via input toggles:
Choose which rows to show (e.g., RSI, ATR, RVOL, Gaps, CCI, Trend, MA info, Diff, Low→Close%).
Choose table position (top-right, bottom-left, etc.) and text size.
Theme selection: Light or Dark
Conditional background colors for instant visual interpretation:
🟩 Bullish or Oversold
🟥 Bearish or Overbought
🟨 Neutral / Moderate
🎯 Practical Uses
✅ Identify confluence setups combining MA reversion, volume expansion, and RSI/CCI extremes.
✅ Track trend bias and gap proximity directly in your dashboard.
✅ Monitor relative volume behavior for intraday strength confirmation.
✅ Automate MA cross or breakout alerts to stay ahead of key price action.
🧠 Ideal For
Swing traders seeking confluence-based setups
Intraday traders monitoring multi-factor bias
Analysts looking for compact market health dashboards
💡 Summary
TradeScope is designed as a single-pane-of-glass market view — combining momentum, trend, volume, structure, and reversion into one clear visual system.
Fully customizable. Fully dynamic.
Use it to see what others miss — clarity, confluence, and confidence in every trade.

Trend Pro V2 [CRYPTIK1]Introduction: What is Trend Pro V2?
Welcome to Trend Pro V2! This analysis tool give you at-a-glance understanding of the market's direction. In a noisy market, the single most important factor is the dominant trend. Trend Pro V2 filters out this noise by focusing on one core principle: trading with the primary momentum.
Instead of cluttering your chart with confusing signals, this indicator provides a clean, visual representation of the trend, helping you make more confident and informed trading decisions.
The dashboard provides a simple, color-coded view of the trend across multiple timeframes.
The Core Concept: The Power of Confluence
The strength of any trading decision comes from confluence—when multiple factors align. Trend Pro V2 is built on this idea. It uses a long-term moving average (200-period EMA by default) to define the primary trend on your current chart and then pulls in data from three higher timeframes to confirm whether the broader market agrees.
When your current timeframe and the higher timeframes are all aligned, you have a state of "confluence," which represents a higher-probability environment for trend-following trades.
Key Features
1. The Dynamic Trend MA:
The main moving average on your chart acts as your primary guide. Its color dynamically changes to give you an instant read on the market.
Teal MA: The price is in a confirmed uptrend (trading above the MA).
Pink MA: The price is in a confirmed downtrend (trading below the MA).
The moving average changes color to instantly show you if the trend is bullish (teal) or bearish (pink).
2. The Multi-Timeframe (MTF) Trend Dashboard:
Located discreetly in the bottom-right corner, this dashboard is your window into the broader market sentiment. It shows you the trend status on three customizable higher timeframes.
Teal Box: The trend is UP on that timeframe.
Pink Box: The trend is DOWN on that timeframe.
Gray Box: The price is neutral or at the MA on that timeframe.
How to Use Trend Pro V2: A Simple Framework
Step 1: Identify the Primary Trend
Look at the color of the MA on your chart. This is your starting point. If it's teal, you should generally be looking for long opportunities. If it's pink, you should be looking for short opportunities.
Step 2: Check for Confluence
Glance at the MTF Trend Dashboard.
Strong Confluence (High-Probability): If your main chart shows an uptrend (Teal MA) and the dashboard shows all teal boxes, the market is in a strong, unified uptrend. This is a high-probability environment to be a buyer on dips.
Weak or No Confluence (Caution Zone): If your main chart shows an uptrend, but the dashboard shows pink or gray boxes, it signals disagreement among the timeframes. This is a sign of market indecision and a lower-probability environment. It's often best to wait for alignment.
Here, the daily trend is down, but the MTF dashboard shows the weekly trend is still up—a classic sign of weak confluence and a reason for caution.
Best Practices & Settings
Timeframe Synergy: For best results, use Trend Pro on a lower timeframe and set your dashboard to higher timeframes. For example, if you trade on the 1-hour chart, set your MTF dashboard to the 4-hour, 1-day, and 1-week.
Use as a Confirmation Tool: Trend Pro V2 is designed as a foundational layer for your analysis. First, confirm the trend, then use your preferred entry method (e.g., support/resistance, chart patterns) to time your trade.
This is a tool for the community, so feel free to explore the open-source code, adapt it, and build upon it. Happy trading!
For your consideration @TradingView

Volume Weighted EMAsIt's a script to calculate the volume weighted moving averages using exponential moving averages such as EMA, DEMA and TEMA instead of the pre-existing VWMA which uses SMA to calculate it.
Note: works only with charts that have volume data present, obviously !!!

EMA Trend Dashboard
Trend Indicator using 3 custom EMA lines. Displays a table with 5 rows(position configurable)
-First line shows relative position of EMA lines to each other and outputs Bull, Weak Bull, Flat, Weak Bear, or Bear. EMA line1 should be less than EMA line2 and EMA line 2 should be less than EMA line3. Default is 9,21,50.
-Second through fourth line shows the slant of each EMA line. Up, Down, or Flat. Threshold for what is considered a slant is configurable. Also added a "steep" threshold configuration for steep slants.
-Fifth line shows exhaustion and is a simple, configurable calculation of the distance between EMA line1 and EMA line2.
--Lines one and five change depending on its value but ALL other colors are able to be changed.
--Default is somewhat set to work well with Micro E-mini Futures but this indicator can be changed to work on anything. I created it to help get a quick overview of short-term trend on futures. I used ChatGPT to help but I am still not sure if it actually took longer because of it.

Super MTF Clouds (4x3 Pairs)Overview:
This script is based on Ripster's MTF clouds, which transcends the standard moving average cloud indicator by offering a powerful and deeply customizable Multi-Timeframe (MTF) analysis. Instead of being limited to the moving averages of your current charts from the current timeframe, this tool allows you to project and visualize the trend and key support/resistance zones from up to 4 different timeframes simultaneously. User can input up to 6 different EMA values which will form 3 pairs of EMA clouds, for each of the timeframes.
The primary purpose is to provide traders with immediate confluence. By observing how price interacts with moving average clouds from higher timeframes (e.g., Hourly, Daily, Weekly), you can make more informed decisions on your active trading timeframe (e.g., 10 Minute). It's designed as a complete MTF Cloud toolkit, allowing you to display all necessary MTFs in a single script to build a comprehensive view of the market structure without having to flick to different timeframe to look for cloud positions.
Key features:
Four Independent Multi-Timeframe Slots: Each slot can be assigned any timeframe available on TradingView (e.g., D, W, M, 4H).
Three MA Pairs Per Timeframe: For each timeframe, configure up to three separate MA clouds (e.g., a 9/12 EMA pair, a 20/50 EMA pair, and a 100/200 SMA pair).
Complete Customisation: For every single moving average (24 in total), you can independently control:
MA Type: Choose between EMA or SMA.
Length: Any period you require.
Line Color: Full colour selection.
Line Thickness: Adjust the visual weight of each line.
Cloud Control: For every pair (12 in total), you can set the fill colour and transparency.
How To Use This Script:
This tool is best used for confirmation and context. Here are some practical strategies that one can adopt:
Trend Confluence: Before taking a trade based on a signal on your current timeframe, glance at the higher timeframe clouds. If you see a buy signal on the 15-minute chart and the price is currently trading above a thick, bullish Daily cloud, the probability of that trade succeeding is significantly higher. Conversely, shorting into strong HTF support is a low-probability trade.
Dynamic Support & Resistance: The edges of the higher timeframe clouds often act as powerful, dynamic levels of support and resistance. A pullback to the 4-Hour 50 EMA on your 15-minute chart can be a prime area to look for entries in the direction of the larger trend.
Gauging Market Regimes: Use the toggles in the settings to quickly switch between different views. You can have a "risk-on" view with short-term clouds and a "macro" view with weekly and monthly clouds. This helps you adapt your trading style to the current market conditions.
Key Settings:
1. Global Setting
Source For All MAs: This determines the price data point used for every single moving average calculation.
Default: hl2 (an average of the High and Low of each bar). This gives a smooth midpoint price.
Options: You can change this to Close (the most common method), Open, High, Low, or ohlc4 (an average of the open, high, low, and close), among others.
Recommendation: For most standard trend analysis, the default hl2 is the common choice.
2. The Timeframe Group Structure
The rest of the settings are organized into four identical, collapsible groups: "Timeframe 1 Settings" through "Timeframe 4 Settings". Each group acts as a self-contained control panel for one multi-timeframe view.
Within each timeframe group, you have two master controls:
Enable Timeframe: This is the main power switch for the entire group. Uncheck this box to instantly hide all three clouds and lines associated with this timeframe. This is perfect for quickly decluttering your chart or focusing on a different set of analyses.
Timeframe: This dropdown menu is the heart of the MTF feature. Here, you select the higher timeframe you want to analyse (e.g., 1D for Daily, 1W for Weekly, 4H for 4-Hour). All calculations for the three pairs within this group will be based on the timeframe you select here.
3. Pair-Specific Controls
Inside each timeframe group, there are three sections for "Pair 1", "Pair 2", and "Pair 3". These control each individual moving average cloud.
Enable Pair: Just like the master switch for the timeframe, this checkbox turns a single cloud and its two MA lines on or off.
For each pair, the settings are further broken down:
Moving Average Lines (A and B): These two rows control the two moving averages that form the cloud. 'A' is typically used for the shorter-period MA and 'B' for the longer-period one.
Type (A/B): A dropdown menu to select either EMA (Exponential Moving Average) or SMA (Simple Moving Average). EMAs react more quickly to recent price changes, while SMAs are smoother and react more slowly.
Length (A/B): The lookback period for the moving average (e.g., 21, 50, 200).
Color (A/B): Sets the specific colour of the MA line itself on your chart.
Cloud Fill Settings
Fill Color: This controls the colour of the shaded area (the "cloud") between the two moving average lines. For a consistent look, you can set this to the same colour as your shorter MA line.
Transparency: Controls how see-through the cloud is, on a scale of 0 to 100. 0 is a solid, opaque colour, while 100 is completely invisible. The default of 85 provides a light, "cloud-like" appearance that doesn't obscure the price action.
----------------------------------------------------------------------
If anything is not clear please let me know!

Quad Rotation StochasticQuad Rotation Stochastic
The Quad Rotation Stochastic is a powerful and unique momentum oscillator that combines four different stochastic setups into one tool, providing an incredibly detailed view of market conditions. This multi-timeframe stochastic approach helps traders better anticipate trend continuations, reversals, and momentum shifts with greater precision than traditional single stochastic indicators.
Why this indicator is useful:
Multi-layered Momentum Analysis: Instead of relying on one stochastic, this script tracks four independent stochastic readings, smoothing out noise and confirming stronger signals.
Advanced Divergence Detection: It automatically identifies bullish and bearish divergences for each stochastic, helping traders spot potential reversals early.
Background Color Alerts: When a configurable number (e.g., 3 or 4) of the stochastics agree in direction and position (overbought/oversold), the background colors green (bullish) or red (bearish) to give instant visual cues.
ABCD Pattern Recognition: The script recognizes "shield" patterns when Stochastic 4 remains stuck at extreme levels (above 90 or below 10) for a set time, warning of potential trend continuation setups.
Super Signal Alerts: If all four stochastics align in extreme conditions and slope in the same direction, the indicator plots a special "Super Signal," offering high-confidence entry opportunities.
Why this indicator is unique:
Quad Confirmation Logic: Combining four different stochastics makes this tool much less prone to false signals compared to using a single stochastic.
Customizable Divergence Coloring: Traders can choose to have divergence lines automatically match the stochastic color for clear visual association.
Adaptive ABCD Shields: Innovative use of bar counting while a stochastic remains extreme acts as a "shield," offering a unique way to filter out minor fake-outs.
Flexible Configuration: Each stochastic's sensitivity, divergence settings, and visual styling can be fully customized, allowing traders to adapt it to their own strategy and asset.
Example Usage: Trading Bitcoin with Quad Rotation Stochastic
When trading Bitcoin (BTCUSD), you might set the minimum count (minCount) to 3, meaning three out of four stochastics must be in agreement to trigger a background color.
If the background turns green, and you notice an ABCD Bullish Shield (Green X), you might look for bullish candlestick patterns or moving average crossovers to enter a long trade.
Conversely, if the background turns red and a Super Down Signal appears, it suggests high probability for further downside, giving you strong confirmation to either short BTC or avoid entering new longs.
By combining divergence signals with background colors and the ABCD shields, the Quad Rotation Stochastic provides a layered confirmation system that gives traders greater confidence in their entries and exits — particularly in fast-moving, volatile markets like Bitcoin.

Forward-Backward Exponential Oscillator [LuxAlgo]The Forward-Backward Exponential Oscillator is a normalized oscillator able to estimate directional shifts by making use of a unique "Forward-Backward Filtering" calculation method for Exponential Moving Averages (EMAs).
This unique method provides a smooth normalized representation of the price with reduced lag.
🔶 USAGE
The oscillator consists of 2 series of values derived from normalizing the sum of each EMA's change across the selected user lookback window (length), one less reactive computed forward (in grey), and the other re-calculated backward for each bar (in blue).
Given this "Forward-Backwards" calculation method, we are able to produce a more reactive oscillator compared to the same operation done on a simple double-smoothed EMA.
The interaction between these 2 values (Forward Value and Backward Value) can highlight shifts in market momentum over time.
When the Forward Value is above the Backward Value, the price is seen moving up, and likewise, when the Forward EMA is below, the Backward EMA price is seen moving down.
The indicator specifically displays the difference between values through a histogram located at the 50 mark on the oscillator.
🔹 Projection
We project the approximated future values of the forward value in front of the current line. This helps show the data that is being used for the creation of the Forward Value.
🔹 Length & Smoothing
The Smoothing Input controls the length of the EMAs which are analyzed.
The Length Input controls the lookback for the sum of changes from the EMAs.
Displayed below is a comparison of varying input sizes and their results.
As seen above:
A larger length input will result in slower, gradual movement by the oscillator since the summed values are from a larger lookback.
A higher smoothing setting will result in smoother EMAs, leading to a smoother oscillator output that is less contaminated by noisy variations.
Note: The length of the projection is tied to the "length" input, to get a longer projection, a larger length is required.
🔶 DETAILS
Forward-backward filtering is a method applied to LTI (linear time-invariant) filters to provide a filter response with zero-phase shift, this has the visible effect of shifting a regular causal filter response to the right, making it appear has have effectively 0 lag.
The name of this operation indicates that the filter is first calculated forward over a series of values (like regular moving averages), then calculated backward, using the previous output as input for the filter, effectively applying the filter twice.
While this operation effectively allows us to obtain a zero-lag response when applied to an EMA, it is subject to repainting, as this indicator only returns the normalized sum of changes of the forward-backward EMA, which does not introduce any repainting behaviors in the final output of the oscillator.
🔶 SETTINGS
Length: Change the calculation lookback length for the oscillator.
Smoothing: Alter the smoothness of the back-end EMA calculations.
Source: Change the source input used for the indicator.

BullDozz MA-CandlesticksBullDozz MA-Candlesticks 🏗️📊
The BullDozz MA-Candlesticks indicator transforms traditional candlesticks by replacing their Open, High, Low, and Close values with various types of Moving Averages (MAs). This helps traders visualize market trends with smoother price action, reducing noise and enhancing decision-making.
🔹 Features:
✅ Choose from multiple MA types: SMA, EMA, WMA, DEMA, TEMA, LSMA
✅ Customizable MA period for flexibility
✅ Candlestick colors based on trend: Green for bullish, Red for bearish
✅ Works on any market and timeframe
This indicator is perfect for traders who want a clearer perspective on price movement using moving average-based candlesticks. 🚀 Try it now and refine your market analysis! 📈🔥

Crossover EMMMCrossover EMMM is an indicator that displays the Madrid Moving Averages (EMMM) and detects crossovers (upward crossings) and crossunders (downward crossings) between two moving averages. It uses two input parameters to define the fast and slow EMMM lengths. The script calculates the EMMM values, their changes, and assigns colors based on the change direction. The fast EMMM is plotted in green or red, and the slow EMMM is plotted in blue or red, depending on the change direction. The script also displays triangle shapes below or above the bars to indicate crossovers and crossunders.
The "Madrid Moving Average" (EMMMM) is a type of moving average used in technical analysis to smooth price fluctuations of financial assets, such as stocks or currency pairs. Unlike the Simple Moving Average (SMA), which treats all data equally, the EMMM gives more weight to recent data. This results in the EMMM responding more swiftly to price changes, making it well-suited for identifying short-term trends.
Custom EMA from X Days AgoThis is an indicator to plot the selected EMA value from X days ago on today's candle.
Or it will helps to plot the previous candle's EMA value on current candle.
LNL Trend SystemLNL Trend System is an ATR based day trading system specifically designed for intra-day traders and scalpers. The System works on any chart time frame & can be applied to any market. The study consist of two components - the Trend Line and the Stop Line. Trend System is based on a special ATR calculation that is achieved by combining the previous values of the 13 EMA in relation to the ATR which creates a line of deviations that visually look similar to the basic moving average but actually produce very different results ESPECIALLY in sideways market.
Trend Line:
Trend Line is a simple line which is basically a fast gauge represented by the 13 EMA that can change the color based on the current trend structure defined by multiple averages (8,13,21,34 EMAs). Trend Line is there to simply add the confluence for the current trend. Colors of the line are pretty much self-explanatory. Whenever the line turns red it states that the current structure is bearish. Vice versa for green line. Gray line represents neutral market structure.
Stop Line:
Stop Line is an ATR deviaton line with special calculation based on the previous bar ATRs and position of the price in relation to the current and previous values of 13 EMA. As already stated, this creates an ATR deviation marker either above or below the price that trails the price up or down until they touch. Whenever the price comes into the Stop Line it means it is making an ATR expansion move up or down .This touch will usually resolve into a reaction (a bounce) which provides trade opportunities.
Trend Bars:
When turned ON, Trend Bars can provide additional confulence of the current trend alongside with the Trend Line color. Trend Bars are based on the DMI and ADX indicators. Whenever the DMI is bearish and ADX is above 20 the candles paint themselfs red. And vice versa applies for the green candles and bullish DMI. Whenever the ADX falls below the 20, candles are netural (Gray) which means there is no real trend in place at the moment.
Trend Mode:
There are total of 5 different trend modes available. Each mode is visualizing different ATR settings which provides either aggressive or more conservative approach. The more tigher the mode, the more closer the distance between the price and the Stop Line. First two modes were designed for slower markets, whereas the "Loose" and "FOMC" modes are more suitable for products with high volatility.
Trend Modes:
1. Tight
Ideal for the slowest markets. Slowest market can be any market with unusually small average true range values or just simply a market that does have a personality of a "sleeper". Tight Mode can be also used for aggresive entries in the most ridiculous trends. Sometimes price will barely pullback to the Trend Line not even the Stop Line.
2. Normal
Normal Mode is the golden mean between the modes. "Normal" provides the ideal ATR lengths for the most used markets such as S&P Futures (ES) or SPY, AAPL and plenty of other highly popular stocks. More often than not, the length of this mode is respected considering there is no breaking news or high impact market event scheduled.
3. Loose
The "Loose" mode is basically a normal mode but a little bit more loose. This mode is useful whenever the ATRs jump higher than usual or during the days of highly anticipated news events. This mode is also better suited for more active markets such as NQ futures.
4. FOMC
The FOMC mode is called FOMC for a reason. This mode provides the maximum amount of wiggle room between the price and the Stop Line. This mode was designed for the extreme volatility, breaking news events or post-FOMC trading. If the market quiets down, this mode will not get the Stop Line touch as frequently as othete modes, thus it is not very useful to run this on markets with the average volatlity. Although never properly tested, perhaps the FOMC mode can find its value in the crypto market?
5. The Net
The net mode is basically a combination of all modes into one stop line system which creates "the net" effect. The Net provides the widest Stop Line zone which can be mainly appreciated by traders that like to use scale-in scale-out methods for their trading. Not to mention the visual side of the indicator which looks pretty great with the net mode on.
HTF (Higher Time Frame) Trend System:
The system also includes additional higher time frame (HTF) trend system. This can be set to any time frame by manual HTF mode. HTF mode set to "auto" will automatically choose the best suitable higher time frame trend system based on how appropriate the aggregation is. For everything below 5min the HTF Trend System will stay on 5min. Anything between 5-15min = 30min. 30min - 120min will turn on the 240min. 180min and higher will result in Daily time frame. Anything above the Daily will result in Weekly HTF aggregation, above W = Monthly, above M = Quarterly.
Background Clouds:
In terms of visualization, each trend system is fully customizable through the inputs settings. There is also an option to turn on/off the background clouds behind the stop lines. These clouds can make the charts more clean & visible.
Tips & Tricks:
1. Different Trend Modes
Try out different modes in different markets. There is no one single mode that will fit to everyone on the same type of market. I myself actually prefer more Loose than the Normal.
2. Stop Line Mirroring
Whenever the Stop Lines start to mirror each other (there is one above the price and one below) this means the price is entering a ranging sideways market. It does not matter which Stop Line will the price touch first. They can both be faded until one of them flips.
3. Signs of the Ranging Market
Watch out for signs of ranging market. Whenever the Trend System looses its colors whether on trend line or trend bars, if everything turns neutral (gray) that is usually a solid indication of a range type action for the following moments. Also as already stated before, the Stop Line mirroring is a good sign of the range market.
4. Trailing Tool, Trend System as an Additional Study?
In case you are not a fan of the colorful green / red charts & candles. You can switch all of them off and just leave the Stop Line on. This way you can use the benefits of the trend system and still use other studies on top of that. Similarly as the Parabolic SAR is often used.
5. The Flip Setup
One of my favorite trades is the Flip Setup on the 5min charts. Whenever the Stop Line is broken , the very first opposing touch after the Trend System flips is a usually a highly participated touch. If there is a strong reaction, this means this is likely a beginning of a new trend. Once I am in the position i like to trail the Stop Line on the 1min charts.
Hope it helps.

All in One EMA indicator with Average EMA Calculations The Indicator displays multiple exponential moving averages (EMAs) on the chart. The six available options will let you adjust and set ]exponential moving averages ( EMAS) as per your choice. Additionally I have added an Average ema which will calculate the average of all the emas that you have selected. This average ema works very strong and greatly to find potential zone of dynamic supports and resistance as well as to gauge the overall trend .. The average ema will also allow you to keep your chart clean and you wont have to add too many emas together.
The average of the selected EMAs are displayed as a single line. This helps identify trends and potential reversals in the market. i hope this indicator will help you with trading...
Plz use the chart BINANCE:LINKBTC as reference, for back testing and educational purposes only.
Thumbs up if you liked the script.
Happy trading..

RSI Exponential Smoothing (Expo)█ Background information
The Relative Strength Index (RSI) and the Exponential Moving Average (EMA) are two popular indicators. Traders use these indicators to understand market trends and predict future price changes. However, traders often wonder which indicator is better: RSI or EMA.
What if these indicators give similar results? To find out, we wanted to study the relationship between RSI and EMA. We focused on a hypothesis: when the RSI goes above 50, it might be similar to the price crossing above a certain length of EMA. Similarly, when the RSI goes below 50, it might be similar to the price crossing below a certain length of EMA.
Our goal was simple: to figure out if there is any connection between RSI and EMA.
Conclusion: Yes, it seems that there is a correlation between RSI and EMA, and this indicator clearly displays that relationship. Read more about the study here:
█ Overview of the indicator
The RSI Exponential Smoothing indicator displays RSI levels with clear overbought and oversold zones, shown as easy-to-understand moving averages, and the RSI 50 line as an EMA. Another excellent feature is the added FIB levels. To activate, open the settings and click on "FIB Bands." These levels act as short-term support and resistance levels which can be used for scalping.
█ Benefits of using this indicator instead of regular RSI
The findings about the Relative Strength Index (RSI) and the Exponential Moving Average (EMA) highlight that both indicators are equally accurate (when it comes to crossings), meaning traders can choose either one without compromising accuracy. This empowers traders to pick the indicator that suits their personal preferences and trading style.
█ How it works
Crossings over/under the value of 50
The EMA line in the indicator acts as the corresponding 50 line in the RSI. When the RSI crosses the value 50 equals when Close crosses the EMA line.
Bouncess from the value 50
In this example, we can see that the EMA line on the chart acts as support/resistance equals when RSI rejects the 50 level.
Overbought and Oversold
The indicator comes with overbought and oversold bands equal when RSI becomes overbought or oversold.
█ How to use
This visual representation helps traders to apply RSI strategies directly on the price chart, potentially making RSI trading easier for traders.
-----------------
Disclaimer
The information contained in my Scripts/Indicators/Ideas/Algos/Systems does not constitute financial advice or a solicitation to buy or sell any securities of any type. I will not accept liability for any loss or damage, including without limitation any loss of profit, which may arise directly or indirectly from the use of or reliance on such information.
All investments involve risk, and the past performance of a security, industry, sector, market, financial product, trading strategy, backtest, or individual's trading does not guarantee future results or returns. Investors are fully responsible for any investment decisions they make. Such decisions should be based solely on an evaluation of their financial circumstances, investment objectives, risk tolerance, and liquidity needs.
My Scripts/Indicators/Ideas/Algos/Systems are only for educational purposes!

Extended from Moving AverageThis indicator helps avoid chasing extended stocks by showing every time a stock is too far extended from a selected moving average.
Features:
✔️ selectable moving average and source (high, low, close)
✔️ choose to plot or hide the moving average
✔️ selectable distance to be considered too extended
SMA_EMA_CPR_PivotThis Script can do multiple jobs in single indicator.
Like -:
Plot 3 SMA as per your inputs.
Plot 3 EMA as per your inputs.
Plot CPR Levels.
Plot Pivot Levels.
Plot Previous Day High Low.
Indicator can used in Intraday stock trading, Positional Trading and options trading.
Please Enjoy.
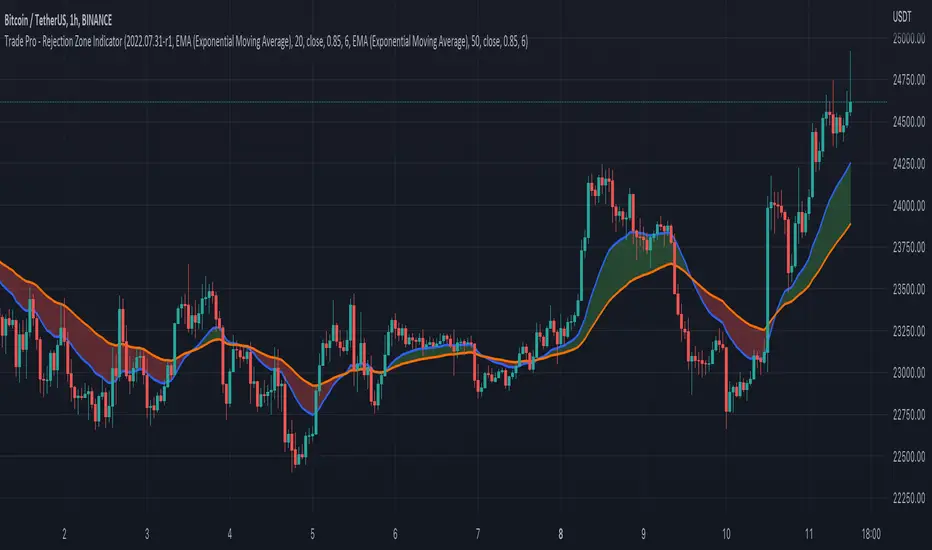
Trade Pro - Rejection Zone IndicatorThe Rejection Zone Indicator can be used to help trend following traders know when to buy dips in up trends, and when to sell pull backs in down trends.
The Rejection Zone Indicator is made up of the 20 and 50 period Exponential Moving Averages. This indicator has colored shading in between these two EMAs, which acts as a nice visual. When the 20 period Exponential Moving Average is below the 50 period Exponential Moving Average, the shaded cloud will be red, and when the 20 EMA is over the 50 EMA the cloud will be green. It is called the Rejection Zone indicator, because often in trends when price pulls back to the colored cloud, it will act as an area of support or resistance.
The suggested use of the Rejection Zone Indicator is to look for long trades when the cloud is green, and once price has pulled back into the green cloud. If the cloud is red one can look for short trading opportunity when price pulls back into the red cloud.
EMAs DistancesThis indicator shows 4 configurable EMAs and the distances (values and percentages) to the last price of the stock, etf or index.
EMA ON MA SETSOORY FOR MY EINGLISH
ITS NOT MY NATIVE AND IM NOT GOING TO GOOGLE TRANSLATE THIS
this is a beuaitful indicator that plot EMA that gat is calc from another ma and length for your choise so you will get an = 'ema on ma '
it can plot you more beautiful results and more smoothing results
i added golden/death cross for all ma
enjoy !
היי חברים זה בעצם אינדיקטור של ממוצע נע על ממוצע נע לנוחיכותכם
הפלט הראשי הוא EMA
הוא לוקח את החישוב שלו ממוצע אחר והאורך שתגדירו
נותן תוצאה יותר חלקה של ממוצעים נעים
הוספתי חתיוכים בין ההמוצעים
תהנו.

Multi-timeframe EMAThe Multi-timeframe exponential moving average (EMA) indicator visualizes EMAs from 1 minute to 1 quarter on a single chart using the request.security function. Standard and Fibonacci timeframes are available as well as the ability to hide high-timeframe EMAs to keep the chart clean. Cross-overs and arrangement of the EMAs indicate sentiment.
Much love to DumpCap! The script is presented sans secret sauce.
Multi EMA with labels (Any timeframe)This script lets you add up to 8 EMAs (Exponential Moving Averages) that can be set to any timeframe and length. The difference between this and other EMA indicators is that it has a simple label attached to each EMA showing which timeframe it belongs to and what length it is, so you can get that information at a glance while trading without having to remember the specific settings for each EMA.
I was personally looking for something like this because I like clarity on my chart and these labels really help. The existing EMA indicators I found with labels don't support multiple timesframes or if they do, they don't include the timeframe itself in the label, so that's why I created this simple script and shared it in case somebody else is looking for the same. Enjoy.
