REMS Synergy OverlayThis 3rd generation REMS indicator builds upon the foundations assessing the relationships between RSI, EMAs, MACDs, and Stochastic RSI across multiple timeframes. Designed to help traders identify less frequent, but high probability entries across 2 time frames. Uses 3 levels of confluence indicators for both long and short moves.
Confluence Level 1 (Highest Conviction):
Evaluates selected criteria across both timeframes. All selected criteria must be in confluence to trigger signal.
Confluence Level 2 (Moderate Conviction):
Selected criteria can be selected by each timeframe individually. All selected criteria must be in confluence to trigger signal.
Confluence Level 3 (Lower/supportive confluence):
Of the selected criteria, this level can evaluate a set number of conditions that must be met. Number of conditions is user-defined.
Includes VWAP and 4 EMAs as optional visual representations.
Includes 'Enhanced Candles' than can colour code candlesticks for better visual identification. (off by default)
Originally designed with 5 minute and 2 minute timeframes in mind, and pairs well with REMS First Strike and/or REMS Snap Shot indicators.
Values coded below:
RSI
-Primary: Length = 14, Smoothing = 20 (via SMA)
-Secondary: Length = 7, Smoothing = 20 (via SMA)
Stochastic RSI
Primary:
-RSI Length = 14
-Stochastic Length = 8
-%K = 3, %D = 3
Secondary:
-RSI Length = 7
-Stochastic Length = 7
-%K = 3, %D = 2
MACD - applied to both timeframes
-Fast = 12, Slow = 26, Signal = 9
Macddivergence

TrendMasterPro_FekonomiTrend Change and Start Signals with Weighted Conditions
The Trend Change and Start Signals with Weighted Conditions indicator leverages various technical analysis tools to generate reliable buy and sell signals. This indicator helps investors more accurately identify trend changes and start signals in the market.
Features:
Utilizes popular technical analysis tools such as MACD, RSI, EMA, and Ichimoku Cloud.
Enhances signal accuracy with additional indicators like ADX and Volume Increase.
Allows users to adjust the weights of each condition to set their importance.
The Confidence Level parameter lets you adjust the accuracy rate of the signals.
Visual Signals make it easy to track buy and sell points directly on the chart.
How It Works:
Condition Weights: Users assign weights to indicators like MACD, RSI, EMA, and Ichimoku Cloud. If you have no idea, use default settings.
Condition Fulfillment: Checks if the conditions for each indicator are met.
Confidence Level: The total weight of the fulfilled conditions must exceed the user-defined confidence level.
Signal Generation: When these conditions are met, a buy or sell signal is generated and visually displayed on the chart.
Customization:
Personalize Signals: By adjusting the weights of the indicators used, you can personalize the signals to match your trading strategy and preferences.
Use Cases:
Short-Term Investments: Identify quick trend changes for short-term trading decisions.
Long-Term Investments: Detect long-term trend starts and changes for strategic investment decisions.
Technical Analysis: Combine different technical analysis tools for more comprehensive and reliable analyses.
With this indicator, you can better understand market movements and make more informed investment decisions. Try it now and enhance your trading strategy!
by Fekonomi

Divergence Indicator Multi [TradingFinder] MACD AO RSI DIV Chart🔵 Introduction
🟣 What is Divergence in Financial Markets?
Divergence in technical analysis happens when the price of a stock moves in a direction opposite to certain indicators. This is a crucial concept in financial markets as it can signal either a trend reversal or a continuation of the current correction in the trend. Understanding divergence helps traders and analysts make more informed decisions.
🟣 Positive Regular Divergence (RD+)
A positive regular divergence occurs at the end of a downtrend, where two price lows form. This divergence appears when the price chart shows a new low, but the indicator does not follow, signaling potential buying opportunities.
Positive divergence indicates increased buying pressure and reduced selling pressure, making it a useful signal for forecasting price increases.
🟣 Negative Regular Divergence (RD-)
A negative regular divergence is seen during an uptrend when two price highs form. The price chart records a new high, but the indicator does not reflect this change, suggesting that a market downturn is likely.
This type of divergence shows strong selling pressure and weaker buying activity, which can help identify selling opportunities.
Both positive and negative divergences are powerful tools for identifying potential trend reversals and key support and resistance levels. For example, when an indicator trends upward while the price moves downward, this creates divergence, warning traders to reconsider their investment strategy.
🟣 Different Types of Divergence in Trading
1. Regular Divergence :
o Positive Regular Divergence (RD+)
o Negative Regular Divergence (RD-)
2. Hidden Divergence :
o Positive Hidden Divergence (HD+)
o Negative Hidden Divergence (HD-)
3.Time Divergence.
Note : This guide focuses specifically on Regular Divergence.
🟣 What is Regular Divergence?
Regular Divergence, often referred to as convergence, occurs when price action and indicators show conflicting patterns, usually signaling the end of a trend. Detecting regular divergence helps traders anticipate potential trend reversals or the formation of reversal patterns.
🔵 How to Use
To optimize the detection of divergence, you can adjust the Fractal Period to specify the length of time for identifying divergence patterns.
Additionally, with the Divergence Detection Method, you can select oscillators like the MACD, RSI, or AO to base divergence detection on.
Divergence in MACD :
MACD divergence occurs when the price chart forms an opposite pattern compared to the MACD line, indicating a potential price reversal.
Divergence in RSI :
In a downtrend, if the price chart forms two consecutive lows with the second lower than the first, but the RSI shows two lows with the second higher, this indicates positive regular divergence, which is a buy signal.
On the other hand, during an uptrend, if the price forms two highs with the second higher than the first, but the RSI shows the second high lower, this points to negative regular divergence, indicating a sell signal.
Divergence in AO (Awesome Oscillator) :
The AO indicator calculates histograms using the difference between 5-period and 34-period simple moving averages. It compares peaks and troughs of these histograms with price movements, detecting divergence and plotting lines and arrows to signal divergence.
🔵 Table
The following table breaks down the main features of the oscillator. It covers four critical categories: Exist, Consecutive, Divergence Quality, and Change Phase Indicator.
Exist : If divergence is detected, a "+" will appear in this row.
Consecutive: Shows the number of consecutive divergences that have formed in a short period.
Divergence Quality : Evaluates the quality of the divergence based on the number of occurrences. One is labeled "Normal," two are "Good," and three or more are considered "Strong."
Change Phase Indicator : If a phase change is detected between two oscillation peaks, this is marked in the table.

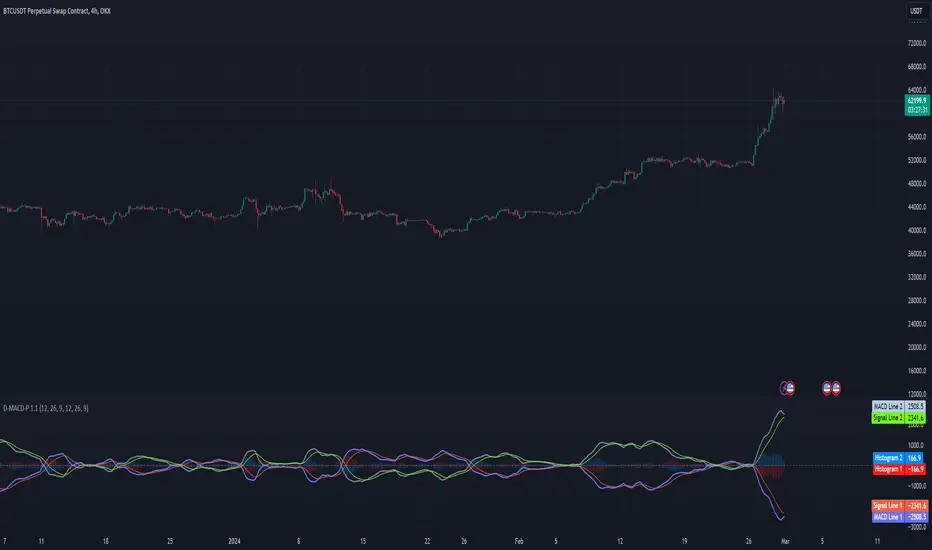
Double MACD Pattern 1.0This script is designed to assist traders in identifying potential trading signals and trends based on the MACD indicator. Users can adjust the input parameters to fine-tune the indicator to their trading preferences. When specific conditions are met, alerts are generated to notify the user of potential trading opportunities.
Indicator Description:
The script defines a custom indicator that calculates and plots two sets of Moving Average Convergence Divergence (MACD) lines along with their signal lines.
It allows users to configure various parameters for MACD calculation, such as fast and slow lengths for both MACD 1 and MACD 2, as well as signal lengths for both.
Plotting:
The script plots the MACD lines and signal lines for both MACD 1 and MACD 2 on the chart with different colors and line styles.
It also plots a middle line at zero for reference.
Alerts:
The script defines conditions for generating alerts based on MACD crossover and crossunder events for both MACD 1 and MACD 2.
Alerts are generated for the following scenarios:
A long signal is generated when MACD 1 crosses under its signal line while MACD 2 crosses over its signal line.
A short signal is generated when MACD 1 crosses over its signal line while MACD 2 crosses under its signal line.
An up trend signal is generated when MACD 2 crosses over MACD 1.
A down trend signal is generated when MACD 1 crosses over MACD 2.
Alerts are included in the script to notify users of these specific trading signals.
Please note that this script is meant for educational purposes and should be used cautiously in a real trading environment. It's important to have a thorough understanding of technical analysis and risk management when using such indicators in actual trading.
Velocity Acceleration Convergence Divergence Indicator [CC]I created the Velocity Acceleration Convergence Divergence Indicator, and it is quite a mouthful if I do say so. I based this script on my two previous scripts: Velocity Indicator and Velocity Acceleration Indicator . This acts like a typical MACD but is much faster with the responses. This indicator is created by finding the difference between the Velocity Indicator and Velocity Acceleration Indicator to determine the overall trend strength of the underlying stock. Like the other scripts, I coded the general buy and sell signals the same, so you would want to buy when the indicator crosses over above the zero midline and sell when it crosses below the zero midline. I have also used the same colors, so darker colors for strong signals and lighter colors for normal signals.
Please let me know if you would like me to publish another script or if you want something custom done!

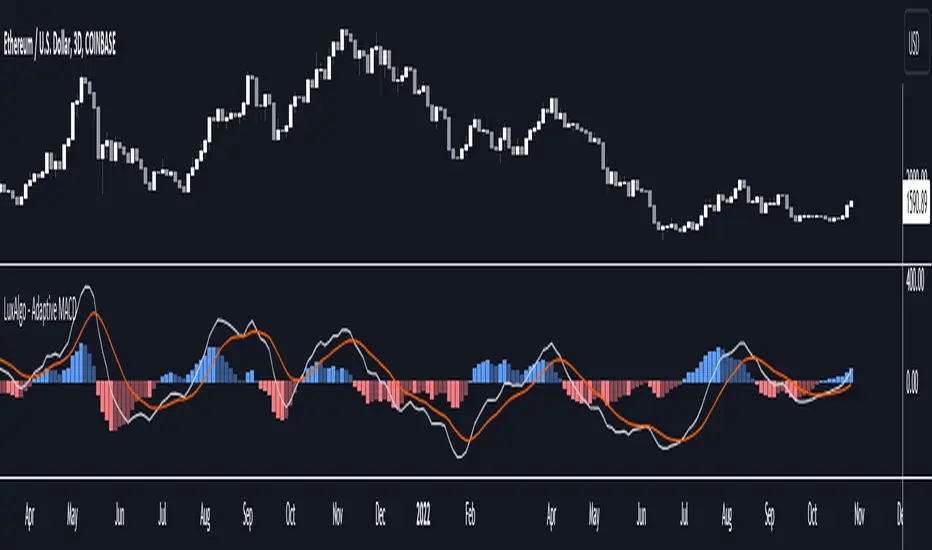
Adaptive MACD [LuxAlgo]The Adaptive MACD indicator is an adaptive version of the popular Moving Average Convergence Divergence (MACD) oscillator, returning longer-term variations during trending markets and cyclic variations during ranging markets while filtering out noisy variations.
🔶 USAGE
The proposed oscillator contains all the elements within a regular MACD, such as a signal line and histogram. A MACD value above 0 would indicate up-trending variations, while a value under 0 would be indicating down-trending variations.
Just like most oscillators, our proposed Adaptive MACD is able to return divergences with the price.
As we can see in the image above ranging markets will make the Adaptive MACD more conservative toward more cyclical conservations, filtering out both noise and longer-term variations. However, when longer-term variations (such as in a trending market) are prominent the oscillator will conserve longer-term variations.
The R2 Period setting determines when trending/ranging markets are detected, with higher values returning indications for longer intervals.
The fast and slow settings will act similarly to the regular MACD, however, closer values will return more cyclical outputs.
The image above compares our proposed MACD (top) with a regular MACD (bottom), both using fast = 19 and slow = 20 .
🔶 DETAILS
It is common to be solely interested in the trend component when the market is trending, however, during a ranging market it is more common to observe a more prominent cyclical/noise component. We want to be able to preserve one of the components at the appropriate market conditions, however, the regular MACD lack the ability to preserve cyclical component with high accuracy.
The MACD is an IIR bandpass filter. In order to obtain a lower passband bandwidth and a more symmetrical magnitude response (which would allow to conserve more precise cyclical variations) we can directly change the system calculation:
y = (price - price ) × g + ((1 - a1) + (1 - a2)) × y - (1 - a1) × (1 - a2) × y
where:
a1 = 2/(fast + 1)
a2 = 2/(slow + 1)
g = a1 - a2
Using division instead of multiplication on the second feedback weight allows further weighting the 2 samples lagged output, returning a more desirable magnitude response with a higher degree of filtering on both ends of the spectrum as shown in the image below:
We are interested in conserving cycles during ranging markets, and longer-term variations during trending markets, we can do this by interpolating between our two filter coefficients:
α × + (1 - α) ×
where 1 > α > 0 . α is measuring if the market is trending or ranging, with values closer to 1 indicating a trending market. We see that for higher values of α the original coefficient of the MACD is used. The image below shows various magnitude responses given multiple values of α :
We use a rolling R-Squared as α , this measurement has the benefit of indicating if the market is trending or ranging, as well as being constrained within range (0, 1), and having a U-shaped distribution.
If you are interested to learn more about the MACD see:
🔶 SETTINGS
R2 Period: Calculation window of the R-Squared.
Fast: Fast period for the calculation of the Adaptive MACD, lower values will return more noisy results.
Slow: Slow period for the calculation of the Adaptive MACD, higher values will return result with longer-term conserved variations.
Signal: Period of the EMA applied to the Adaptive MACD.
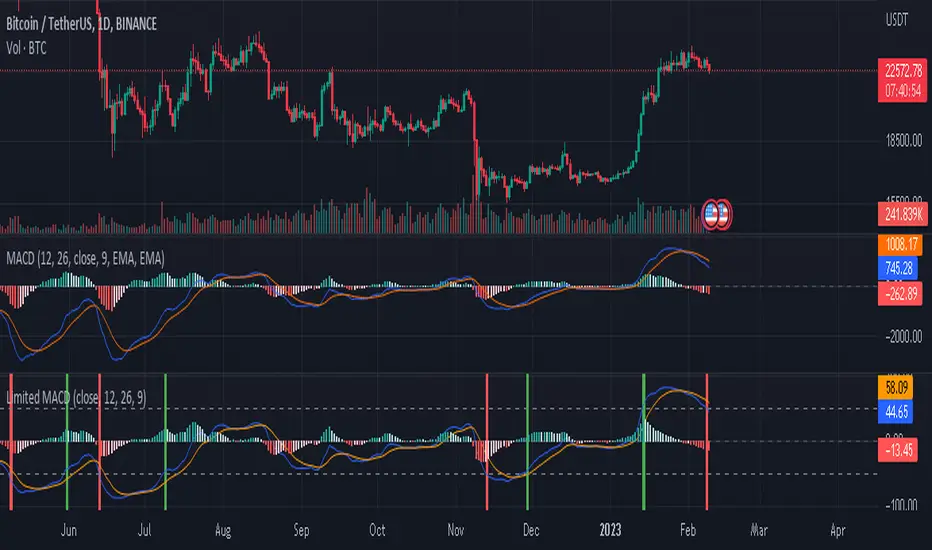
Limited MACDwhat is "Limited MACD"?
it is macd but it has some useful additional features.
what it does?
it takes limited values ??just like rsi. The highest value it can take is 100 and the lowest value is -100. this way it gets the same highs and lows for different symbols and time slots. which means we can set overbought and oversold values ??with it. he also paints candles according to their values. The closer the price is to the oversold values, the more red, and the closer to the overbought values, the greener.
how it does it?
macd values ??are limited by dividing by extreme values. The macd value is used as the variable for the color.rgb function, this is used to get a different color for each macd value.
how to use it?
The variables in the settings section are the same as standard macd.
Use the colors to identify overbought and oversold zones and to predict possible price reversal points. also the indicator will mark possible turning points. other than that, its use is similar to standard macd and its limits are up to your imagination.
four hour:
one hour:
five minute:
Strength of Divergence Across Multiple IndicatorsOverview:
One-stop shop for all your divergence needs, including:
(1) A single metric for divergence strength across multiple indicators.
(2) Labels that make it easy to spot where the truly strong divergence is by showing the overall divergence strength value along with the number of divergent indicators. Hovering over the label shows a breakdown of each divergent indicator and its individual divergence strength value.
(3) Fully customizable, including inputs for pivot lengths, divergence types, and weights for every component of the divergence strength calculation. This allows you to quickly and easily optimize the output for any chart. Don't worry, the default settings will have you covered if you're not interested in what's going on under the hood.
The Divergence Strength Calculation:
The total divergence strength value is the sum of the divergence strengths of all indicators for which divergence was detected at a given bar. Each indicator's individual divergence strength is comprised of two basic components: (1) |ΔPrice| - the magnitude of the change in price over the divergence period (pivot-to-pivot), and (2) |ΔIndicator| - the magnitude of the change in indicator value over the divergence period.
Because different indicators' scales and volatility can vary greatly, the Δ values are expressed in terms of standard deviation to ensure that the values are meaningful and equitable across all indicators and assets/instruments/currency pairs, etc:
|ΔIndicator| = |indicator_value_1 - indicator_value_2| / 2 * StDev(indicator_series,100)
Calculation Weights:
All components of the calculation are weighted and can be modified on the Inputs page in settings (weights are simply multipliers). For example, if you think hidden divergence should carry less weight than regular divergence, you can assign it a lesser weight. Or if you think RSI divergence is worth more than OBV divergence, you can adjust their weights accordingly. List of weights:
Regular divergence weight - default = 1
Hidden divergence weight - default = 1
ΔPrice weight - default = 0.5 (multiplied by the ΔPrice component)
ΔIndicator weight - default = 1.5 (multiplied by the ΔIndicator component)
RSI weight - default = 1.1
OBV weight - default = 0.8
MACD weight - default = 0.9
STOCH weight - default = 0.9
Development for additional indicators is ongoing, as is research into the optimal weight configuration(s).
Other Inputs:
Pivot lengths - specify the number of bars before and after each pivot high/low to consider it a valid candidate for divergence.
Lookback bars and Lookback pivots - specify the number of bars or the number of pivots to look back across.
Price sources - specify separate price sources for bullish and bearish divergence
Display settings - specify how lines and labels should display, including which divergence strength values should show the largest labels. Include/exclude specific divergence types and indicators.
Please report any bugs, or let me know if you have any enhancement suggestions or requests for additional indicators.
@reees

Divergence MACD Sign/Alert [MsF]MACD divergence sign & alert notification.
With this router, you can choose which further indicators you want to see divergence in MACD.
In addition, in order to improve visibility, the sub-window is designed to display only the selected index and diversity.
Lookback Bars: When detecting divergence, you can set how many bars to look back in the past.
--------------
MACDダイバージェンスのサイン&アラートインジケータです。
このインジケータでは、MACDの中でさらにどの指標のダイバージェンスを見るか選択できます。"MACD"、"Signal"、"ヒストグラム"の3つから選べます。
なお、サブウィンドウには可視性向上のため、選択した指標とダイバージェンスのみを表示する仕様としています。
■設定について
Lookback Bars:ダイバージェンス検出する場合に、何個のバーを過去にさかのぼるか設定できます。

MACD Volume S2 By Gammaprod>> How to use this indicator :
1. Set your teadingview theme to dark theme.
2. My indicator is valid for forex, stock and but more valid for crypto.
3. Use three timeframe for more validation (choose between those, that fit to your trading style) :
- Timeframe 1m, 5m, and 15m for Scalping
- Timeframe 30m, 1h and 4h for Intraday
- Timeframe 4h, 1D and 1W for Swing Trading
4 . Always use THREE INDICATORS FROM GAMMAPROD, those three indicators is back to back each other, by the way, I only made those three indicators only (for now) :
- Trendlines Boll Ichi Crypto by Gammaprod
- Stoch RSI Divs Zone Crypto by Gammaprod
- MACD Volume Crypto by Gammaprod
>> How to setting :
1. Trendlines Boll Ichi Crypto by Gammaprod
A. Support and Resistence
- Well if you familiar with this indicator you can add it, but recommended for Timeframe 30m or more
B. Trendlines Primary or Trendlines Secondary
- Timeframe 1m you DON'T NEED Trendlines Primary or Trendlines Secondary
- Timeframe 5m you DON'T NEED Trendlines Secondary, but you CAN ADD Trendlines Primary if you fell it helpful (for me, it is helpful to find where the candles start or the end trend or a consolidation or where the candles will surpass a resistance or a support).
- Timeframe 15m you DON'T NEED Trendlines Secondary, DEFENITELY add Trendlines Primary it will help to find where the candles stop or a consolidation or where the candles will surpass a resistance or a support).
- Timeframe 30m or more, DEFENITELY NEED BOTH Trendlines Primary and Secondary Trendlines, it will help to find where the candle stop or consolidation or where the candle will surpass a resistance or support).
C. Bolinger, Ichimoku Cloud and Lagging Span
- Please DON'T CHANGE IT at all, it's really helpful to know when and where to make an entry decesion or a trend or a consolidation, if you don't understand how to read it, you better to learn it first (on "how to read" section and "How to OPEN position" the section below)
2. Stoch RSI Divs Zone Crypto by Gammaprod (DON'T CHANGE IT)
3. MACD Volume Crypto by Gammaprod (DON'T CHANGE IT)
>> How to read :
1. Sell or Buy Priority :
A. Buy Priority
- Color background on macd and stoch rsi is pink or purple sell is the priority, (if you're not sure to buy, just wait until the best moment to sell)
B. Buy Priority
- Color background on macd and stoch rsi Teal or light green buy is the priority, (if you're not sure to sell, just wait until the best moment to buy)
C. Indecision / Golden Moment
- Color background on stoch rsi yellow is indecision / golden moment of reversal pattern (wait until it formed background only on Stoch RSI), please becareful at this moment.
2. Trend / Consolidation :
A. BULLISH trend
- When Stoch RSI and MACD have teal or light green background that's means BULLISH trend, better to confirm by the candle is above green cloud and lagging span (red line) is also above the candle.
B. BEARISH trend
- When Stoch RSI and MACD have the Pink or purple background that's means BEARISH trend, better to confirm by the candle is above purple cloud and lagging span (red line) is also below the candle.
C. CONSOLIDATION
- When Stoch RSI have the mix background that's means CONSOLIDATION, better to confirm by the candle is in or near to green / purple cloud and lagging span (red line) is also on the candle.
3. Special Mark
A. Ideal Bullish :
- Near line 20 and green / teal background = When Stoch RSI have the char R / H on lime color label, that's means divergence or hidden divergence for buy position, if you not see this label that's means just a standard confirmation for buy
B. Not an Ideal Bullish :
- Near line 80 and green / teal background = if this happens make sure you know what happen, it could be a false signal or bullish continual pattern
C. Ideal Bearish :
- Near line 80 and pink / purple background = When Stoch RSI have the char R / H on lime color label, that's means divergence or hidden divergence for buy position, if you not see this label that's means just a standard confirmation for sell position.
D. Not an Ideal Bearish:
- Near line 20 and pink / purple background = if this happens make sure you know what happen, it could be a false signal or bearish continual pattern
E. The Beginning of Reversal (from BEARISH to BULLISH) :
- When Stoch RSI line shaping GREEN position is near 20.
- MACD lines still PINK, position lines is UNDER the HISTOGRAM, but the HISTOGRAM start to SHAPE FALL PINK (light pink) and the BACKGROUND still PINK / PURPLE.
- Position CANDLES NEAR BLUE line, NEAR PURPLE CLOUD, and lagging span (red line) STILL ON the area candle. (it used to be confirmed with the golden moment).
F. The Beginning of Reversal (from BULLISH to BEARISH) :
- When Stoch RSI line shaping PINK position is near 80.
- MACD lines still GREEN, position lines is ABOVE the HISTOGRAM, but the HISTOGRAM start to SHAPE FALL GREEN (light green) and the BACKGROUND still TEAL / GREEN.
- Position CANDLES NEAR WHITE line, NEAR TEAL CLOUD, and lagging span (red line) STILL ON the area candle. (it used to be confirmed with the golden moment).
G. False Signals, or It could be a Golden Moment (better to see it on TF 15 or bigger):
- Near line 20 or 80 and yellow background = When Stoch RSI have the char R / H on color label, that's means divergence or hidden divergence for buy / sell position, if you not see this label that's means just a standard confirmation for buy / sell depends on where the Stoch RSI line if near 20 that's means buy, near 80 means sell
>> How to OPEN position:
A. Bullish
1. Trendlines Boll Ichi Crypto by Gammaprod
- The candles above the green cloud.
- Lagging span (red line) above the candles.
- then open buy near yellow line (the first option) / blue line (the second option) (always confirm the position with two other indicators below).
2. Stoch RSI Divs Zone Crypto by Gammaprod
- Teal or Green background.
- The lines is shaping green.
- Better if on the bottom (at a range 20).
3. MACD Volume Crypto by Gammaprod
- Teal or Green background.
- The lines is shaped or shaping green.
- Better if at the green histogram.
B. Bearish
1. Trendlines Boll Ichi Crypto by Gammaprod
- The candles below the purple cloud.
- Lagging span (red line) below the candles.
- then open buy near yellow line (the first option) / white line (the second option) (always confirm the position with two other indicators below).
2. Stoch RSI Divs Zone Crypto by Gammaprod
- Pink or purple background.
- The lines are shaping pink.
- Better if the line on the top (at a range 80).
3. MACD Volume Crypto by Gammaprod
- Pink or purple background.
- The lines are shaped or shaping green.
- Better if at the pink histogram.
C. Consolidation
1. Trendlines Boll Ichi Crypto by Gammaprod
- The candles on the cloud (green or purple).
- Lagging span (red line) on the candles.
- then open buy near the white or blue line (always confirm the position with two other indicators below).
2. Stoch RSI Divs Zone Crypto by Gammaprod
- Mix background specially on a timeframe 15m or more.
- The line move fast up and down.
- Better if on the bottom or the top of the lines (at a range 20 or 80).
3. MACD Volume Crypto by Gammaprod
- Changing the background.
- The line is near the middle line.
- Have small Histogram.
>> The secret ingridient is comparing the timeframe :
The example scalping (Timeframe 1m, 5m and 15m)
- TF 1m is for making an open position.
- TF 5m is for making a judgement of the trend market.
- TF 15m is to confirm that judgement from TF 5m, be careful if it not similar then it used to be a consolidation or the beginning of the reversal.
There's a lot a way to open the position than above information that i gave it to you, but consider there are a limit char on this column, I hope it will help your trading and make a more profit on it.

Bogdan Ciocoiu - MoonshotDescription
Moonshot is an indicator that encapsulates the value delivered by the TSI, MACD, Awesome Oscillator and CCI algorithms to produce signals to enable users to enter positions in ideal market conditions. Moonshot integrates the value delivered by the above four algorithms into one script.
This indicator is particularly useful when trading continuation/reversal divergence strategies.
Uniqueness
The Moonshot's uniqueness stands from integrating the above algorithms into the same visual area and leveraging preconfigured parameters suitable for 1-3 minute scalping techniques.
In addition, Moonshot allows swapping or furthermore configuring the above four algorithms in such a way to align signals by colour-coding or shape thickness to aid the users with identifying any emerging patterns quicker.
Furthermore, Moonshot's uniqueness is also reflected in the way it has standardised the outputs of each algorithm to look and feel the same (including the scale at which the shapes are shown) and, in doing so, enables users to plug them in/out as needed.
Open-source
The indicator leverages the following open-source scripts/algorithms:
www.tradingview.com
www.tradingview.com
www.tradingview.com
www.tradingview.com

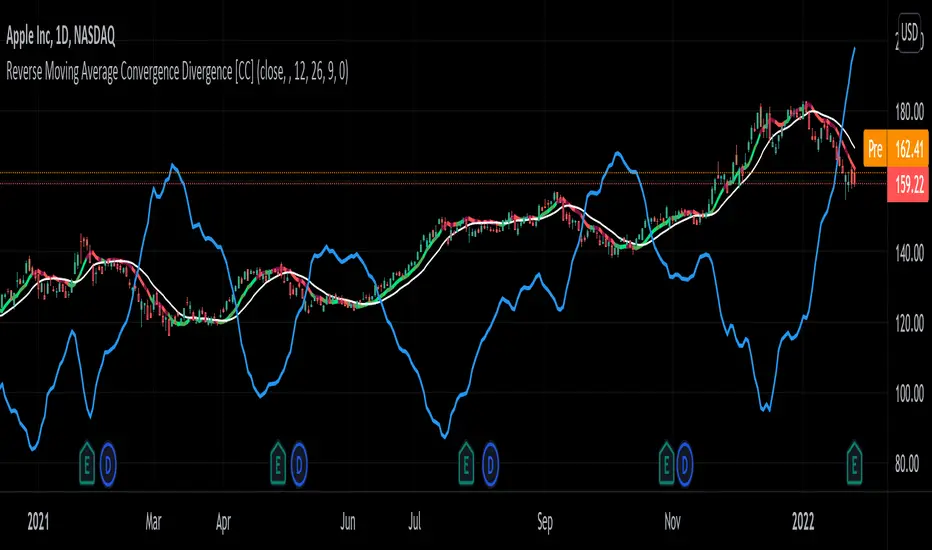
Reverse Moving Average Convergence Divergence [CC]The Reverse Macd was created by Johnny Dough (Stocks and Commodities Jan 2012) and this is another indicator in my ongoing series to find those hidden gems. This indicator works in a few very powerful ways. For example the blue line shows you what the current price would be if the macd was at the macd level that you choose. I set the default to 0 but feel free to change it if you want. This will give you short to medium term info by telling you if it is an uptrend when the price is above the blue line or vice versa. It also creates the reverse macd line and it's signal line by using information from the previous day to decompile the macd and show you the price that it would be at if the macd was at that level. It turns this into a new moving average that closely tracks price movements and with the two competing signals, gives you more than enough info to find the perfect entry and exit points. Like always I have included strong buy and sell signals in addition to normal ones so darker colors are strong signals and lighter colors are normal signals. Buy when the line is green and sell when it is red.
Let me know if there are any other scripts you would like to see me publish!
Jurik MacD & Leader NCMhey everyone,
While there are some Invite-Only Jurik MacDs, there are no free/open ones, so I thought I'd create one and publish it. It has most of the bells and whistles you'd want (I hope!).
You can see one with the bells and whistles all turned on in the first, and a 'quieter' one in the second.
//-----------------////-----------------////-----------------//
Why Jurik?
The Jurik MA is a quicker and smoother Exponential MA, and the best of all MAs, according to Jurik Research (lol). To be fair. I have found it to be excellent, and that is why I'm publishing this.
Power can be changed, recommended from 1-4: increasing it pulls it closer to the current price (almost like reducing the period), and decreasing: vice versa.
Phase increases the inertia of the line, how quickly it will respect price changes. It is usual to have less inertia on the fast JMA, and more on the slower (but remember the MACD line is the FastJMA minus the SlowJMA, so you may find adjusting power and phase on Signal line more effective). Search online for JurikRes (or Jurik Research) for more detailed information about the Jurik.
In the coding I have included a list of four different ways to set up the JMAs: however, you should probably tune this to your preferred asset (as with almost all indicators). If you find a good setup, please let me know!
You could trade with a MacD a number of ways. Entries could be:
- MacD crossing the zero line
- MacD crossing over the Signal line
- Histogram crossing above zero line.
Vice versa for exits. If this isn't enough, please google 'trading with a MacD'.
No indicator is perfect for trading, and that includes this one! Don't trade unless you know what you're doing.
//-----------------////-----------------////-----------------//
Please let me know if I can improve this script, or you have any other feedback. I can post code for colour palette as well if that is something anyone is keen on.
//-----------------////-----------------////-----------------//
Thanks to the many excellent coders that publish freely their code. I have learned so much from this community, and this code is based on the work of others (Chris Moody and everget).
Shout out to StevieMagg as well, who has helped me develop (and didn't want to charge me!). The Pine Script Community on Discord has been brilliant - lots of knowledge, ideas, support - thanks guys.
If you are new and interested in pine coding, I suggest you check out some of the masters (in no order):
ChrisMoody
Everget
RedKTrader
LonesomeDove
LazyBear
KivancOzbilgic
and more that I am missing. It is not necessarily the popular scripts that are the best.
//-----------------////-----------------////-----------------//
Kind regards,
Nelson

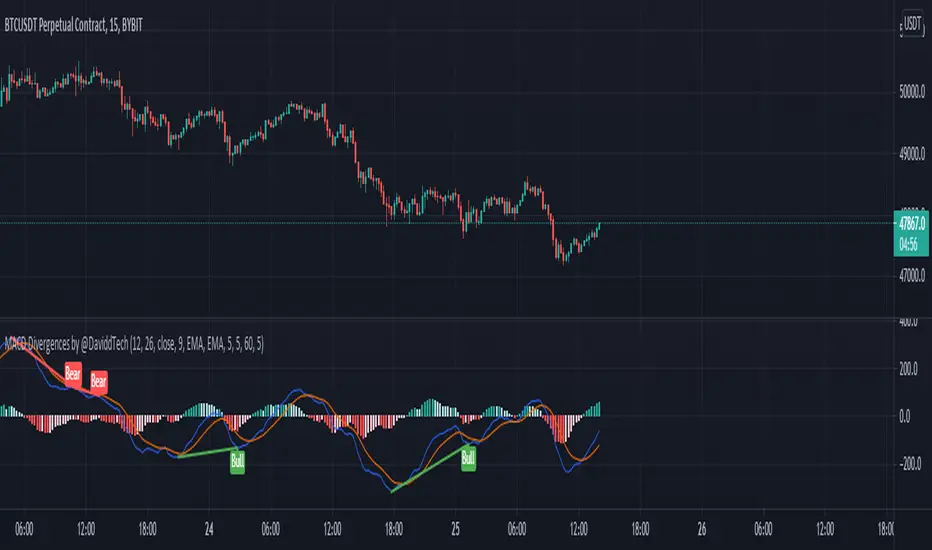
MACD Divergences by @DaviddTechThis indicator helps find divergences in the MACD.
This uses the modification of the TV built-in "Divergence indicator" (Version 10) that I have applied to the MACD.
Usage:
Add the indicator to your chart and then watch for it to plot divergences.
Triple Exponential MACDA modification of the classic MACD to use Triple EMAs which tends to have less lag than the standard indicator. (I also have a Double Exp MACD indicator, I tend to use both simultaneously)
Alert conditions are pre-configured for simple line crosses and you can enable/disable the histogram from the indicator options menu.
Enjoy!

Double Exponential MACDA modification of the classic MACD to use Double EMAs which tends to have less lag than the standard indicator.
Alert conditions are pre-configured for simple line crosses and you can enable/disable the histogram from the indicator options menu.
Enjoy!

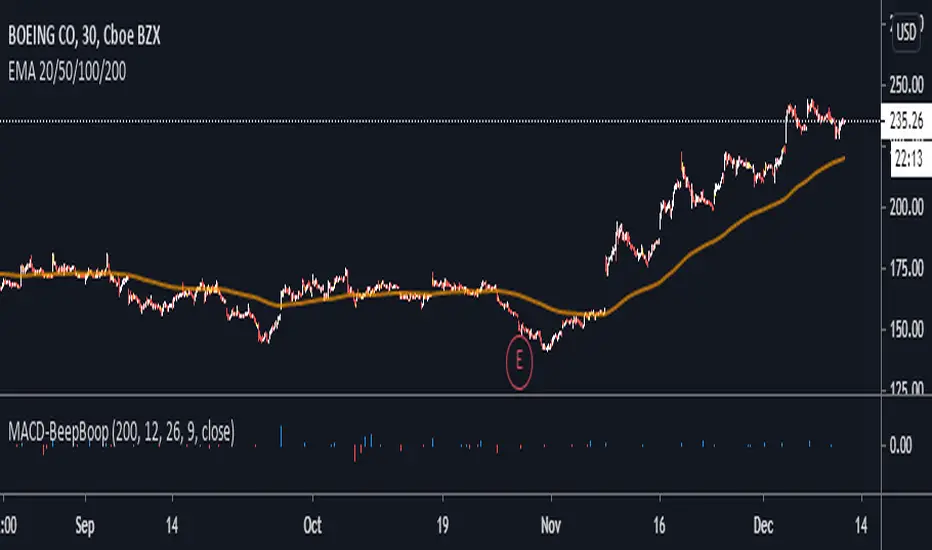
MACD BeepBoop Indicator
The indicator flags long or blue when the macd histogram value > 0 and above the ema and short or red when the macd histogram value < 0 and below the ema
I have added confirmations in the form of eliminating all bars on the histogram unless they meet the long / short entry conditions two bars in a row
You can customize the length of the ema that determines the long/short entry conditions in the settings
I have also added a yellow highlight to the bar in the chart that you would enter on. You would enter at the open of the bar following the signal bar
Stop Loss would be placed at the nearest pivot point or ATR of your choice
Note - republishing this after taking out original links
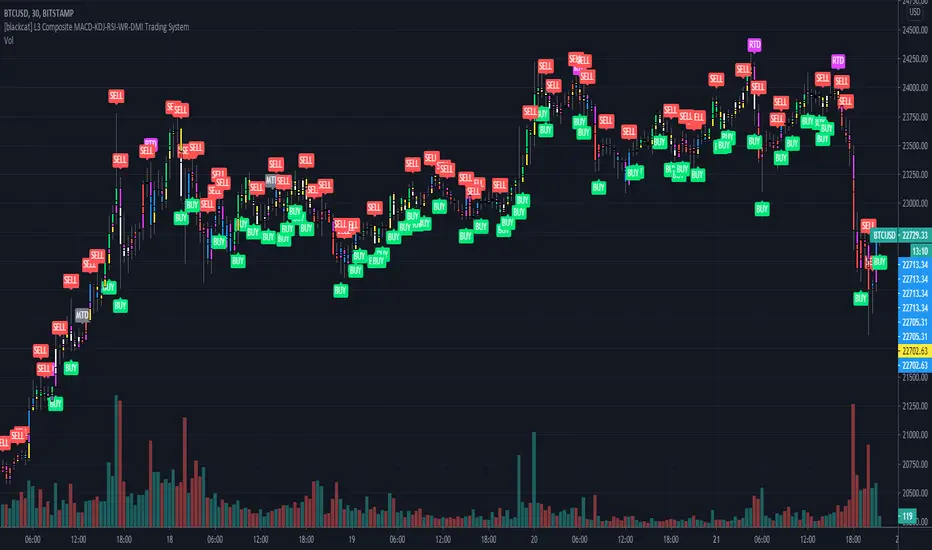
[blackcat] L3 Composite MACD-KDJ-RSI-WR-DMI Trading SystemLevel: 3
Background
The moving average convergence / divergence (MACD) indicator is a pulse oscillator that is mainly used to trade trends. Although it is an oscillator, it is not typically used to identify overbought or oversold conditions. It appears in the diagram as two lines that oscillate without limits. The crossing of the two lines provides trading signals similar to a system with two moving averages.
The KDJ indicator is a technical indicator used to analyze and predict changes in stock performance and the price patterns of a traded asset. The KDJ indicator is also known as the random index. It is a very useful technical indicator that is most commonly used in short term stock market trend analysis. KDJ is a derived form of the Stochastic Oscillator Indicator with the only difference that an additional line is called the J-line. Values of% K and% D indicate whether the security is overbought (over 80) or oversold (under 20). The moments when% K exceeds% D are the moments to sell or buy. The J line represents the deviation of the% D value from% K. The value of J can exceed for the% K and% D lines on the graph.
The Relative Strength Index (RSI) developed by J. Welles Wilder is a pulse oscillator that measures the speed and change of price movements. The RSI hovers between zero and 100. Traditionally, the RSI is considered overbought when it is above 70 and oversold when below 30. Signals can be generated by looking for divergences and error fluctuations.
Williams% R, also known as the Williams Percent Range, is a type of momentum indicator that moves between 0 and -100 and measures overbought and oversold levels. The Williams% R can be used to find entry and exit points in the market. The indicator is very similar to the stochastic oscillator and is used in the same way.
The Directional Movement Index (DMI) is an indicator developed by J. Welles Wilder in 1978 to determine in which direction asset prices are moving. The indicator does this by comparing previous highs and lows and drawing two lines: a positive movement line (+DI) and a negative movement line (-DI). The optional third line is called "Directional Movement (DX)" and it shows the difference between the two lines. When +DI is higher than -DI, the upward pressure on the price is greater than the downward pressure. If -DI is higher than +DI, the price will have greater downward pressure. This indicator can help traders assess the trend direction. Crosses between lines are sometimes used as buying and selling signals.
Function
L3 Composite MACD-KDJ-RSI-WR-DMI Trading System is a simple trading system composed of MACD-KDJ-RSI-WR-DMI together. It can produce 6 types of long entries and 3 types of short entries. It utilizes divergence effect from MACD, KDJ and RSI to detect trend reversal. 6 types of Bottom and top divergence labels are displayed in the chart together with "BUY" and "SELL".
NOTE:In order to make the actual label of the chart more clear, this script does not add stop loss and take profit functions and according labels.
Signal
b1~b3 ---> MACD, KDJ, RSI bottom divergence signal respectively, which hint bull trend may start soon.
d1~d3 ---> MACD, KDJ, RSI top divergence signal respectively, which hint bear trend may start soon.
longentry1~6 ---> with composite indicators together, 6 types of long entry signal are produced.
shortentry1~3 ---> with composite indicators together, 3 types of short entry signal are produced.
Pros and Cons
Pros:
1. excellent open-close, long-short entry signal generation with multiple powerful indicators
2. indicator resonance can help to promote the confidence level of signal and divergence alerts
Cons:
1. integration of multiple indicators is not deeply optimized. fake signal may be produced without filtering schemes
2. no range filter is added
Remarks
To celebrate number of followers exceeds 100. This is my first L3 script published.
Readme
In real life, I am a prolific inventor. I have successfully applied for more than 60 international and regional patents in the past 12 years. But in the past two years or so, I have tried to transfer my creativity to the development of trading strategies. Tradingview is the ideal platform for me. I am selecting and contributing some of the hundreds of scripts to publish in Tradingview community. Welcome everyone to interact with me to discuss these interesting pine scripts.
The scripts posted are categorized into 5 levels according to my efforts or manhours put into these works.
Level 1 : interesting script snippets or distinctive improvement from classic indicators or strategy. Level 1 scripts can usually appear in more complex indicators as a function module or element.
Level 2 : composite indicator/strategy. By selecting or combining several independent or dependent functions or sub indicators in proper way, the composite script exhibits a resonance phenomenon which can filter out noise or fake trading signal to enhance trading confidence level.
Level 3 : comprehensive indicator/strategy. They are simple trading systems based on my strategies. They are commonly containing several or all of entry signal, close signal, stop loss, take profit, re-entry, risk management, and position sizing techniques. Even some interesting fundamental and mass psychological aspects are incorporated.
Level 4 : script snippets or functions that do not disclose source code. Interesting element that can reveal market laws and work as raw material for indicators and strategies. If you find Level 1~2 scripts are helpful, Level 4 is a private version that took me far more efforts to develop.
Level 5 : indicator/strategy that do not disclose source code. private version of Level 3 script with my accumulated script processing skills or a large number of custom functions. I had a private function library built in past two years. Level 5 scripts use many of them to achieve private trading strategy.
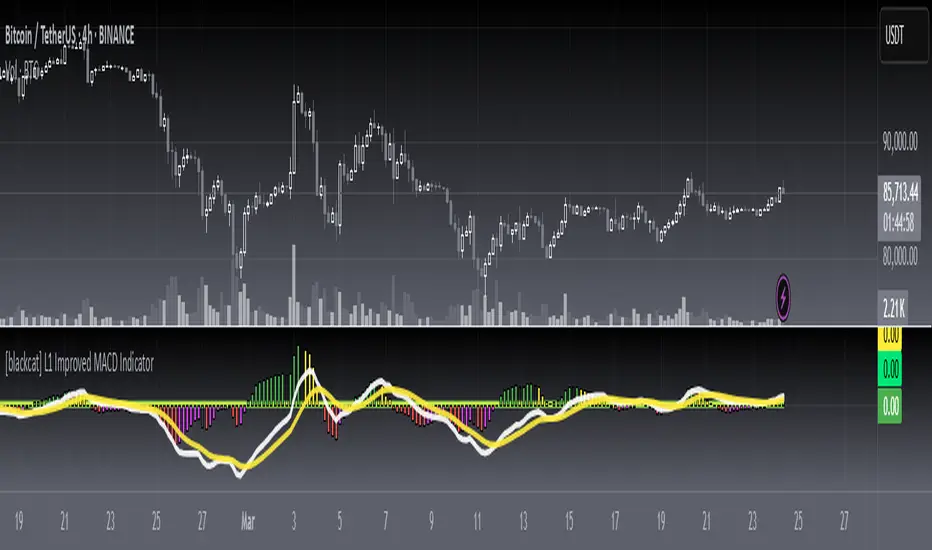
[blackcat] L1 Improved MACD IndicatorLevel: 1
Background
The MACD is a superior derivative of moving average crossovers and was developed by Gerald Appel in 1979 as a market timing tool. MACD uses two exponential moving averages with different bar periods, which are then subtracted to form what Mr. Appel calls the Fast Line. A 9-period moving average of the fast line creates the slow line.
Function
L1 Improved MACD Indicator mainly improves MACD histogram by customized an algorithm and add three levels of long entry alerts derived from ema().
Key Signal
buy1 --> the 1st level of buy alert in green
buy2 --> the 2nd level of buy alert in lime
buy3 --> the 3rd level of buy alert in yellow
diff --> classic MACD diff fast line in white
dea --> classic MACD dea slow line in yellow
macd --> classic difference histogram,but I did not use it directly in the plot.
Pros and Cons
Pros:
1. more clear sub level trend change with new histograms
2. three levels of buy alerts
Cons:
1. need sophisticated knowledge of MACD to use this well
2. this still requires a lot of MACD experience to obtain reliable trading signals
Remarks
I am a fan of MACD. Even the most classic MACD can have in-depth usage. I think MACD is the king of indicators.
Readme
In real life, I am a prolific inventor. I have successfully applied for more than 60 international and regional patents in the past 12 years. But in the past two years or so, I have tried to transfer my creativity to the development of trading strategies. Tradingview is the ideal platform for me. I am selecting and contributing some of the hundreds of scripts to publish in Tradingview community. Welcome everyone to interact with me to discuss these interesting pine scripts.
The scripts posted are categorized into 5 levels according to my efforts or manhours put into these works.
Level 1 : interesting script snippets or distinctive improvement from classic indicators or strategy. Level 1 scripts can usually appear in more complex indicators as a function module or element.
Level 2 : composite indicator/strategy. By selecting or combining several independent or dependent functions or sub indicators in proper way, the composite script exhibits a resonance phenomenon which can filter out noise or fake trading signal to enhance trading confidence level.
Level 3 : comprehensive indicator/strategy. They are simple trading systems based on my strategies. They are commonly containing several or all of entry signal, close signal, stop loss, take profit, re-entry, risk management, and position sizing techniques. Even some interesting fundamental and mass psychological aspects are incorporated.
Level 4 : script snippets or functions that do not disclose source code. Interesting element that can reveal market laws and work as raw material for indicators and strategies. If you find Level 1~2 scripts are helpful, Level 4 is a private version that took me far more efforts to develop.
Level 5 : indicator/strategy that do not disclose source code. private version of Level 3 script with my accumulated script processing skills or a large number of custom functions. I had a private function library built in past two years. Level 5 scripts use many of them to achieve private trading strategy.
Multi Oscillator Divergence IndicatorTradingview Built-in Divergence Indicator with RSI is extended for Price Divergence with
- RSI
- MACD
- Sochastic
- Money Flow
- Demand Index
- Chaikin Money Flow
Thanks to tradingview for providing this unique indicator.

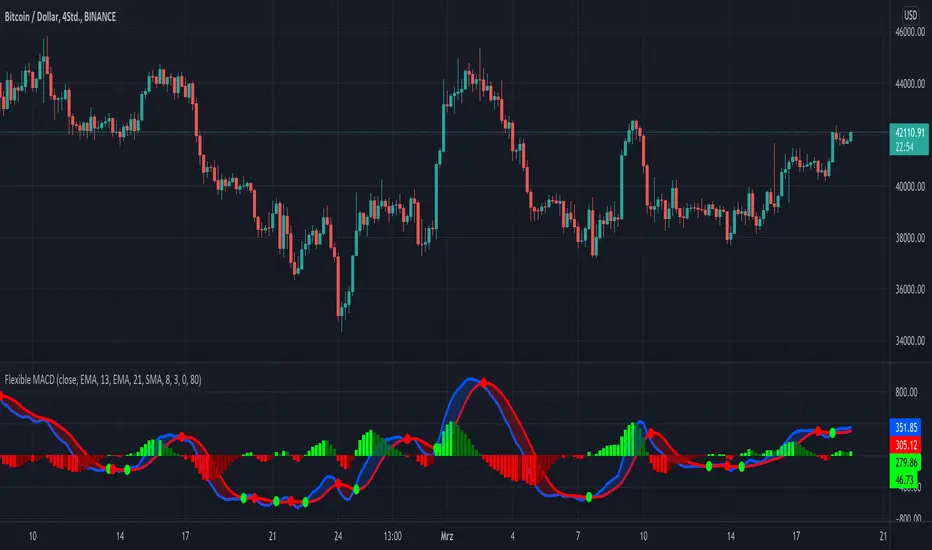
KINSKI Flexible MACDFlexible MACD (Moving Average Convergence/Divergence) Indicator
The Moving Average Convergence Divergence consists of three elements: two moving averages (the MACD line and the signal line) and a histogram. The blue MACD line is the difference between a longer and a shorter EMA (here 13 and 21 periods preset), the red signal line is an SMA (here 8 preset) on the MACD line. The histogram (green: ascending, red: descending) shows the difference between both lines.
As soon as the blue MACD line crosses the red signal line, circles are generated that indicate an up/down trend. If the red signal line is greater than or equal to the blue MACD line, this indicates a downward trend (red circle). If the blue MACD line is greater than or equal to the red signal line, this indicates an upward trend (green circle).
The special thing about this MACD indicator is the many setting options, especially the definition of the MA variants for MACD (Fast, Slow) and signal. You can define the following MA types: "COVWMA", "DEMA", "EMA", "EHMA", "FRAMA", "HMA", "KAMA", "RMA", "SMA", "SMMA", "VIDYA", "VWMA", "WMA".
You also have the following display options:
- "Up/Down Movements: On/Off" - Shows ascending and descending MACD, signal lines
- "Up/Down Movements: Rising Length" - Defines the length from which ascending or descending lines are detected
- "Bands: On/Off" - Fills the space between MACD and signal lines with colors to indicate up or down trends
- "Bands: Transparency" - sets the transparency of the fill color
Disclaimer: I am not a financial advisor. For purpose educate only. Use at your own risk.
McClellan Oscillator [CC]The McClellan Oscillator was created by Sherman and Marian McClellan and it is essentially a MACD of the advancing and declining symbols of the day and is best used as a comparison with the biggest stocks such as my example Apple but that is just my opinion. I pulled the symbol names from a Trading View blog so I'm not 100% sure if they are accurate so please let me know if I'm wrong. Buy when the indicator is over 0 and sell when it falls below 0 but keep in mind that these values are for the market itself and not the individual symbol.
This was a special request so let me know if you would like me to publish more scripts or if you want something custom done!
Note: I'm republishing this because the original script couldn't be found in searches so this will fix that.

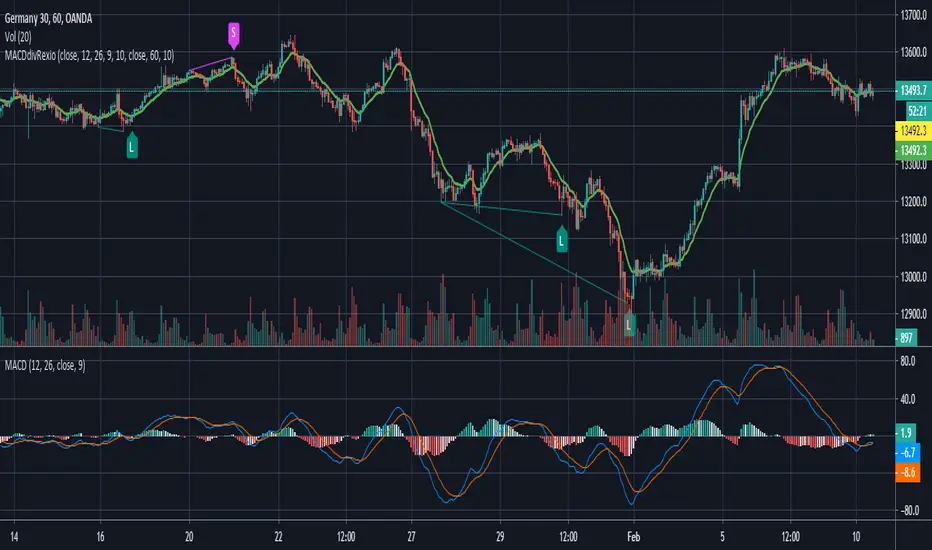
MACD divergence with line drawing by RexioAnother appoach to finding divergences at MACD. This time I think it is much smoother so I could check for divergences between two "peaks" at MACD.
I added my SL line which is last peak +- 1xATR. And the second line is peak between two points of divergence and most of the time it acts like an SR line.
If the higher timeframe trend backs up our divergence (for example: higher trend UP - divergence for L position) I can try to jump in after crossing EMA10.
This indicator is only sugestion for me. I always check price action, trend, SR line before I take any action.
Every people who will test this indicator need to know basics about divergences as THISE ARE NOT BUY/SELL SIGNALS.
If you want to help me and support my coding please contact me via private msg.