Bull Vs Bear Visible Range VP [Kioseff Trading]Hello!
This Script “Bull vs Bear Visible Range VP” Calculates Bull & Bear Volume Profiles for the Visible Range Alongside a Delta Ladder for the Visible Period!
Features
Volume Profile Anchored to Visible Range
Delta Ladder Anchored to Visible Range
Bull vs Bear Profiles!
Standard Poc and Value Area Lines, in Addition to Separated POCs and Value Area Lines for Bull Profiles and Bear Profiles
Configurable Value Area Target
Curved Profiles
Up to 9999 Profile Rows per Visible Range
Stylistic Options for Profiles
This Script Generates Bull vs. Bear Volume Profiles for the Visible Range!
Up to 9999 Volume Profile Levels (Price Levels) Can Be Calculated for Each Profile, Thanks to the New Polyline Feature, Allowing For Less Aggregation / More Precision of Volume at Price and Volume Delta.
Bull vs Bear Profiles
The Image Above Shows Primary Functionality!
Green Profiles = Buying Volume
Red Profiles = Selling Volume
Bullish & Bearish Pocs for the Visible Range Are Displayable!
Profiles Can Be Anchored on the Left Side for a More Traditional Look.
The indicator is robust enough to calculate on "small price periods", or for a price period spanning your entire chart fully zoomed out!
That’s About It :D
This Indicator Is Part of a Series Titled “Bull vs. Bear” - A Suite of Profile-Like Indicators I Will Be Releasing Over Coming Days. Thanks for Checking This Out!
If You Have Any Suggestions Please Feel Free to Share!
Volumepriceanalysis

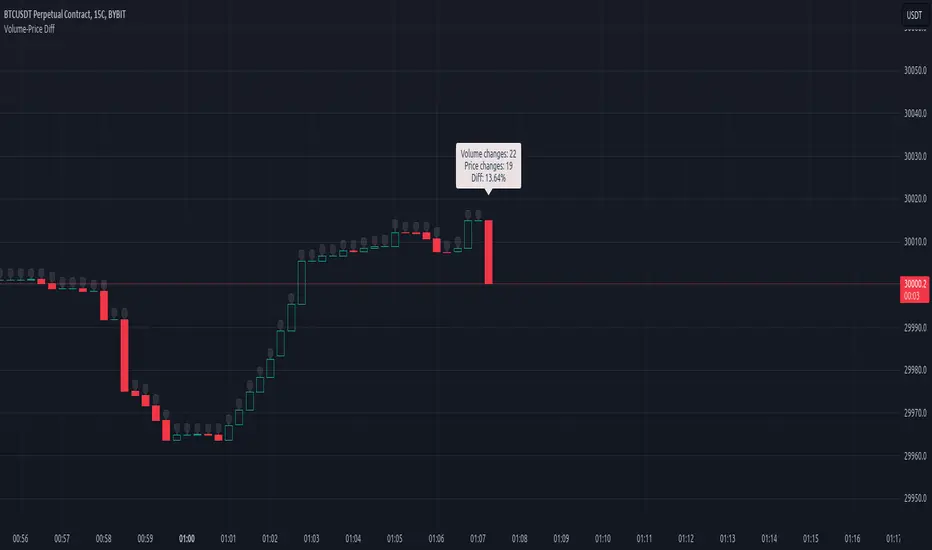
Volume-Price DiffScript is designed to analize volatility in real-time.
Once added to chart, script starting to collect 2 things:
Ticks count (tc)
Price changing ticks count (pctc)
The pctc/tc ratio may be interpret as a volatility measure.
Label above real-time bar shows:
Ticks count
Price changing ticks count
Ratio between (2) and (1) in percents
Using this indicator trader may detect volatility spikes.
More the "Diff" - less the volatility and vice versa.
Zaree - Bull & Bear Volume VoidThe "Zaree - Bull & Bear Volume Void" (BBVV) indicator is a versatile tool designed to help traders assess the dynamics of bull and bear power in the market, with a focus on volume-based analysis. This indicator offers a range of features that aid in identifying potential shifts in market sentiment and strength.
Details of the Indicator:
Volume Void Color Settings: This indicator allows you to customize the colors used for different conditions, such as strong bull areas, slowing bull areas, strong bear areas, and slowing bear areas. These colors play a crucial role in visualizing the indicator's output.
Volume Void Settings: The BBVV indicator provides options for selecting specific volume void functions, which include "Relative Volume Comparison," "Percentage of Average Volume," "Fixed Volume Threshold," "Volatility-Adjusted Volume," "Compare to Previous Volume Bars," "Volume Percentile Rank," and "Market Session Comparison." Each function has its own criteria for evaluating volume conditions.
Void Bull Sensitivity and Void Bear Sensitivity: These are key parameters in the settings. The values you choose for void bull sensitivity and void bear sensitivity will significantly impact the background color displayed by the indicator. Properly configuring these values is crucial for the indicator's effectiveness.
Moving Average Settings: You can specify the source and length of moving averages used in the indicator. This helps in smoothing out data and providing a clearer picture of bull and bear power.
Void Color Background Conditions: The indicator dynamically changes the background color of the chart based on the current market conditions. It takes into account bull and bear power, as well as the configured sensitivity levels to determine whether the market is in a strong or slowing bull/bear phase.
MACD and Signal Lines: The indicator also displays MACD and signal lines on the chart, helping traders identify potential bullish and bearish crossovers.
Histogram Bars: Histogram bars are used to represent the strength of bull and bear power. Above-zero bars indicate bullish strength, while below-zero bars indicate bearish strength.
How to Use the Indicator:
Begin by customizing the color settings for different market conditions to your preference.
Select a volume void function that aligns with your trading strategy and objectives.
Configure the void bull sensitivity and void bear sensitivity values carefully. These values should reflect your desired sensitivity to volume conditions.
Choose the source and length of moving averages based on your analysis requirements.
Pay attention to the background color of the chart. It will change dynamically based on the current market conditions, providing insights into the strength of bull and bear power.
Observe the MACD and signal lines for potential bullish or bearish crossovers, which can be used as additional confirmation signals.
Interpret the histogram bars to gauge the strength of bull and bear power.
Example of Usage:
As a swing trader with a focus on volume analysis, you can use the BBVV indicator to enhance your trading decisions. Here's an example of how you might use the indicator:
Select "Relative Volume Comparison" as the volume void function to assess volume relative to a simple moving average.
Configure void bull sensitivity and void bear sensitivity to match your risk tolerance and trading style.
Choose "SMA" as the moving average type with a suitable length.
Pay attention to the background color changes in the chart. Strong bull areas may indicate potential bullish opportunities, while strong bear areas may signal bearish conditions.
Monitor the MACD and signal lines for potential crossovers, aligning them with the background color to validate your trading decisions.
Use the histogram bars to assess the strength of bull and bear power, helping you gauge market sentiment.
Remember that the BBVV indicator is a valuable tool to complement your trading strategy. It provides insights into volume dynamics and market conditions, allowing you to make informed trading choices.
Be sure to adjust the indicator settings according to your trading preferences and always consider the broader market context in your analysis.

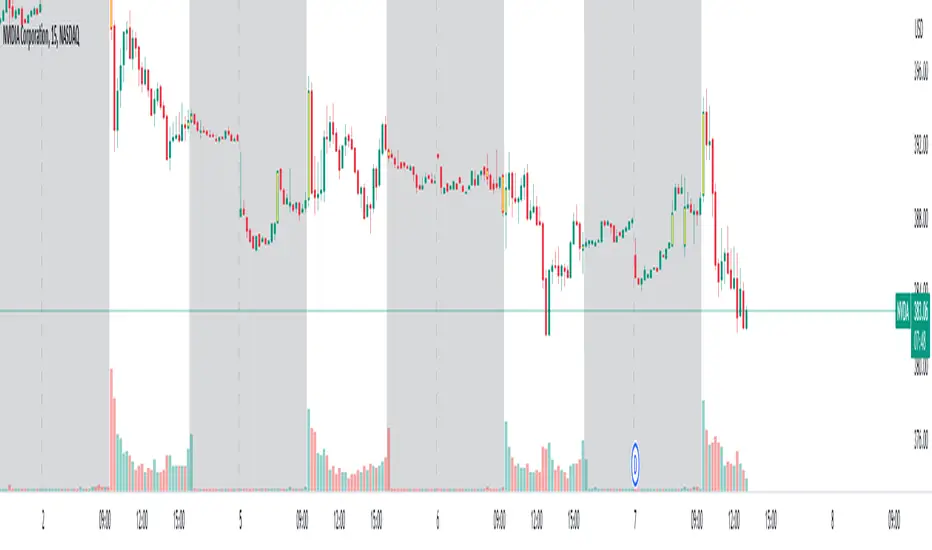
Volume Profile - BearJust another Volume Profile but you can fit into your chart better by moving back and forth horizontally. also note you can fix the number of bars to show the volume by that way you can use a fib retracment to line up high/low volume nodes with fib levels... see where price as bad structure. or just play with the colors to make a cool gradient?
Volume Profile is a technical analysis tool used by traders to analyze the distribution of trading volume at different price levels within a specified time frame. It helps traders identify key support and resistance levels, potential areas of price reversals, and areas of high trading interest. Here's how to read Volume Profile on a trading chart:
1. **Choose a Time Frame**: Decide on the time frame you want to analyze. Volume Profile can be applied to various time frames, such as daily, hourly, or even minute charts. The choice depends on your trading style and goals.
2. **Plot the Volume Profile**: Once you have your chart open, add the Volume Profile indicator. Most trading platforms offer this tool. It typically appears as a histogram or a series of horizontal bars alongside the price chart.
3. **Identify Key Elements**:
a. **Value Area**: The Value Area represents the price range where the majority of trading volume occurred. It is often divided into three parts: the Point of Control (POC) and the upper and lower value areas. The POC is the price level where the most trading activity occurred and is considered a significant support or resistance level.
b. **High-Volume Nodes**: High-volume nodes are price levels where there was a significant amount of trading volume. These nodes can act as support or resistance levels because they represent areas where many traders had their positions.
c. **Low-Volume Areas**: Conversely, low-volume areas are price levels with little trading activity. These areas may not provide strong support or resistance because they lack significant trader interest.
4. **Interpretation**:
- If the price is trading above the POC and the upper value area, it suggests bullish sentiment, and these levels may act as support.
- If the price is trading below the POC and the lower value area, it suggests bearish sentiment, and these levels may act as resistance.
- High-volume nodes can also act as support or resistance, depending on the price's current position relative to them.
5. **Confirmation**: Volume Profile should be used in conjunction with other technical analysis tools and indicators to confirm trading decisions. Consider using trendlines, moving averages, or other price patterns to validate your trading strategy.
6. **Adjust for Different Time Frames**: Keep in mind that Volume Profile analysis can yield different results on different time frames. For example, a support level on a daily chart may not hold on a shorter time frame due to intraday volatility.
7. **Practice and Experience**: Like any trading tool, reading Volume Profile requires practice and experience. Analyze historical charts, paper trade, and refine your strategies over time to gain proficiency.
8. **Stay Informed**: Stay updated with market news and events that can impact trading volume. Sudden news can change the significance of volume levels.

Exceptional Volume Spike - Potential Trend Reversal IndicatorWhat the Script Does:
The indicator aims to identify potential trend reversal points using the following steps:
Input Parameters: The script has three main input parameters that you can adjust:
relative_volume_threshold: This parameter sets the threshold for what is considered an exceptional volume spike in relation to the average volume.
ema_length: The length of the exponential moving average (EMA) used for smoothing calculations.
lookback_period: The period over which the script calculates potential support and resistance levels.
Relative Volume Calculation: The script calculates the relative volume by dividing the current volume by the average volume over the specified lookback_period.
Exceptional Volume Spikes: The script identifies exceptional volume spikes when the calculated relative volume exceeds the specified relative_volume_threshold.
EMA of Exceptional Volume Spikes: The script calculates the exponential moving average (EMA) of volume spikes. This EMA smooths out the volume spikes over the chosen ema_length.
Trend Direction: The script determines the trend direction using the crossovers of the EMA of exceptional volume spikes. If the EMA crosses above the EMA of regular volume (not spikes), it suggests a potential upward trend reversal. Conversely, if the EMA crosses below, it suggests a potential downward trend reversal.
Support and Resistance Levels: The script calculates potential support and resistance levels based on the highest high (hh) and lowest low (ll) over the specified lookback_period. These levels are then plotted on the chart.
Plot Shapes and EMA: The script plots triangle shapes below the bars for potential upward reversals and above the bars for potential downward reversals. Additionally, it plots the EMA of the closing price with different colors based on the trend direction.
By using this script as an indicator on your chart, you can visually assess potential trend reversal points based on exceptional volume spikes, trend direction crossovers, and support/resistance levels. Remember that this script serves as a tool to assist your analysis, and it's important to combine it with other technical analysis tools and strategies before making trading decisions.

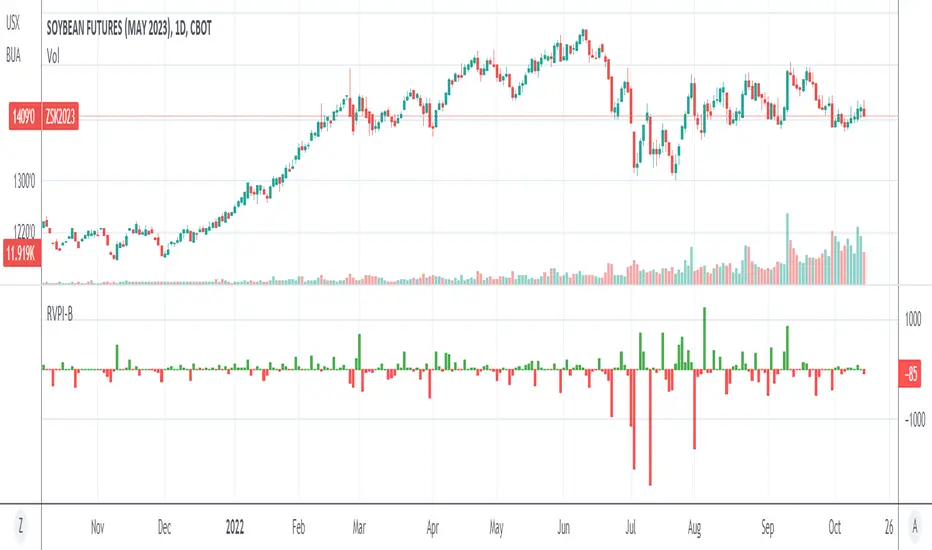
nVPSA - Normalized Volume-Price Spread AnalysisNormalized volume-price spread analysis indicator can be helpfully tool in Tom's William metodology - VSA.
The indicator use normalized data by y/x(max) operation, where x(max) is the biggest value in range. Indicator separate spread to four levels - standard divation is separator.
The indicator graphically shows:
- normalized volume, visualized by wide column,
- normalized price spread, visualized by narrow column,
- linear regression calculated from normalized volume, visualised by crosses,
- linear regression from normalized price spread, visualized by circles.
Columns are marked by five colors according to standard deviation:
- blue xsecond deviation, xfourth deviation,
- gold when volume or price spread achive new maximum in analysis range.
Linear regression uses three colors:
- green when volume/spread is up bar by bar,
- red when volume/spread is down bar by bar,
- black when volume/spread is down two times bar by bar.
Additionally, it is posible to use alarm on Golden Bar. Colors and range values are editable from indicator settings.

ETN - Volume CandleHighlights candlestick based on volume data.
Indicator looks back and analyzing volume to find the volume bar with the largest numerical value
Indicator highlights the corresponding candlestick .
Indicator marks the high and low of that candlestick.
Users can adjust lookback period. Default is set to 50 .
Users can adjust how the indicator plots the high and low.
I currently have the high and low not being displayed on the charts until I come up with a better version.
On my chart, indicator colored the candlesticks YELLOW.
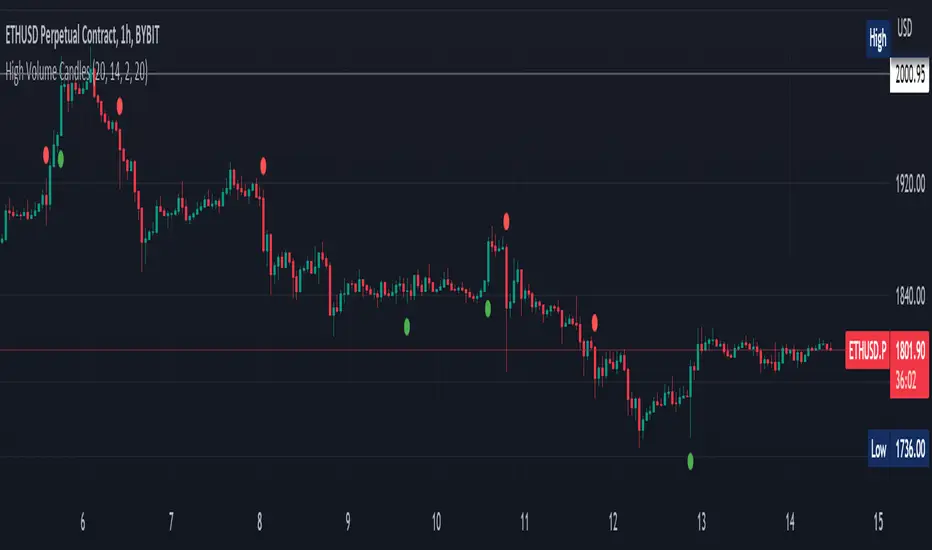
High Volume Candles Detector - Open Source CodeGreetings, fellow traders!
Throughout my trading career, I've been intrigued by the dynamic interplay between candlestick patterns and trading volume. This fascination led me to develop an open-source indicator to help illuminate these patterns for the broader trading community.
Upon researching the Public Library, I found that many indicators relating to candlestick/volume analysis are proprietary and not open-source. This discovery further fueled my commitment to contribute a free, accessible tool that traders of all levels can utilize in their technical analysis.
Thus, I am excited to present to you our High Volume Bars Indicator. A unique tool that I believe fills a gap in the Public Library. I truly hope you find it beneficial in your trading journey and that it empowers you to make more informed decisions.
Description:
The High Volume Bars Detector is designed to help traders identify bars with significantly higher volume than the average. Users can filter in the settings menu:
1) The length of the Simple Moving Average (SMA) for volume, allowing you to define the average volume over a specific number of bars.
2) The Volume Multiplier, a factor that determines how much greater the volume of a bar should be compared to the SMA to qualify as a high-volume bar.
3) The Lookback Period, a specified number of candles used as a comparative benchmark for identifying the highest volume.
4) If the Volume bar is green or red, so if the candle price is --> close > open or open > close
Examples to better understand the logic of the indicator:
1) Length of the Simple Moving Average (SMA) for Volume: This setting allows you to define the average volume over a specific number of bars. For instance, if you set the SMA length to 20, the indicator will calculate the average volume of the past 20 bars and use it as a baseline to identify high volume bars.
2) Volume Multiplier: This is a critical factor that determines the threshold for what constitutes a high-volume bar. If you set the volume multiplier to 2.0, for example, the indicator will flag any bar where the volume is twice the value of the SMA volume as a high-volume bar.
3) Lookback Period: This setting lets you specify the number of candles that the indicator should consider when determining the highest volume. For instance, if the lookback period is set to 14, the indicator will compare the volume of the current bar with the volumes of the previous 14 bars. If the current bar's volume is the highest, it will be flagged.
4) Volume Bar Color: This filter helps you identify whether a high-volume bar is bullish or bearish. If the bar is green (close > open), it suggests buyers were dominant during that period. If the bar is red (open > close), it suggests sellers had the upper hand. By setting this filter, you can choose to focus on high volume bars that are either bullish (green) or bearish (red) or both, depending on your trading strategy.
Remember, these filters offer a level of customization that allows you to tailor the High Volume Bars Detector to your unique trading style and requirements. Always remember to adapt these settings to align with your overall trading plan and risk tolerance.
Keep attention!
It is important to note that no trading indicator or strategy is foolproof, and there is always a risk of losses in trading. While this indicator may provide useful information for making conclusions, it should not be used as the sole basis for making trading decisions. Traders should always use proper risk management techniques and consider multiple factors when making trading decisions.
Support me:)
If you find this new indicator helpful in your trading analysis, I would greatly appreciate your support! Please consider giving it a like, leaving feedback, or sharing it with your trading network. Your engagement will not only help me improve this tool but will also help other traders discover it and benefit from its features. Thank you for your support!
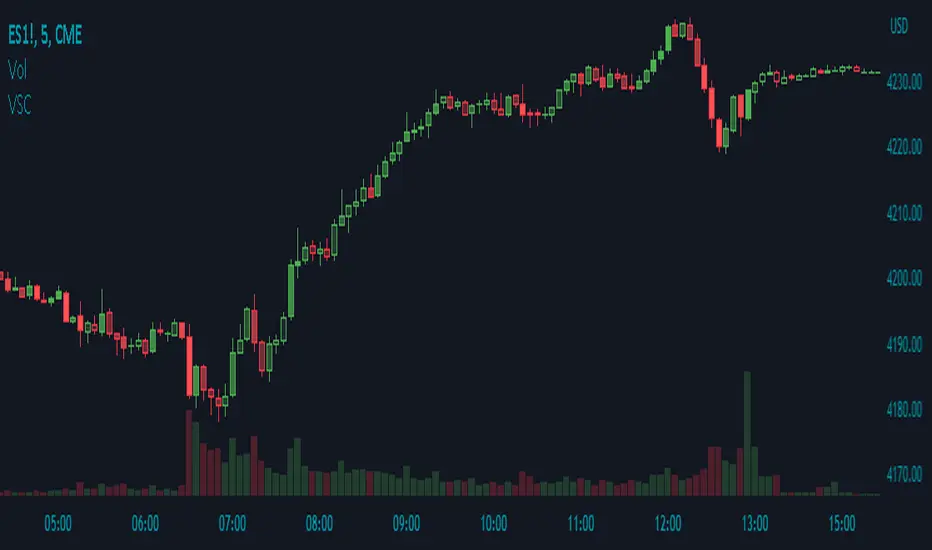
Volume Shaded CandlesDescription:
The Volume Shaded Candles indicator (VSC) is a technical analysis tool designed to represent price candles on a chart with transparency based on the volume traded during each candle. This overlay indicator enhances visual analysis by providing a visual representation of volume intensity.
How it Works:
The VSC indicator calculates the volume-to-transparency ratio by dividing the current volume by the highest volume within the last 10 periods. The ratio is then used to determine the shading intensity of the price candles. Higher volume relative to the recent highest volume results in lower transparency, while lower volume results in higher transparency.
Usage:
To effectively utilize the Volume Shaded Candles indicator, follow these steps:
1. Apply the Volume Shaded Candles indicator to your chart by adding it from the available indicators.
2. Configure the indicator's inputs:
- Specify the color for bullish candles using the "Bullish Color" input.
- Specify the color for bearish candles using the "Bearish Color" input.
3. Observe the shaded candles on the chart:
- Bullish candles are colored with the specified bullish color and shaded according to the volume intensity.
- Bearish candles are colored with the specified bearish color and shaded according to the volume intensity.
4. Interpret the shaded candles:
- Darker shading indicates higher volume during the corresponding candle.
- Lighter shading indicates lower volume during the corresponding candle.
5. Combine the analysis of shaded candles with other technical analysis tools, such as trend lines, support and resistance levels, or candlestick patterns, to identify potential trade setups.
6. Implement appropriate risk management strategies, including setting stop-loss orders and position sizing, to manage your trades effectively and protect your capital.
Trend IndicatorThis indicator has different features:
1. Ichimoku = this indicator can plot Ichimoku calculated both in the common formula and with the volume average, you can choose the calculator method for each line.
2. Channel and Bands = this mode allows the user to choose from channel and band, "channel" shows the Keltner channel, and "band" shows the Bollinger bands. Both the indicators are calculated including the volume in the formula of the average midpoint.
3. Color candle = this function allows the user to see two different colors of candles on the chart, the positive color occurs when both the long-term average and the short team average of price calculated using the volume is above the two averages calculated without the volume. This function is great to analyze the volume pressure, useful to identify trend continuation and exhaustion.
4. Extreme reversal zones = this is a version of the Keltner channels calculated over a high number of candles and with high deviation, to identify the potential zones of reversal.
Note that in the "Ichimoku" indicator, the backline is the T.R.A.M.A. indicator, created and published open source by Lux Algo, which I thank for the script.

OBV-MACDThe OBV-MACD indicator is a momentum-based technical analysis tool that helps traders identify trend reversals and trend strength. This Pine script is an implementation of the OBV-MACD indicator that uses the On-Balance Volume (OBV) and Moving Average Convergence Divergence (MACD) indicators to provide a momentum data of OBV.
The OBV-MACD indicator uses the OBV to calculate the cumulative volume, which is then smoothed using two moving averages - fast and slow. The difference between these moving averages is plotted as a histogram, with a signal line plotted over it. A buy signal is generated when the histogram crosses above the signal line, indicating a bullish trend, while a sell signal is generated when the histogram crosses below the signal line, indicating a bearish trend.
This Pine script also includes an OBV-MACD-Donchian version that incorporates Donchian channels for the OBV-MACD. The Donchian channel is a technical analysis indicator that helps traders identify the highs and lows of an asset's price over a certain period. The OBV-MACD-Donchian version uses the OBV-MACD indicator along with the Donchian channels to provide signals that the momentum of OBV is making new high/low during that period of time.
Traders can customize the input parameters of the OBV-MACD indicator, such as the timeframe, method of calculation for the moving averages, and the lengths of the moving averages and breakout lengths. The colors of the plot can also be customized to suit the trader's preferences.

Volume Weighted Average Price (VWAP) with Extras [starlord_xrp]This script builds on the standard VWAP buy adding anchor selections for new High, new Low, and for extreme price moves (Percent Change) that can be significate anchor points for the VWAP. The Percent Change is based on "% Price Change" by OrganicPunch and uses a percentage threshold that can be set in the settings.

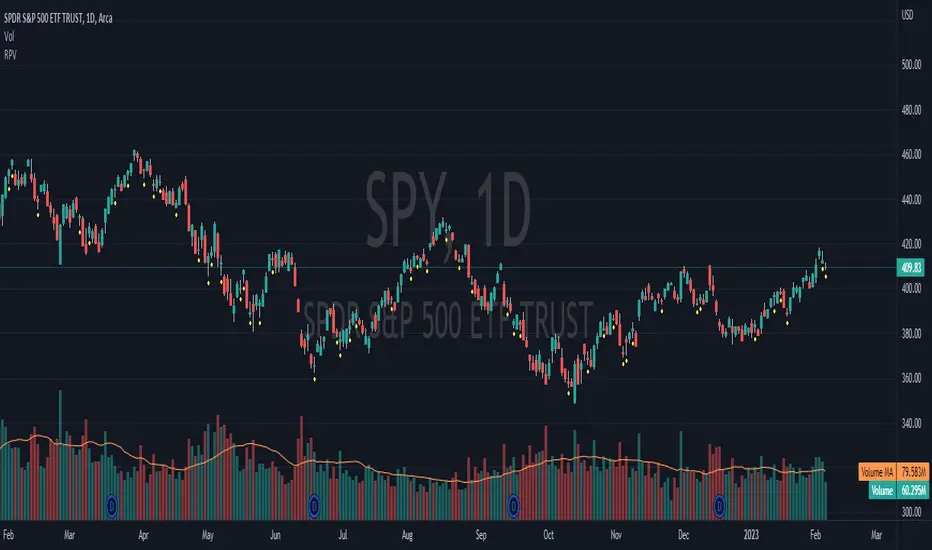
Relative Price Volume
Relative Price Volume is an indicator which shows anomalies between price and volume on a chart over a given period. The goal is to identify potential reversal and/consolidation areas for price as it relates to volume. It is a simple variation of a Volume at Price indicators. It can also be used to mark potential support and resistance lines on the chart as the areas it signals is where the price battles are waged.
Settings:
Period = length for which to calculate average candle body and average volume
Long Factor = relative size multiplier to determine if a candle is larger than average or if volume is higher than average
Short Factor = relative size multiplier to determine if a candle is smaller than average or if volume is lower than average
Anomaly Conditions
1. If a candle is larger than average and volume is lower than average, then this is an anomaly, and we should be on alert for a change in momentum.
2. if a candle is smaller than average and volume is higher than average, then this too is an anomaly and should put us on alert.
The indicator will draw a cross on the chart indicating the candle is that is flashing the warning that the run is done and a potential consolidation and/or reversal is pending. Used in conjunction with support and resistance levels this could signal a time to enter or exit a trade.
The default size factors considers a candle or volume:
1. Larger than average if it is 60% or more (.6) larger than average.
2. Smaller than average if it is 40% or less (.4) smaller than average.
Hope this helps! Happy trading!
Relative Market Status by @WilliamBeliniWhat is the impact for Volume to the Prices?
To respond this question, I formulate the hipótesis if a little Volume change a lot the Price, it's a reversion signal, and if a lot of Volume change a little the price, it´s because the price is established.
This is one of 3 indicators created to improve this hipótesis, named:
1. Relative Volume Prices Index by @WilliamBelini (RVPI)
2. Relative Market Status by @WilliamBelini (RMS)
3. Trade Trigger RVPI by @WilliamBelini (TTR)
- The first show you the effect from volume to the prices, meas the sensibility of the variation;
- The second show you the feeling of the market by cicles, based at the cumulative average sensibility from the RVPI indicator;
- The third show you a trigger to trading positions, with the analysis of the historical RVPI data, based on the normal distribution of the futures price variation, by previos RVPI values and some rules created based on data behaviors identified.
To the end of this work, I can comprove the hipótesis, with simulations trading based from the TTR.
How we can´t monetize our work here, on TradingView platform, I´m disponibilize 2 of 3 indicators for you here free. If you want to have the third, discover how to contact with me (@ ;), and for me will be a pleasure to help you.

Relative Volume Prices Index by @WilliamBeliniWhat is the impact for Volume to the Prices?
To respond this question, I formulate the hipótesis if a little Volume change a lot the Price, it's a reversion signal, and if a lot of Volume change a little the price, it´s because the price is established.
This is one of 3 indicators created to improve this hipótesis, named:
1. Relative Volume Prices Index by @WilliamBelini (RVPI)
2. Relative Market Status by @WilliamBelini (RMS)
3. Trade Trigger RVPI by @WilliamBelini (TTR)
- The first show you the effect from volume to the prices, meas the sensibility of the variation;
- The second show you the feeling of the market by cicles, based at the cumulative average sensibility from the RVPI indicator;
- The third show you a trigger to trading positions, with the analysis of the historical RVPI data, based on the normal distribution of the futures price variation, by previos RVPI values and some rules created based on data behaviors identified.
To the end of this work, I can comprove the hipótesis, with simulations trading based from the TTR.
How we can´t monetize our work here, on TradingView platform, I´m disponibilize 2 of 3 indicators for you here free. If you want to have the third, discover how to contact with me (@ ;), and for me will be a pleasure to help you.
Volume Price and FundamentalsVolume Price and Fundamentals indicators contains 4 exponential moving averages based upon Fibonnaci numbers as period (8, 21, 55 & 144) with crossovers and crossunders.
It also contain a table for volume and 50 Day Avg. Volume, Relative volume, Change in Volume, Volume Value, Up-Down Closing Basis days in last 50 days, Volume ratio (U/D Ratio) on last 50-day Up / Down days and along with fundamental analysis table with various Fundamental Analysis parameters and QoQ & YoY comparison basis for better investment decision making.

Volume ROC and 2nd Derivative by ianhThe purpose of this code is to graph a volume simple moving average (sma) and it's first and second derivatives to provide traders with additional information that might determine if volume is converging or diverging with price. The yellow line represents the volume sma, the red line represents the first derivative or the rate of change of the volume and the green line represents the second derivative or acceleration of volume. For long term trading, if the yellow line is "trending" upwards with higher highs and higher lows it means that volume is supporting the over all long term price trend. If the volume is decreasing over the long term then it is not supporting the current price trend. The first and second derivatives may help short term weekly traders confirm price movements. There are several different conditions to look for:
First (Red) ++ Second (Green) --, Trading volume at the current price has "peaked" and the price may reverse soon.
First (Red) -- Second (Green) ++, Trading volume at the current price has "troughed" and the price may reverse soon.
First (Red) + Second (Green) +, Trading volume is not only increasing but it's accelerating which might confirm a large price movement.
First (Red) - Second (Green) -, Trading volume is not only decreasing but it's decelerating which might indicate little to no price movement.

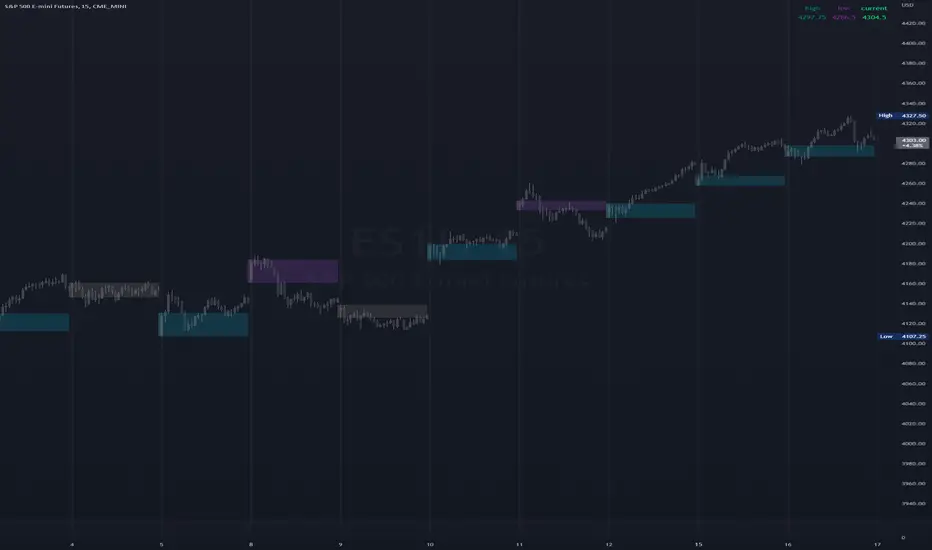
High & Low Of Custom SessionThis script boxes a custom session and sets the box at the high and low of the session and draws that box to the next session.
Box color is determined by price in relation to the box position. Box color is set at the start of the next session. This allows
user to lookback at multiple box sets to see how each day closed in relation to the session highlighted.
I have written this for backtesting purposes and intend to expand it to use with volume analysis and gradient color to change the box color based on how many times price tests
the box.
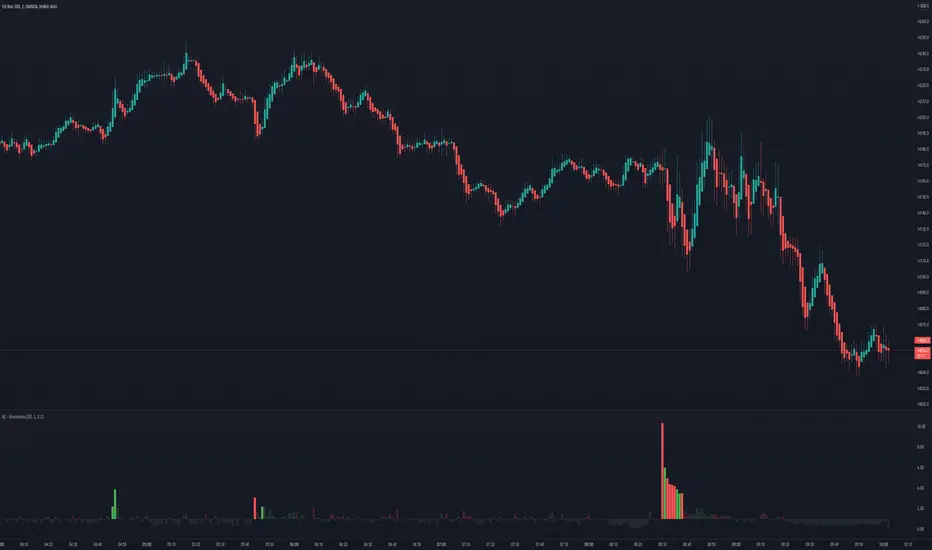
Volume Risk Avoidance IndicatorPrice Pattern Analysis is the core of trading. But price patterns often fails.
VRAI (Volume Risk Avoidance Indicator) shows Volume Pressure, so that you can avoid volume-based risks.
For example, never short when you see green (buying pressure). Never long when you see red (selling pressure).
You still need to pick good price patterns, because the crossover of volume pressure is not reliable.
Enjoy!

Money Flow LineWhat is this? The Money Flow Line (MFL) indicator is at its core a more even-tempered version of the Price-Volume-Trend (PVT). The primary difference is the usage of `hlc3` ((high + low + close) / 3) rather than `close` to use the "typical price" that it critical to the calculation of the Money Flow Index (MFI). Other similar indicators include the Accumulation Distribution Line (ADL) and the On Balance Volume (OBV) indicators. The purpose of all of these indicators is to attempt to measure the strength of the money flow by combining price and volume into a rolling measurement that can be compared over time to look for confirmations and divergences.
The indicator also includes an optional averaging (smoothing) line that can be enabled in the display settings. Enabling this smoothing line with a desired period allows for simpler trend comparisons and also allows the user to view how far the line has diverged from the mean. This creates an indicator very similar to Elder's Force Index (EFI), which is also a `close * volume` style indicator.
Why is this important? After an extreme movement or volume spike the MFI will "snap back" sharply as that bar eventually exits the set period. This produces a result that is meaningless and skews the indicator away from the market structure. Because of this behavior, range clamping, and the loss of comparative history I prefer to shy away from oscillator style indicators. The Money Flow Line instead gives you all of the history so you may compare and see the broader trend without sharp snaps in history based on an arbitrary period setting.
Why is this better? This produces a no-lag indicator that isn't subject to the harsh skewing produced by they Money Flow Index's period calculation. It doesn't lose history like MFI or EFI, is clear about the trend direction, and prefers a "typical price" (averaging the entire range of each bar) rather than whatever happens to be the closing price for a given bar.
How can I use it? The indicator is attempting to measure supply and demand in the markets. No indicator is perfect, but we can use all of the information we have available to make our best predictions. There are only 3 pieces of data the market gives us:
1. Price (action)
2. Volume
3. Time
The Money Flow Line combines all of these data points into a readable rolling data set that attempts to show subtle balance of power shifts based on changes in volume and "smart money" (or "big money") stepping in and out of the picture. Much like PVT, we look for the same things:
- Trend Identification: an up or down trend appears in the MFL
- Confirmations: the MFL agrees with price action in direction and magnitude
- Divergence: the MFL disagrees with price action, indicating a reversal may be coming soon
When applying the smoothing line we can also look for similar things we would with EFI. The primary case would be to look for the MFL to jump very far away from the mean (a high magnitude movement) which indicates that price may be reverting towards the mean soon (a "mean reversion"). On the other hand, it may indicate strength in the current price direction. All of these predictions depend heavily on price action and market structure. Good luck!

Bogdan Ciocoiu - MakaveliDescription
This indicator integrates the functionality of multiple volume price analysis algorithms whilst aligning their scales to fit in a single chart.
Having such indicators loaded enables traders to take advantage of potential divergences between the price action and volume related volatility.
Users will have to enable or disable alternative algorithms depending on their choice.
Uniqueness
This indicator is unique because it combines multiple algorithm-specific two-volume analyses with price volatility.
This indicator is also unique because it amends different algorithms to show output on a similar scale enabling traders to observe various volume-analysis tools simultaneously whilst allocating different colour codes.
Open source re-use
This indicator utilises the following open-source scripts:

Bogdan Ciocoiu - GreuceanuDescription
This indicator is an entry-level script that simplifies volume interpretation for beginning traders.
It is a handy tool that removes all the noise and focuses traders on identifying potential smart money injections.
Uniqueness
This indicator is unique because it introduces the principle of a moving average in the context of volume and then compares it with tick-based volume.
Its uniqueness is reflected in the ability to colour code each volume bar based on the intensity of each relevant (volume) unit whilst comparing it with the volume moving average.
Another benefit of this indicator is the colour coding scheme that removes volume below a particular threshold (default set to 1) under the volume moving average.
In addition to the above features, the indicator differentiates the colour of each bar by price direction.
Open source re-use
To achieve this functionality several open source indicators have been used an integrated within the current one.
RVOL Relative Volume - IntradayHello All,
Relative Volume is one of the most important indicators and Traders should check it while trading/analyzing. it is used to identify whether the volume flows are increasing or decreasing. Relative volume measures current volume in relation to the “usual” volume for this time of the day. What is considered “usual"? For that, we have to use a historical baseline known as the average daily volume. That means how much volume a security does on a daily basis over a defined period. (This scripts runs on the time frames greater or equal 1 minute and less than 1 day)
The common definition for real-time relative volume is: Current volume for this time of day / Average volume for this time of day. It does not mean taking the volume (for example) from 10:30 am to 10:45 am and comparing it to what it does from 10:30 am to 10:45 am every day. What it truly means is to compare cumulative volumes. Therefore, this is the precise definition of real-time relative volume:
Current cumulative volume up to this time of day / Average cumulative volume up to this time of day
What should we understand while checking RVOL;
- Relative volume tell us if volume flows are increasing or decreasing
- A high relative volume tells us that there is increased trading activity in a security today
- Increased volume flows often accompany higher volatility i.e. a significant price move
Let see an example:
P.S. if you want to get more info about RVOL/Relative Volume then you can search it on the net. While developing the script this was used as reference, you can also check it for more info.
Enjoy!
