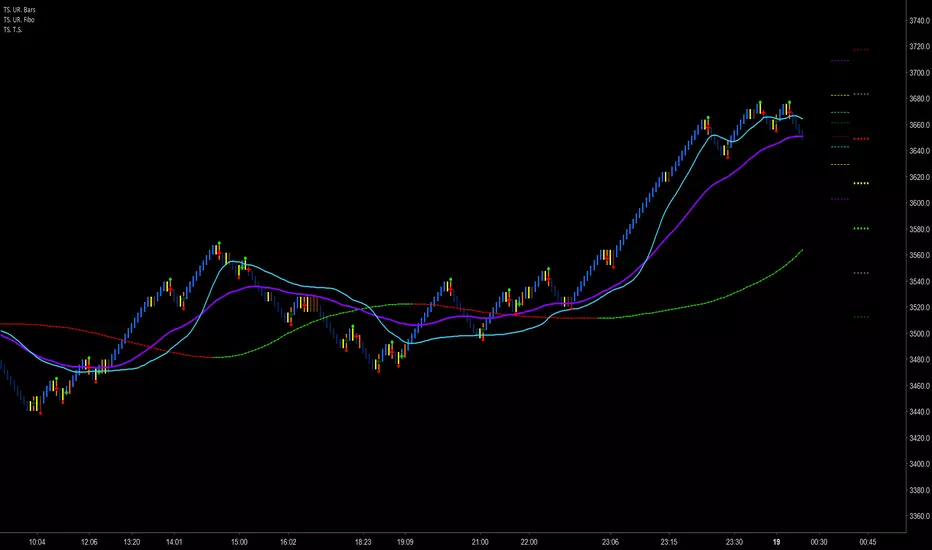
TH_Delta Strategy (Multi-Options TH Strategy Tester)
Strategy Tester is based on TH_RSI Delta, TH_RSIMACD, and a combo of Hull Moving Averages. You will also able to activate include Ichimoku Cloud or a Simple Moving Average.
It also applies colored bars and signals based on overbought/oversold states and RSI crossings.
The tester/signals is disabled by default. You need to activate it in options and then tune the initial capital, % equity options and fees for testing different approaches.
To switch between different tests you just change the number of strategy type and results on screen will be updated accordingly.
You can also define the period of time you need the test to perform on. Default start is Jan 2017 to Jan 2021. Change this as fit.
Remember that the market change pace and volatility. Some timeframes will show you better results with different strat approaches. The same for different kinds of markets/securities.
Hồi quy tuyến tính

Trader Set - Trailing StopThis is the last tool for my methodology. It provides additional levels of support / resistance that you can use for trailing stop. Like every single tool in this toolbox and methodology, the formula being used is unique and totally original and you can't find it any where else.
Please don't contact me for getting access to these tools, they are only available for my students. Right now, the English version of the website and learning material is under development and soon, when they are ready I'll post a comment under every single script related to this methodology for those who are interested in participating for the course.
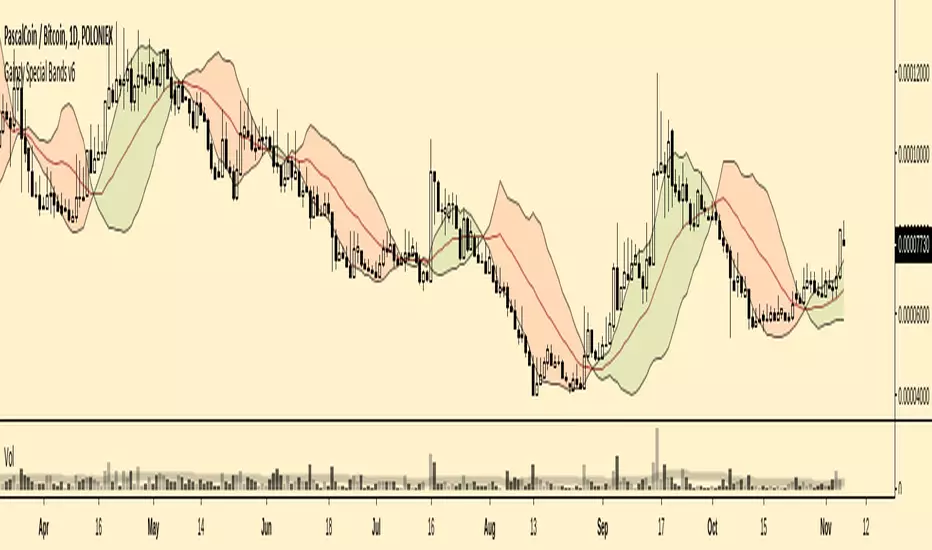
Gainzy Special Bands v6Gives entry & exit signals based on price action. Based on the idea of moving average mean reversions. Uses logarithmic linear regressions.
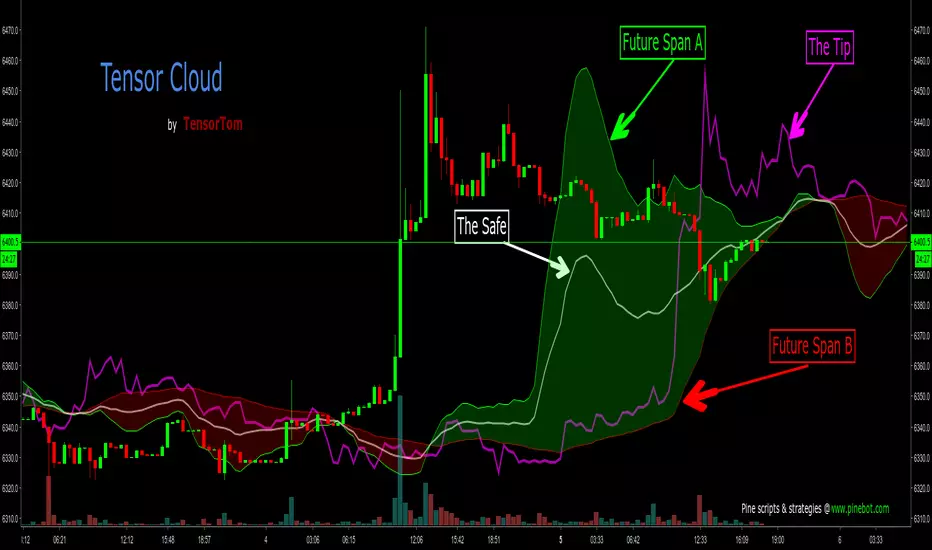
Tensor CloudIntroducing the Tensor Cloud. This is probably the best indicator I've come up with so far. I'm really proud of it. Ichimoku is a brilliant system. It's been around for over half a century and I praise Goichi Hosoda for his brilliant work. However, it's time for something new. I love math and this indicator really showcases that. The Tensor Cloud is an indicator of its own. It is not related to Ichimoku at all. The only thing they have in common is that they both form clouds. The maths in Tensor Cloud are 100% apart.
The Tensor Cloud is mostly comprised of some special forms of linear regression. Let's do a rundown.
Future Span A (Green)
This is one predictor using a linear regression technique. Future Span A is one of the two lines that makes up a Tensor Cloud. From here on out it will traditionally be colored green. It can be used as both a predictor on its own and comprising the Tensor Cloud. This can also be viewed as sort of a long signal when crossing up Future Span B. This line can also be used to help identify levels of support and resistance.
Future Span B (Red)
This is another form of linear regression meant specifically to work alongside Future Span A. This is the second line that comprises a Tensor Cloud. From here on out it will traditionally be colored red. It can be used both as a predictor on its own and comprising the Tensor Cloud. This can also be viewed as sort of a short signal when crossing down through Future Span A. This line can also be used to help identify levels of support and resistance.
Safe (White)
The Safe is a moving average taken of Future Span A and Future Span B. It is highly predictive. From here on out it will traditionally be colored white.
Tip (Fuchsia)
This is yet another form of regression and is highly predictive. The Tip can also be used to help judge trend strength and probability of reversal. More study is of course needed. More on that later in this description. From here on out it will traditionally be colored fuchsia. This line can also be used to help identify levels of support and resistance.
The Tensor Cloud
The space between Future Span A and Future Span B is shaded in green or red, depending on which Future Span is on top. If Future Span A is on top, the Tensor Cloud will be green. This is considered a long signal. If Future Span B is on top, the Tensor Cloud will be colored red. This is a short signal. Attention should also be given to other factors such as:
The position of price in relation to the Tensor Cloud (Under, inside or above).
The position of Tip in relation to the Tensor Cloud.
Crosses of Future Span A and Future Span B.
Tensor Twist
Whenever Future Span A and Future Span B cross (In either direction), this is called a Tensor Twist. If Future Span A is crossing up, this is a long Tensor Twist. If Future Span B is crossing up, this is a short Tensor Twist.
Closing Summary
Much study needs to be done. This is a brand new technique. It's up to all of you to help figure out the best ways to use it. I may still add other components to this indicator but it's pretty solid as is. You will notice that the two integer inputs are set to 27. Twenty-seven is a very important number in mathematics. The details of that are beyond the scope of this description but from here on out, the traditional setting for those will be 27. You will notice that I am not yet releasing the source code to this indicator. For now, it will remain protected. Once I have enough feedback and we're all happy with the final result, I will release the code for the world to have. I have no wish of keeping this closed-source (As profitable as that might be). I just want it to help as many people as possible.
Please share this on social media so we can attract as many testers to give feedback as possible. For publishing this for free, that's all I ask in return. That way it will be as solid as possible when I release the source code.
Enjoy!
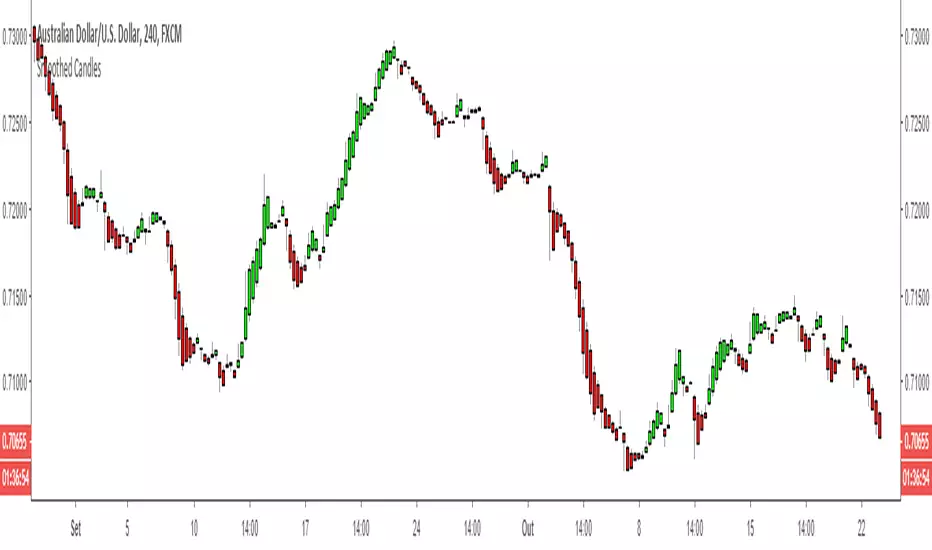
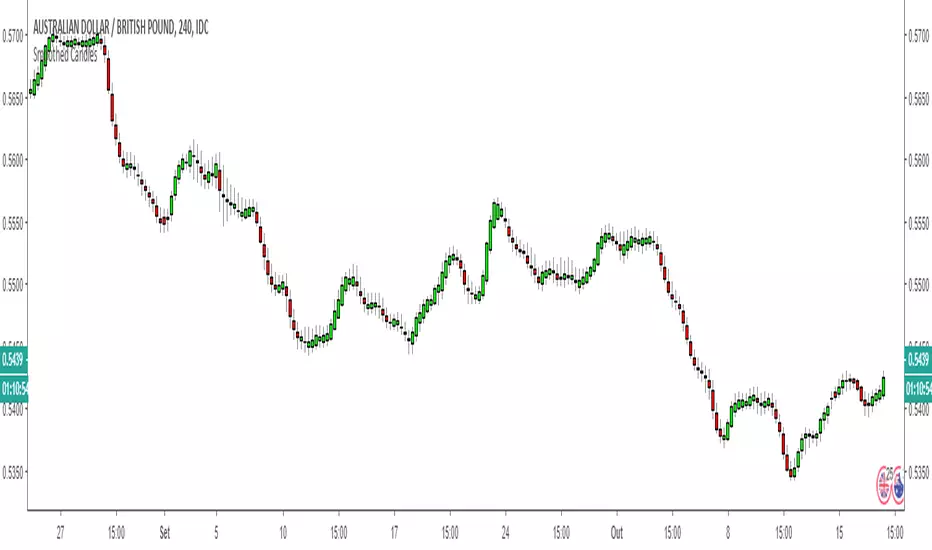
Smoothed CandlesIt is a graphical indicator used to identify trends and pullbacks. Through it, it is possible to eliminate the noises and clearly see the smoothed pattern.
How should I use it ? This is just a example to be used with this indicator.
Let's assume that we are looking for sell opportunities.
step 1: identify some (at least 3) positives (green) candles with a good volume, excluding consolidation regions.
step 2: wait for negative (red) candles with a good volume and also all previous candles must be by majority green.
step 3: wait for pullback with high volume or consolidation region to close the position.
FX:AUDUSD
The example can be better described in the image below:
FX:EURUSD
Another example os use, displayed in the image below:
FX:EURJPY
Look how makes it easy to identify tops and bottoms.
BITFINEX:BTCUSD
Very easy to indetify trends:
OANDA:GBPUSD
Very easy to indetify pullbacks:
FX_IDC:AUDGBP
It can be used with almost of pairs!
You can buy the script here:
502a96d9.ngrok.io
Smoothed CandlesIt is a graphical indicator used to identify trends and pullbacks. Through it, it is possible to eliminate the noises and clearly see the smoothed pattern.
How should I use it ? This is just a example to be used with this indicator.
Let's assume that we are looking for sell opportunities.
step 1: identify some (at least 3) positives (green) candles with a good volume, excluding consolidation regions.
step 2: wait for negative (red) candles with a good volume and also all previous candles must be by majority green.
step 3: wait for pullback with high volume or consolidation region to close the position.
FX:AUDUSD
The example can be better described in the image below:
FX:EURUSD
Another example os use, displayed in the image below:
FX:EURJPY
Look how makes it easy to identify tops and bottoms.
BITFINEX:BTCUSD
Very easy to indetify trends:
OANDA:GBPUSD
Very easy to indetify pullbacks:
FX_IDC:AUDGBP
It can be used with almost of pairs!
If you are interested in purchase, access the link below:
2450ca2f.ngrok.io
CMF+CMF+ is a CMF study enhanced with a linear regression moving average.
Default Settings:
CMF: 13
Linear Regression of CMF: 34
Activate Vertical Bar Highlights and/or Signal Flags for:
- CMF Oversold/Overbought. (Default: Highlight Bar)
- CMF Extended Oversold/Overbought. (Default: Highlight Bar)
- CMF crossing its Linear Regression . (Default: Signal Flag)
Users can also do extra tuning in Style Section of Format options.
To use this indicator we need to observe the market's behaviour and identify which settings are fit for the timeframe and type market you trading.
Recommended suggested settings
CMF: 13/14
Linear Regression of CMF: 34/21
The market behaves differently when the pacing changes, volatility change and, when it trends or when it ranges. Develop an understanding of it with the help of this study.
Avoid risking more than 1% per trade. Be responsible for always making a priority about protecting capital and managing risk.

MFI+MFI+ is a MFI study enhanced with a linear regression moving average.
Default Settings:
MFI: 13
Linear Regression of MFI: 34
Activate Vertical Bar Highlights and/or Signal Flags for:
- MFI Oversold/Overbought. (Default: Highlight Bar)
- MFI Extended Oversold/Overbought. (Default: Highlight Bar)
- MFI crossing its Linear Regression. (Default: Signal Flag)
Users can also do extra tuning in Style Section of Format options.
To user this indicator we need to observe the market's behaviour and identify which settings are fit for the timeframe and type market you trading.
Recommended suggested settings
RSI: 13/14
Linear Regression of RSI: 34/21
The market behaves differently when the pacing changes, volatility change and, when it trends or when it ranges. Develop an understanding of it with the help of this study.
Avoid risking more than 1% per trade. Be responsible for always making a priority about protecting capital and managing risk.
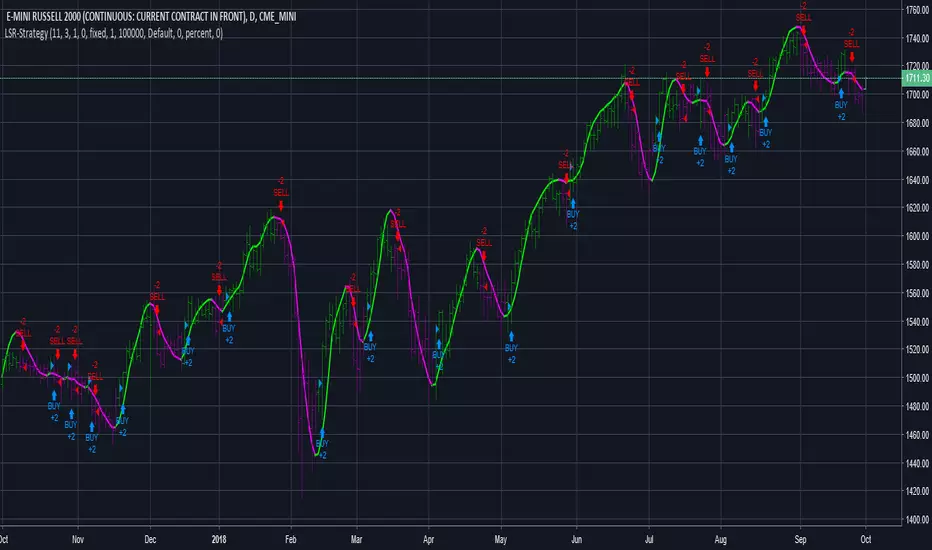
B3 Least Squares Regression - "Price Leading MovAvg"B3 Least Squares Regression or "LSR" is very similar to the mid-line at the end of a linear regression channel, except that in a linear regression you cannot see the history of the regression well. There is also the linear regression and least squares curves in some platforms, and this would also be a similar indicator. The smoothness of my indicator and the back-to-basics approach to the mathematics sets it apart from the others. The look of this MA on a chart speaks for itself.
Some people like the flow of this indicator, as it will actually shoot out ahead of price. Most moving averages trail the price action; this one doesn't do that for long before it catches price or begins to lead price. It isn't necessarily a future price predictor; think of it as a slope stylist. The slope of this indicator determines all painting and signals for the strategy. There are two available versions: with or without order placement.

B3 LSR Strategy- "Price Leading MovAvg"B3 Least Squares Regression or "LSR" is very similar to the mid-line at the end of a linear regression channel, except that in a linear regression you cannot see the history of the regression well. There is also the linear regression and least squares curves in some platforms, and this would also be a similar indicator. The smoothness of my indicator and the back-to-basics approach to the mathematics sets it apart from the others. The look of this MA on a chart speaks for itself.
Some people like the flow of this indicator, as it will actually shoot out ahead of price. Most moving averages trail the price action; this one doesn't do that for long before it catches the price or begins to lead price. It isn't necessarily a future price predictor; think of it as a slope stylist. The slope of this indicator determines all painting and signals for the strategy. There are two available versions: with or without order placement.
Chande Kroll R-Squared IndexChande Kroll R-Squared Index script.
This indicator was originally developed by Tushar S. Chande and Stanley Kroll (see their book `The New Technical Trader`, Chapter 2: `Linear Regression Analysis`).

linear MultiTFThis is linear MTF ..
just change the setting of the TF that youy want.. similar idea to heiken but i hope this one is not repainting:)

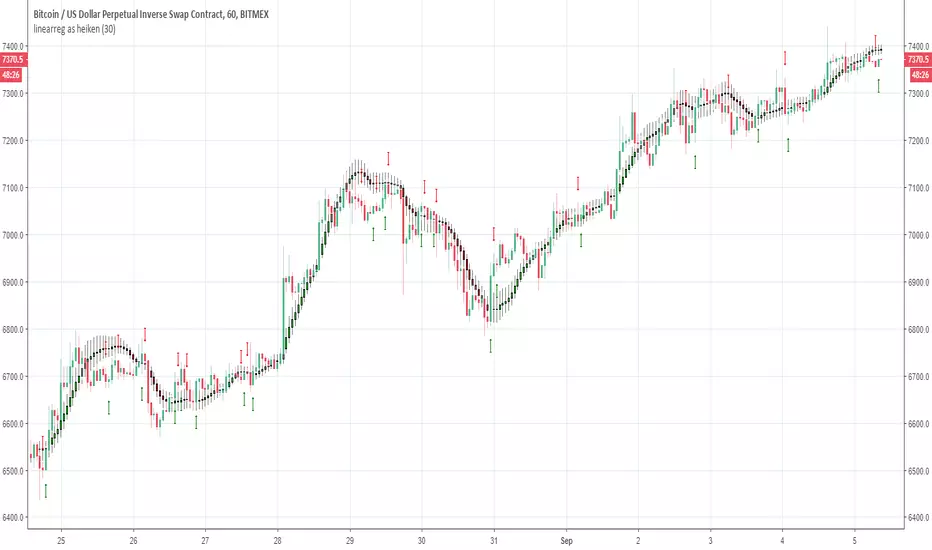
linearreg as heikenLinear regression as similar to heiken candles, arrow up (green) or down (red) show the trends
LinearSARThis is colur coding of linear model and Sar . it good for a template to make upon it better models
also it a great model for long or short on bitmex
so have fun

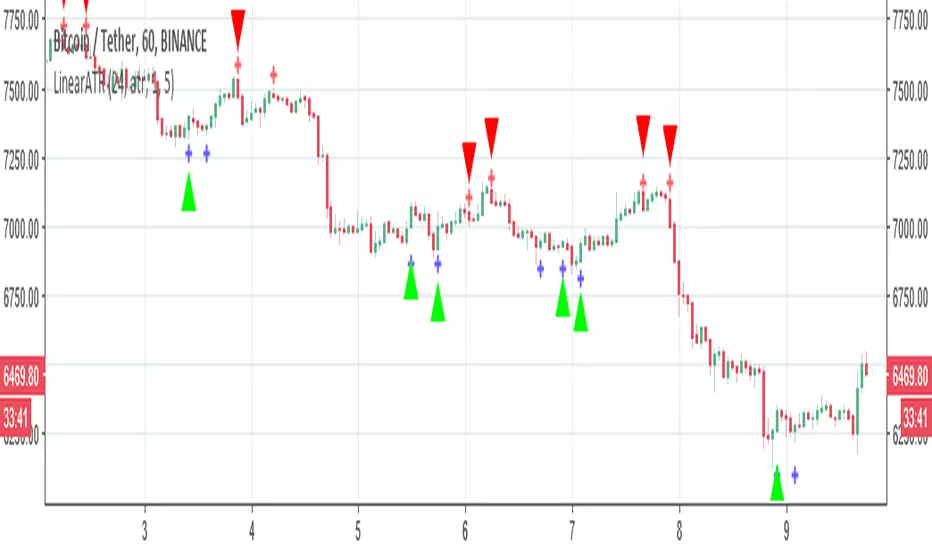
LinearATRv1So in this update model I did the following: add another ATR and put another linear slope
the reason for that is to have one more extra buy and sell point that run on different speed. this in theory can help us to make design different entry or exit for different situation (bear or bull market) also we can design one system only for exit and one system only for buy
big lime and red arrow =long and up in allert or short and down
small green and orange=long1 and up1 in allert and short1 and down1
added bulish and bear zone by the linear regression (set it to 20) i sometime set it to 50 to see larger picture:) (lenc)
my advice is for each coin or stock to set by the desire time frame the setting. remember that the buy is buy the ATR logic so if you make it shorter it will buy more . longer buy less. same thing on linear regreesion slope
I hope you will like it
have fun

LinearATRThis model based on ATR donochian signal and linear regression slope
you can make the model buy less or more just by making either the length of either shorter or longer
alerts inside
in next model i will try to make it with some more stuff
linear-heikenThis model is based on two things
1. Heiken-Kaufman model made by marco (seen in red green arrow)
2. the colour coding is linear regression (green-up period) and (yellow-down period)
alerts inside

LR ChannelScript draws actual positions of linear regression channel boundaries and doesn't repaint.
Green lines color - for a positive slope of standard linear regression channel, red - for a negative slope.

Linear Regression Channel - RKSell when turns red.
Buy when turns green.
Don't be greedy, keep booking profit.
Gray means don't trade.

Linear Regression Cloud [R1984]TradingView Pine script to compare fast vs slow linear regression lines measured in days.
This indicator compares fast and slow linear regression lines, and that's it!
The fast line crossing above the slow line is generally bullish. The fast line crossing below the slow line is generally bearish. The lines and the space between them tend to act as resistance and support relative to the price movement against them.
30 days as the fast line and 60 days as the slow line appear to work well for BTC/USD. Check out multiples of that too: 15/30, 45/90, and 60/120.
Source code available here: github.com


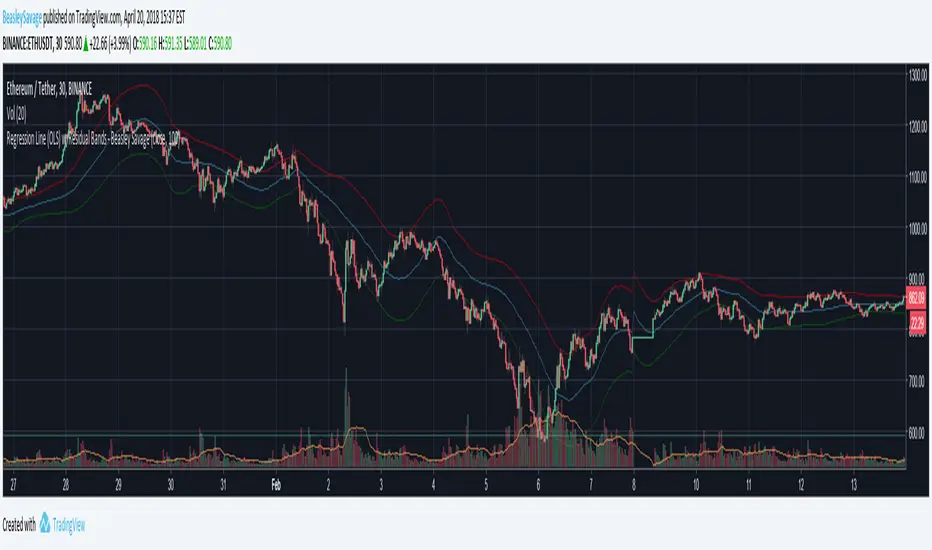
Regression Line (OLS) w/Residual Bands - Beasley SavagePlots linear regression "line of best fit" for a given source and length. Also plots the standard deviation of residuals as upper and lower bands. For some reason it's not plotting the lines exactly where the values are, so I wouldn't recommend using it as a purely visual indicator, but it could be used in strategies. A quick implementation of a strategy buying when the close crossed over the lower band and selling when close crossed under the upper band resulted in ~60-70% trade accuracy, not taking into account commission/slippage.
If anyone knows how to fix the lines not plotting accurately please let me know :)
Regression OscillatorRegression Oscillator indicator script.
This indicator was originally developed by Richard Goedde (Stocks & Commodities V.15:3, Timing A Stock Using The Regression Oscillator).
