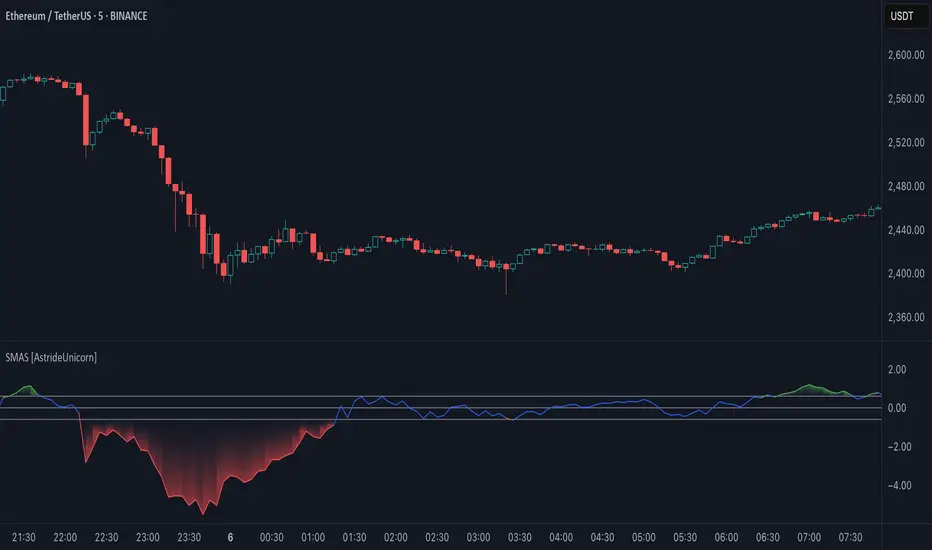
Simple Moving Average Slope [AstrideUnicorn]The Simple Moving Average Slope indicator (SMAS) is a technical analysis tool designed to help traders detect the direction and strength of the current trend in the price of an asset. It is also a great tool for identifying sideways markets. The indicator plots the slope of a simple moving average (SMA) of the closing prices over a specified time period. The slope is normalized by dividing it by the standard deviation of the slope over a longer time period.
HOW TO USE
Traders can use the Simple Moving Average Slope indicator in various ways. One common way is to look for bullish or bearish signals. A bullish signal occurs when the normalized slope rises above a predetermined threshold, resulting in the indicator turning green, indicating an upward trend in the market. Conversely, a bearish signal is generated when the normalized slope falls below the negative value of the threshold, causing the indicator to turn red, signaling a downtrend in the market. When the normalized slope falls between the positive and negative threshold values, a neutral signal is generated, indicating that the market is moving sideways. This can help traders avoid false trend signals from other indicators and strategies that may occur when the market is in a sideways regime. Additionally, traders can use the Simple Moving Average Slope indicator in conjunction with other technical indicators to confirm the trend direction.
SETTINGS
Window - specifies the number of bars used to calculate the SMA slope. The default value is 20.
Threshold - specifies the threshold value used to generate the bullish and bearish signals. The default value is 0.6. Traders can adjust these settings based on their trading strategy and the asset being analyzed.
Trendtrading
Angle-based Trend IndicatorI couldn't find this anywhere else, at least not in the simple way I wanted it.
1. choose a source
2. choose a look-back period
3. choose an angle
The indicator will show you the degree of the trend of the look-back period, and color the line according to bearish or bullish. Also, this is my first script, please be kind.

Trend Reversal System with SR levelsHello All,
This is the Trend Reversal System with Support/Resistance levels script. long time ago I published it as closed source but now I upgraded it and and published as open-source with a different name. I hope it would be useful for you all while trading/analyzing.
The script has some parts in it: Setup, Count, SR levels, Risk levels & Targets . Now lets check them:
Setup Part: it has two part, Buy or Sell Setup. one of them can be active only. Buy setup: if current close checks if current is lower/equal than the close of the 5. bar. if yes then the script increases number of buy setup. and if it reaches 9 then the script checks if current low is lower/equal than the lows of last 3. and 4. bars, or if the low of the last bar is lower/equal than the lows of last 3. and 4. bars. if yes then the script increases the buy setup by 1. if these conditions met then it puts the label 'S' , same for Sell setup. S labels on both setup are potential reversals.
Count Part: If buy or sell setup reaches the 9 then Count part starts from 1. lets see buy count: If current close is lower/equal than the low of the 3. bar and buy count is lower than 12 or low of the bar 13 is less than or equal to the close of bar 8 then buy count increase or it's completed. if it's completed then the script puts C label, and it's potential reversal. of course there are some conditions that can cancel the count buy/sell or recycle/restart.
By using Setup and Count levels the script can show Support/Resistance Levels, Risk levels & Targets. SR levels are potential reversal levels.
Lets see some example screenshots:
Support/Resistance levels:
Potential Reversal levels and how setup/counts are shown:
Count part can recycle and the script shows it as 'R' , ( you can see the conditions for Recycle in the script ):
Count can be cancelled and and it's shown as 'x'
If the scripts find 9 on Setup or 13 on Count then it checks if it's a good level to buy/sell and if it decides it's good level then it shows TRSSetup Buy/Sell or TRSCount Buy/Sell and also shows the target. in following example the script checks and decide it's a good level to take long position. it can be aggressive or conservative, Conservative is recommended.
Enjoy!

RiverFlow ADX ScreenerRiverFlow ADX Screener, Scans ADX and Donchian Trend values across various Timeframes. This screener provides support to the Riverflow indicator. Riverflow concept is based on Two indicators. Donchian Channel and ADX or DMI.
How to implement?
1.Donchian Channel with period 20
2. ADX / DMI 14,14 threshold 20
Entry / Exit:
1. Buy/Sell Signal from ADX Crossovers.
2. Trend Confirmation Donchian Channel.
3. Major Trend EMA 200
Buy/Sell:
After a buy/sell is generated by ADX Crossover, Check for Donchian Trend. it has to be in same direction as trend. for FTT trades take 2x limit. for Forex and Stocks take 1:1.5, SL must be placed below recent swing. One can use Riverflow indicator for better results.
ADX Indicator is plotted with
Plus: Green line
Minus: Red Line
ADX strength: plotted as Background area.
TREND: Trend is represented by Green and Red Area around Threshold line
Table:
red indicates down trend
green indicates up trend
grey indicates sideways
Weak ADX levels are treated sideways and a channel is plotted on ADX and PLUS and MINUS lines . NO TRADES are to be TAKEN on within the SIDEWAYS region.
Settings are not required as it purely works on Default settings. However Donchian Length can be changed from settings.
Timeframes below 1Day are screened. Riverflow strategy works on timeframe 5M and above timeframe. so option is not provided for lower timeframes.
Best suits for INTRADAY and LONG TERM Trading

ADX Trend FilterADX Trend Filter Indicator is a traditional ADX indicator with a different presentation. its consist of two indicators EMA TREND and ADX / DMI
About Indicator:
1. BAND / EMA band to represent EMA Trend of EMA-12 and EMA-50
(Band is plotted at level-20 which is the Threshold level of DMI / ADX indicator)
2. Histogram showing the direction of ADX / DMI trend
3. Area behind the histogram showing ADX/DMI strength
How to use?
1. Histogram represents current Trend Red for Bearish / Green for Bullish
2. Area behind the histogram represents Strength of ADX / DMI Threshold level is 0-20(represented as band). (Area below the Band is Sideways)
3. Band represents the current MA Trend.
4. Buy Sell signals are plotted as triangles in red/green obtained from ADX / DMI Crossovers
Buy Signal (Green Triangle on band- ADX Crossover)
1.Band below Histogram must be Green
2.Histogram must be green
3.Area behind histogram must be above the lower trend band (20level) and visible
Sell Signal (Red Triangle on band- ADX Crossover)
1.Band below Histogram must be Red
2.Histogram must be Red
3.Area behind histogram must be above the lower trend band (20level) and visible
Alerts provided for ADX crossovers.

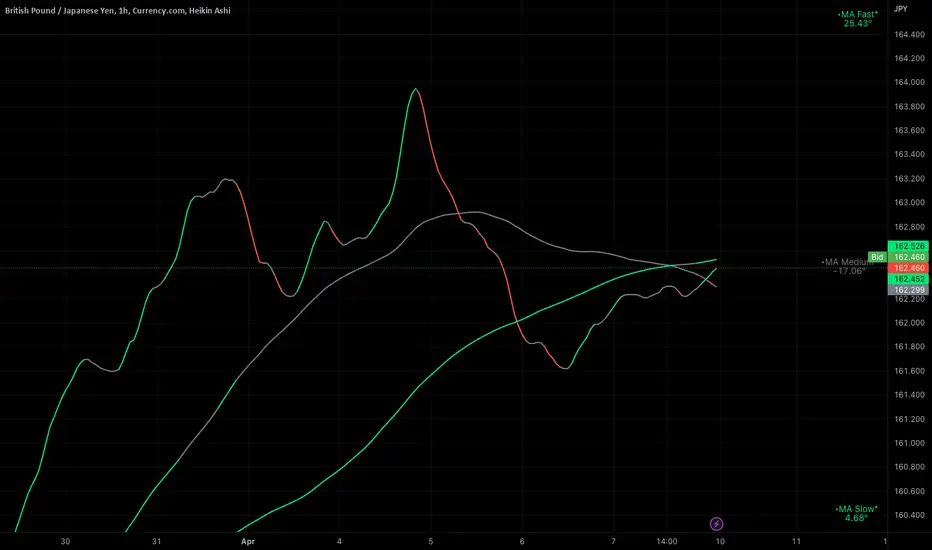
Ignition Cha Cha ChaIgnition Cha Cha Cha (ICCC) is a 3 color coded moving average indicator which numerically quantify the angle of their trends. I have labeled them as fast, medium and slow. The trend colors are Green for bullish, Red for bearish and Grey for sideways. The sideways movement can be user defined for all 3 in the settings under Threshold. If you regard for example anything under 10º as sideways then place 10 in the corresponding threshold and any angle under 10º will give a grey moving average and a grey labeled text. I use this chart in several ways. If you don't want moving averages all over your Chartistic Masterpiece you can turn off the plots and leave the numeric angles which will give you an overview of the trend. Conversely if you want to make the ultimate trend chart you can setup a 4 chart layout, Weekly, Daily, 12 hour and 4 hour and add the indicator with 200/50/25 moving averages and look for confluence. I find the best way for this is turn off the candles and use the moving averages with the numeric labels. You also have the ability to turn off and on different aspects of the indicator so that there is good control over its look. Also I have given the indicator lots of Alert presets for all 3 of the moving averages so you can avoid demented screen-stairing. Please forgive the name, my mother made me do Ballroom dancing lessons as a kid.
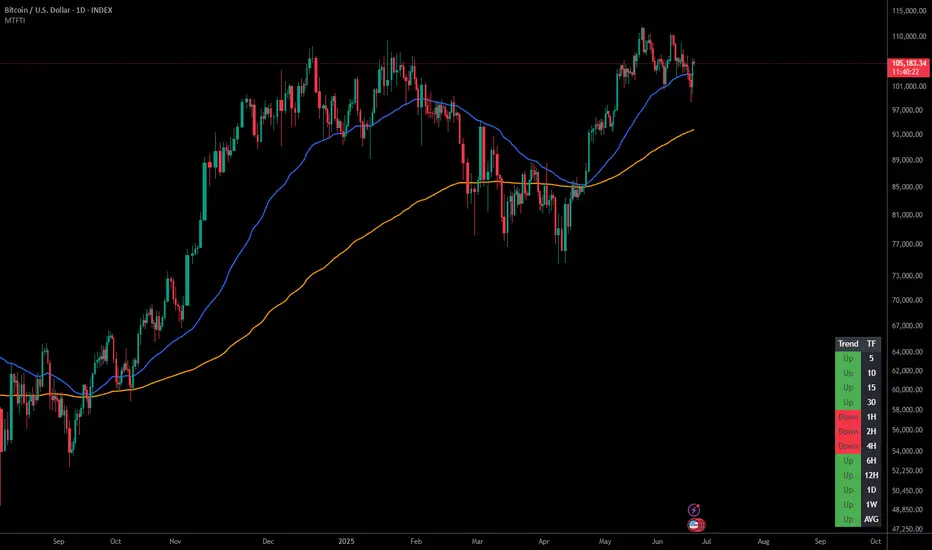
Multi-Timeframe Trend IndicatorThe Multi-Timeframe Trend Indicator (MTFTI) is a trend analysis tool designed to help traders quickly and easily assess the market direction across multiple timeframes. With the help of a table to visualize the trends on different timeframes.
Key features:
Multi-timeframe trend indicator for the following timeframes: 5 minutes, 15 minutes, 30 minutes, 1 hour, 2 hours, 4 hours, 6 hours, 12 hours, 1 day, and 1 week and average.
Displays trends for selected timeframes in a table.
Considers short and long-term exponential moving averages (EMAs) to determine trends.
Calculation of the average trend for all timeframes.
Display of trends with appropriate coloring for better readability (green for "Up", red for "Down", and intermediate shades for neutral or strong trends).
List of Parameters
Customization of the table's position on the screen (top-left, top-right, middle-left, middle-right, bottom-left, bottom-right).
Setting the lengths of the short and long-term exponential moving averages.
Option to activate or deactivate the display of EMAs for better customization (true by default).
Please note that the MTFTI is not a guarantee of future market performance and should be used in conjunction with proper risk management. Always ensure that you have a thorough understanding of the indicator’s methodology and its limitations before making any investment decisions. Additionally, past performance is not indicative of future results.
Rainbow Collection - VioletMoving averages come in all shapes and types. The most basic type is the simple moving average which is simply the sum divided by the quantity. Therefore, the simple moving average is the sum of the values divided by their number.
In technical analysis, you generally use moving averages to understand the underlying trend and to find trading signals. In the case of the Violet indicator, we are using a Hull moving average which is a special variation based on different weights to minimize lag.
The Violet indicator is therefore used as follows:
* A bullish signal is generated whenever the close price surpasses the 20-period Hull moving average while the previous close prices from periods were all below their respective Hull moving average of the period.
*A bearish signal is generated whenever the close price breaks the 20-period Hull moving average while the previous close prices from periods were all above their respective Hull moving average of the period.
The aim of the Violet indicator is to capture reversals as early as possible through a combination of lagged conditions based on the Fibonacci sequence.

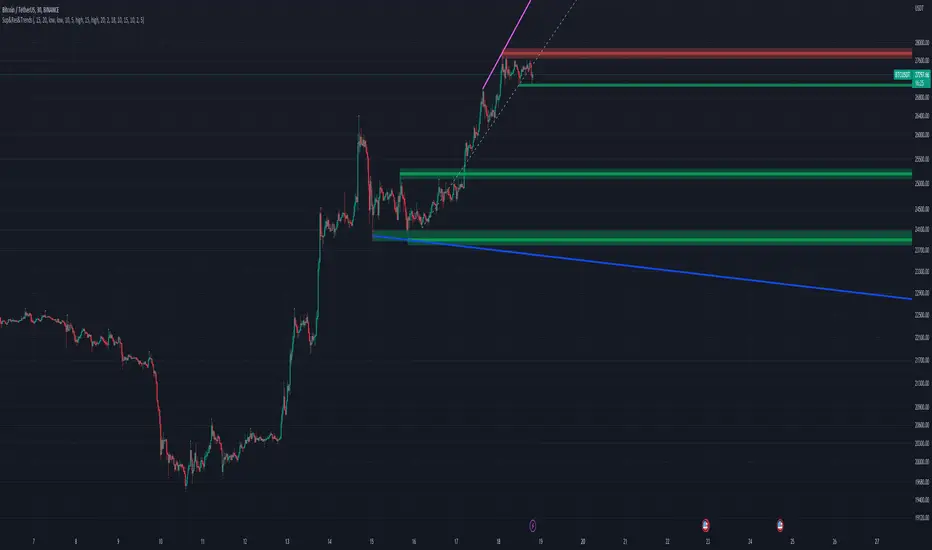
support and resistance on multi timeframe [parsimaj] Description:
support and resistance and trendline on two timeframes by your choice
This indicator is capable of showing you the current and higher timeframe support and resistance by your strategy choice (two timeframes alongside each other). It also helps you to monitor the trend direction in short and long term by trend lines . You can change the depth of every levels and trend lines from the panel. Use this indicator in all markets because it follows the basic principles of levels but is unique in changing second timeframe by your choice.
_its smart , if the levels are too close together ,it will choose the deeper ones for you.
How it works:
By default, there is no higher timeframe and you can select your desire higher timeframe from the panel. Higher timelines will be displayed thicker and your current levels would be thin lines. (Levels that are higher than the current price will be red and those that are lower will be green). The number of levels to display is also by your choice, the default is 4 levels for each timeframe.
We have two types of trend lines , long terms as trend 1 (blue below and purple above trend line )- short term as trend 2(dashed ones).
Bouncing on levels and breaking trend line are the best triggers for entry and exit points.
Setting:
First, choose your higher timeframe then the depth of levels for each time (current and higher), The deeper it is, the more precise the lines. After that you can set the depth of trend lines by your choice. Trend 1 is the longer term So put it deeper and then set the short trend line (dashed ones) if you want to change it.
We have put the settings in the best mode, but you can also change it according to your strategy and inform us about the results.
This indicator has been obtained with hours of effort and codding , hope you enjoy
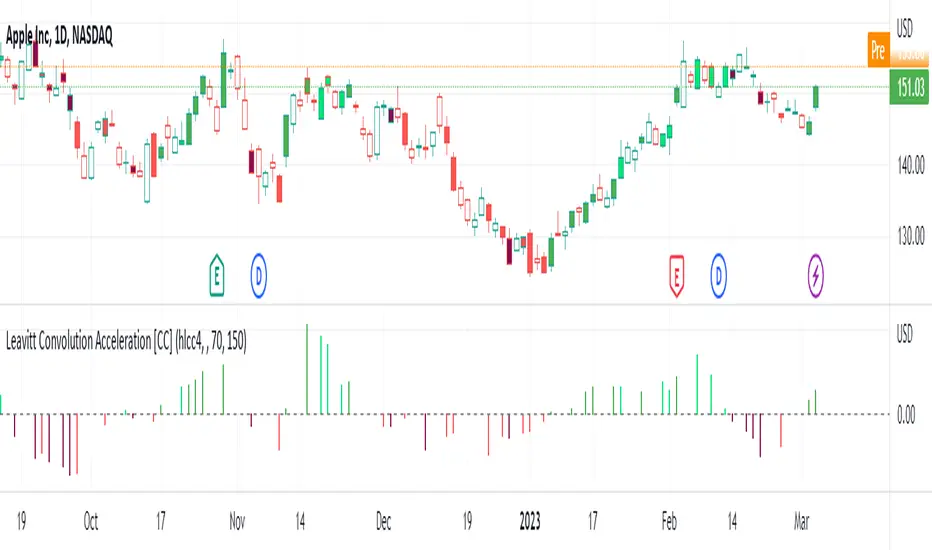
Leavitt Convolution Acceleration [CC]The Leavitt Convolution Slope indicator was created by Jay Leavitt (Stocks and Commodities Oct 2019, page 11), who is most well-known for creating the Volume-Weighted Average Price indicator. This indicator didn't have a good explanation or description so I custom-coded most of it. The way it works is it will give trend spikes in the direction of the underlying trend. If you don't see a spike then it means that the stock isn't trending at the moment. One possible avenue to explore with this indicator is judging the size of the trend spike before you open a position in that direction (or the opposite direction if you are shorting). I added a normalization function using code from a good friend @loxx that I recommend leaving on but feel free to experiment with it. I have color coded the lines to turn light green for a standard buy signal or dark green for a strong buy signal and light red for a standard sell signal, and dark red for a strong sell signal.
This is another indicator in a series that I'm publishing to fulfill a special request from @ashok1961 so let me know if you ever have any special requests for me.
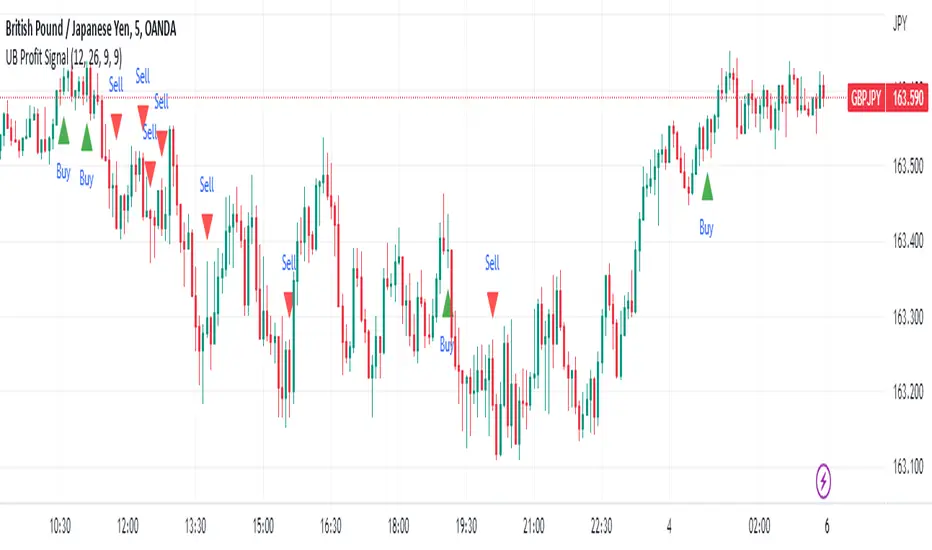
UB Profit Signal IndicatorThe UB Profit Signal indicator is a technical analysis tool designed to identify potential buy and sell signals in the market. The indicator is based on four technical indicators - Moving Average Convergence Divergence (MACD), Relative Strength Index (RSI), Bollinger Bands (BB), and volume moving average.
The script starts by defining input variables such as MACD Fast Length, MACD Slow Length, MACD Signal Length, RSI Length, etc. These variables are used to customize the indicator based on the user's preference.
The MACD is calculated using the ta.macd function, which returns three variables: the MACD Line, Signal Line, and Histogram. The MACD line is calculated as the difference between two exponential moving averages of the price. The signal line is a moving average of the MACD line. The histogram shows the difference between the MACD line and the signal line.
The RSI is calculated using the ta.rsi function, which calculates the RSI value based on the number of periods specified in the RSI Length input variable. The RSI is a momentum oscillator that measures the speed and change of price movements.
The Bollinger Bands are calculated using the ta.sma and ta.stdev functions. The Simple Moving Average (SMA) is calculated using the close price over 21 periods, while the Standard Deviation is calculated using the close price over the same 21 periods. The upper and lower bands are then calculated based on the SMA and Standard Deviation.
Finally, the buy and sell signals are generated based on specific conditions that combine the MACD, RSI, and BB values. For example, a buy signal is generated when the RSI value is greater than 30, the volume is greater than the volume moving average, the close price is greater than the 9-period SMA, and the close price is between the upper and lower BBs. Similarly, a sell signal is generated when the RSI value is less than 40, the volume is greater than the volume moving average, the close price is less than the 9-period SMA, and the close price is between the upper and lower BBs.
The buy and sell signals are plotted on the chart using the plotshape function, which creates triangular shapes above and below the bars to indicate the signals. Green triangles indicate a buy signal, while red triangles indicate a sell signal. Overall, the UB Profit Signal indicator can be useful for traders looking to identify potential buy and sell signals in the market and take advantage of price movements.
Swing Indicator (2 before, 1 after) v2 with Dong-DangFeatures
Detection Swing (swing HIGH is the highest bar among 2 bars before and 1 bar after, and swing LOW is the lowest bar among 2 bars before and 1 bar after)
Dong-Dang (The line plot switch between a swing HIGH and LOW ==> represents the price movement)
Fixes
fix swing detection from the last version when there are 2 or more bars that have the same high or low price
======== ======== ========
ฟีเจอร์
การจับสวิง (จะเป็นสวิง HIGH ก็ต่อเมื่อแท่งนั้นสูงกว่า 2 แท่งก่อนหน้า และ 1 แท่งด้านหลัง, และจะเป็นสวิง LOW ก็ต่อเมื่อแท่งนั้นต่ำกว่า 2 แท่งก่อนหน้า และ 1 แท่งด้านหลัง)
ด๊องแด๊ง (คือเส้นที่ลากสลับไปมาระหว่างสวิง High และ Low ==> ใช้เพื่อดูการเคลื่อนที่ของราคา)
สิ่งที่แก้ไข
แก้ไขการจับสวิงจากเวอร์ชันก่อนหน้า ในกรณีที่มีแท่งเทียน 2 แท่ง หรือมากกว่า มีค่า high หรือ low เท่ากัน
======== ======== ========
Credit: Bravo Trade Academy

Strong Tight Closes in Strong UptrendThis indicator helps to visually identify "strong tight closes" in an uptrend. It serves to make it easier to spot not only tight but tight AND strong consolidations in an ongoing uptrend for a potential continuation entry. Please keep in mind the indicator counts with distance between Close values of 2 separate candles, that's why it's called "Tight Back to Back Candles". This doesn't identify "tight close" in a sense of very narrow range between Open and Close of a single candle, not any other volatility measures such as average true range etc.
Caution: This is not a complete strategy, it's only a visual tool for making potential continuation patterns easier to spot.
Conditions:
- Measure the difference between CLOSE values of two candles in percentages
- If the difference is lower than a certain threshold set by the user, (1.3% by default) plot a green cross below the latter candle
Filters:
- Low of both candles must be above 10EMA on the current timeframe
- Both Closes must be in the upper half of the candles' Low to High range
Rekt Edge Reversion BandRekt Edge Reversion band is a technical indicator that utilizes a combination of moving averages and standard deviations to determine optimal entry and exit points in the market. By comparing the current price to its moving average, the indicator identifies potential trends and determines how you can position around them by plotting buy/sell signals and two channels based on user input parameters. The user can choose between Simple Moving Average ( SMA ) or Exponential Moving Average ( EMA ) and select the moving average period, the unit of separation, the multiples of the unit, and other important parameters. The indicator's inputs can be adjusted to suit different trading styles, and it can be used on any time frame. The indicator can be used to identify potential trend reversals or breakouts (or breakdowns) when the price moves outside of the channels. The indicators potential use cases include identifying overbought or oversold conditions. With its ability to provide a clear signal on when to enter and exit a trade, this indicator is a popular tool among traders looking to make more informed and profitable trading decisions. This indicator can also be used in conjunction with other technical analysis tools to confirm or invalidate trading signals.

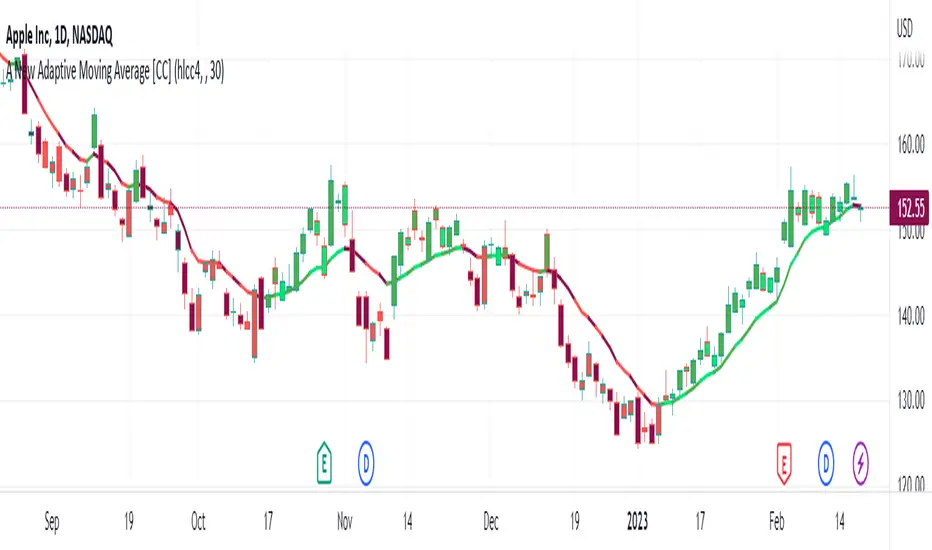
Another New Adaptive Moving Average [CC]The New Adaptive Moving Average was created by Scott Cong (Stocks and Commodities Mar 2023) and this is a companion indicator to my previous script . This indicator still works off of the same concept as before with effort vs results but this indicator takes a slightly different approach and instead defines results as the absolute difference between the closing price and a closing price x bars ago. As you can see in my chart example, this indicator works great to stay with the current trend and provides either a stop loss or take profit target depending on which direction you are going in. As always, I use darker colors to show stronger signals and lighter colors to show normal signals. Buy when the line turns green and sell when it turns red.
Let me know if there are any other indicator scripts you would like to see me publish!

Big 8 Intraday TICKAt the start of each trading day (0930 EST), this indicator calculates the intraday price difference between open and close for the eight largest market cap stocks (AAPL, AMZN, GOOGLE, META, MSFT, NFLX, NVDA, and TSLA), assigns a +/-1 for each, and then plots the cumulative change. An EMA has been added for smoothing purposes that is set to 5 but can be changed. Please note indicator is best used on lower timeframes (15 min or less) and has no applicability to time frames above 1 hour.
The thought behind this indicator is those eight major stocks drive a majority of intraday price change in indices like SPY and QQQ that are heavily weighted towards these stocks, therefore they should be a leading indicator in price change. You can often catch a move in SPY or QQQ one to two bars (on 1 min chart) ahead of the actual move because you see this indicator moving strong to one direction.
It's not perfect as there are divergences you will see when you compare historical charts, but oftentimes those divergences ultimately lead to significant price swings in the same direction as this indicator, so recommend being on watch to pull the trigger when you see those and price confirms.
You can use this indicator in a few ways:
1. Confirmation that your current trade is in the same direction as this indicator
2. Use the zero cross as a trigger for put or call entry
3. Focusing only on calls/longs if the value is above 0, or only puts/shorts if the value is below zero. Just be sure to keep an eye on reversals.
If you have recommendations on how to improve, let me know and I'll do my best to make changes.

A New Adaptive Moving Average [CC]The New Adaptive Moving Average was created by Scott Cong (Stocks and Commodities Mar 2023) and his idea was to focus on the Adaptive Moving Average created by Perry Kaufman and to try to improve it by introducing a concept of effort vs results. In this case the effort would be the total range of the underlying price action since each bar is essentially a war of the bulls vs the bears. The result would be the total range of the close so we are looking for the highest close and lowest close in that same time period. This gives us an alpha that we can use to plug into the Kaufman Adaptive Moving Average algorithm which gives us a brand new indicator that can hug the price just enough to allow us to ride the stock up or down. I have color coded it to be darker colors when it is a strong signal and lighter colors when it is a normal signal. Buy when the line turns green and sell when it turns red.
Let me know if there are any other indicators you would like to see me publish!
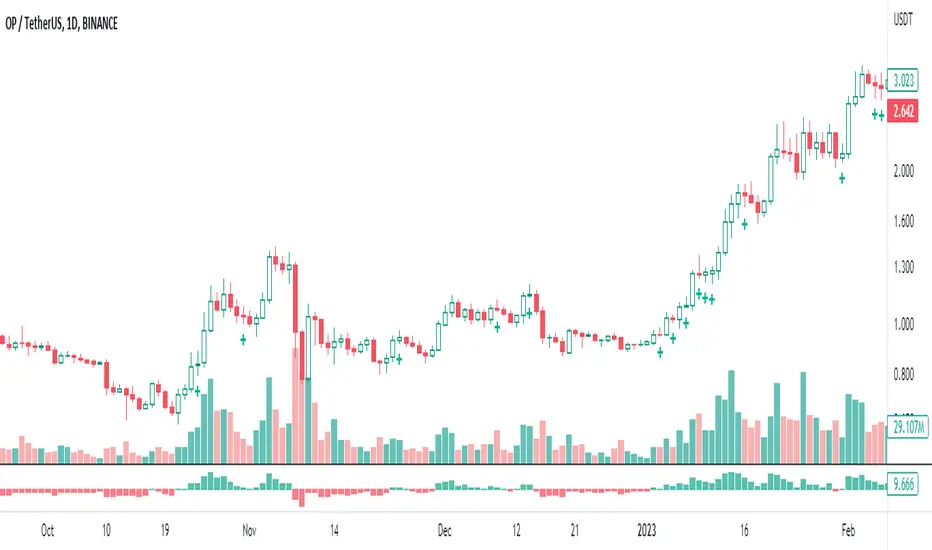
VWAP Supply and Demand ZonesThis is my 1st indicator enjoy.
Description of the VWAP Supply and Demand Zones indicator:
This indicator uses the Volume Weighted Average Price (VWAP) to identify potential supply and demand zones in the market. The VWAP is a popular indicator that shows the average price of a security weighted by volume over a specified period of time. It can be used as a benchmark to measure the efficiency of trading and to identify trends and price levels.
The indicator plots the VWAP as a blue line on the chart, and also plots two other lines above and below it, which represent the upper and lower bounds of the supply and demand zones. The width of these zones can be adjusted by changing the “Zone Width” input parameter.
The indicator also plots shapes on the chart to mark when a supply or demand zone is formed. A supply zone is formed when the price crosses above the VWAP and then falls back below it, indicating that there is more selling pressure than buying pressure at that level. A red triangle is plotted above the bar where this happens, and a red zone is drawn between the previous close and previous VWAP values.
A demand zone is formed when the price crosses below the VWAP and then rises back above it, indicating that there is more buying pressure than selling pressure at that level. A green triangle is plotted below the bar where this happens, and a green zone is drawn between the previous close and previous VWAP values.
The supply and demand zones can be used as potential areas of support and resistance, where traders can look for reversal or continuation signals. For example, if the price enters a supply zone from below, it may indicate that sellers are willing to sell at higher prices, which could lead to a bearish reversal. Conversely, if the price enters a demand zone from above, it may indicate that buyers are willing to buy at lower prices, which could lead to a bullish reversal.
The indicator can be applied to any timeframe or market, but it may work better on higher timeframes where volume data is more reliable. It can also be combined with other indicators or tools to confirm or filter signals.

Trend Oscillatorwhat is "Trend Oscillator"?
it is an indicator for determining the trend.
what it does?
analyzes the price action by reducing it to 4 different situations. Red means strong bear, orange means bearish, yellow means weak bull and green means strong bull. It was developed to help traders who trade in the direction of the trend and its biggest promise is to simplify price action.
how it does it?
He defines 4 different situations as follows. If the velocity of the price is positive and the acceleration is positive, it is a strong bull, if the velocity is positive and the acceleration is negative, it is a weak bull, if the velocity is negative and the acceleration is positive, it is a weak bear, if both velocity and acceleration are negative, it is a strong bear.
2 for strong bull
1 for the weak bull
-1 for weak bear
Creates a function that takes values of -2 for the strong bear. this function is the velocity of the principal indicator, and then the integral of this function forms the principal indicator.
how to use it?
"source" is used to change the source of the indicator,
"length" makes the indicator give a later but less signal.
you can use it to follow or analyze the trend. colors make it easy to use. learns about current or past trends by looking at colors. Like any trend indicator, it can give unsuccessful signals in a horizontal trend.

Dynamo
╭━━━╮
╰╮╭╮┃
╱┃┃┃┣╮╱╭┳━╮╭━━┳╮╭┳━━╮
╱┃┃┃┃┃╱┃┃╭╮┫╭╮┃╰╯┃╭╮┃
╭╯╰╯┃╰━╯┃┃┃┃╭╮┃┃┃┃╰╯┃
╰━━━┻━╮╭┻╯╰┻╯╰┻┻┻┻━━╯
╱╱╱╱╭━╯┃
╱╱╱╱╰━━╯
Overview
Dynamo is built to be the Swiss-knife for price-movement & strength detection, it aims to provide a holistic view of the current price across multiple dimensions. This is achieved by combining 3 very specific indicators(RSI, Stochastic & ADX) into a single view. Each of which serve a different purpose, and collectively provide a simple, yet powerful tool to gauge the true nature of price-action.
Background
Dynamo uses 3 technical analysis tools in conjunction to provide better insights into price movement, they are briefly explained below:
Relative Strength Index(RSI)
RSI is a popular indicator that is often used to measure the velocity of price change & the intensity of directional moves. RSI computes the relative strength of the current price by comparing the security’s bullish strength versus bearish strength for a given period, i.e. by comparing average gain to average loss.
It is a range bound(0-100) variable that generates a bullish reading if average gain is higher, and a bullish reading if average loss is higher. Values over 50 are generally considered bullish & values less than 50 indicate a bearish market. Values over 70 indicate an overbought condition, and values below 30 indicate oversold condition.
Stochastic
Stochastic is an indicator that aims to measure the momentum in the market, by comparing most recent closing price of the security to its price range for a given period. It is based on the assumption that price tends to close near the recent high in an up trend, and it closes near the recent low during a down trend.
It is also range bound(0-100), values over 80 indicate overbought condition and values below 20 indicate oversold condition.
Average Directional Index(ADX)
ADX is an indicator that can quantify trend strength, it is derived from two underlying indices, known as Directional Movement Index(DMI). +DMI represents strength of the up trend, and -DMI represents strength of the down trend, and ADX is the average of the two.
ADX is non-directional or trend-neutral, which means, it does not follow the direction of the price, instead ADX will rise only when there is a strong trend, it does not matter if it’s an up trend or a down trend. Typical ranges of ADX are 25-50 for a strong trend, anything below 25 is considered as no trend or weak trend. ADX can frequently shoot upto higher values, but it generally finds exhaustion levels around the 60-75 range.
About the script
All these indicators are very powerful tools, but just like any other indicator they have their limitations. Stochastic & ADX can generate false signals in volatile markets, meaning price wouldn’t always follow through with what’s being indicated. ADX may even fail to generate a signal in less volatile markets, simply because it is based on moving averages, it tends to react slower to price changes. RSI can also lose it’s effectiveness when markets are trending strong, as it can stay in the overbought or oversold ranges for an extended period of time.
Dynamo aims to provide the trader with a much broader perspective by bringing together these contrasting indicators into a single simplified view. When Stochastic becomes less reliable in highly volatile conditions, one can cross validate their deduction by looking at RSI patterns. When RSI gets stuck in overbought or oversold range, one can refer to ADX to get better picture about the current trend. Similarly, various combinations of rules & setups can be formulated to get a more deterministic view, when working with either of these indicators.
There many possible use cases for a tool like this, and it totally depends on how you want to use it. An obvious option is to use it to trigger signals only after it has been confirmed by two or more indicators, for example, RSI & Stochastic make a great combination for cross-over or cross-under strategies. Some of the other options include trend detection, strength detection, reversals or price rejection points, possible duration of a trend, and all of these can very easily be translated into effective entry and exit points for trades.
How to use it
Dynamo is an easy-to-use tool, just add it to your chart and you’re good to start with your market analysis. Output consists of three overlapping plots, each of which tackle price movement from a slightly different angle.
Stochastic: A momentum indicator that plots the current closing price in relation to the price-range over a given period of time.
Can be used to detect the direction of the price movement, potential reversals, or duration of an up/down move.
Plotted as grey coloured histograms in the background.
Relative Strength Index(RSI): RSI is also a momentum indicator that measures the velocity with which the price changes.
Can be used to detect the speed of the price movement, RSI divergences can be a nice way to detect directional changes.
Plotted as an aqua coloured line.
Average Directional Index(ADX): ADX is an indicator that is used to measure the strength of the current trend.
Can be used to measure how strong the price movement is, both up and down, or to establish long terms trends.
Plotted as an orange coloured line.
Features
Provides a well-rounded view of the market movement by amalgamating some of the best strength indicators, helping traders make better informed decisions with minimal effort.
Simplistic plots that aim to convey clean signals, as a result, reducing clutter on the chart, and hopefully in the trader's head too.
Combines different types of indicators into a single view, which leads to an optimised use of the precious screen real-estate.
Final Note
Dynamo is designed to be minimalistic in functionality and in appearance, as it is being built to be a general purpose tool that is not only beginner friendly, but can also be highly-configurable to meet the needs of pro traders.
Thresholds & default values for the indicators are only suggestions based on industry standards, they may not be an exact match for all markets & conditions. Hence, it is advisable for the user to test & adjust these values according their securities and trading styles.
The chart highlights one of many possible setups using this tool, and it can used to create various types of setups & strategies, but it is also worth noting that the usability & the effectiveness of this tool also depends on the user’s understanding & interpretation of the underlying indicators.
Lastly, this tool is only an indicator and should only be perceived that way. It does not guarantee anything, and the user should do their own research before committing to trades based on any indicator.

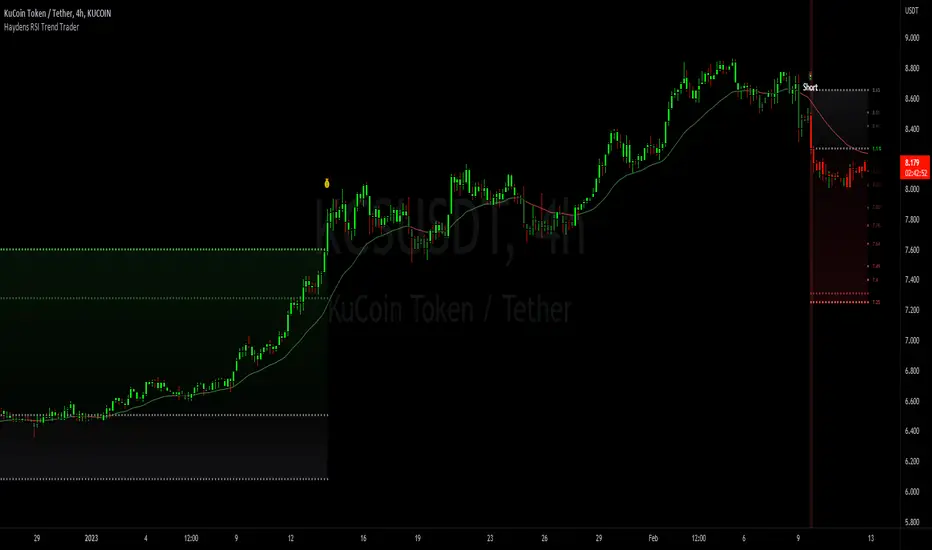
Haydens RSI Trend TraderThis is a simple trend trading companion indicator for Hayden's Advanced RSI, which can be found here:
For best results, please be sure your oscillator and chart companion settings match. Detailed trade information & statistics can be found when hovering over any of the indicator labels. The backtesting results are not calculated the same as TradingView, and the original code can be found here
Shoutout to the following authors for the code snippets that were used in making this indicator: @lazybear @kiosefftrading @Koalafied_3 @mabonyi @Capissimo
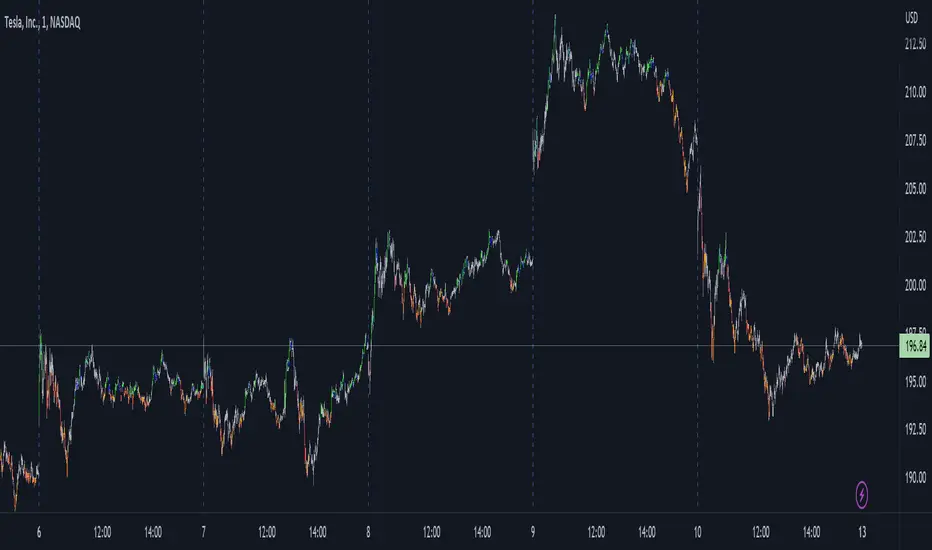
VWAP filtered MACD Bars with positive MACD histogram value and closing above VWAP are colored, long positions should be taken in areas made of those bars.
Similarly, bars with negative MACD histogram value and closing below VWAP are also colored, short positions should be taken there.
This indicator by default should be a part of your trend following trading system.
In the setting you can change colors
Above grow: positive and rising MACD histogram value
Above fall: positive and falling MACD histogram value
Below fall: negative and falling MACD histogram value
Below grow: negative and rising MACD histogram value
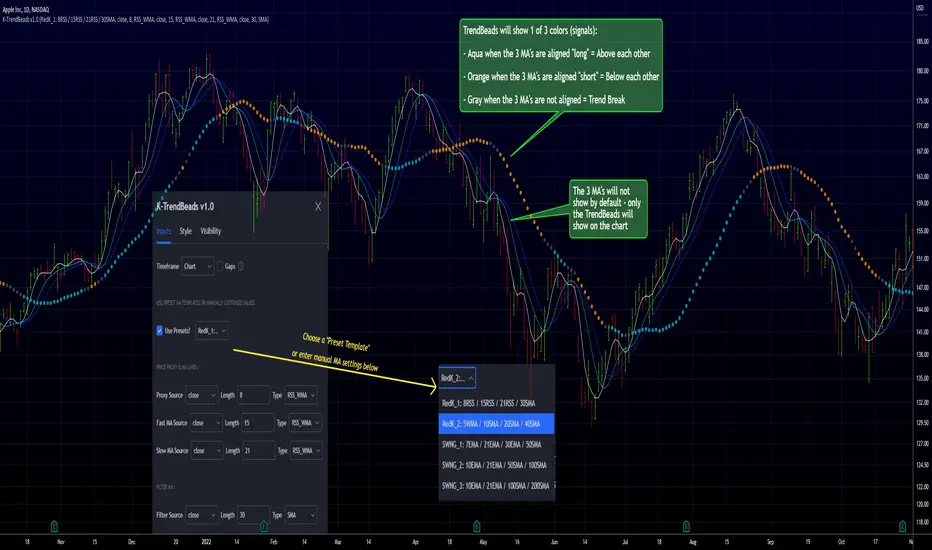
RedK TrendBeads: 3 x MA Crossover Signal with Preset TemplatesRedK TrendBeads is a super simple 3 x Moving Average Crossover Signal (Long/Short/Break) script that provides a simple and effective way for traders to identify potential trading opportunities. By combining three moving averages and only exposing a simple signal, the script helps filter out noise and focus on the trend and the trade execution.
Background
===========
A 3 x Moving Average Crossover strategy is a popular trading method in technical analysis . It uses the relationship between a fast, medium, and slow moving averages to generate buy or sell signals.
The approach usually utilizes three moving averages to track the average price of a financial instrument over different time periods. By comparing the fast, medium, and slow moving averages, we can generates a signal to trade long or short
If the fast moving average crosses above the medium moving average and the medium moving average is above the slow moving average, we have a probability of an up-trend forming, and we generate a signal to go long. Conversely, if the fast moving average crosses below the medium moving average and the medium moving average is below the slow moving average, we have a probability of a down-trend forming, and we generate a signal to go short. When the moving averages are not in the right order (above or below each other), we have a trend break, usually on consolidation or base forming.
in TrendBeads, the fastest MA is called "Price Proxy MA" and will be used with a relatively short length to represent the price itself - then there are the Fast MA, Slow MA and a Filter MA (usually with the longest/slowest length) which is the main line that will be used to plot the TrendBeads - So the TrendBeads will represent the state of the other 3 Moving Average lines (Proxy, Fast and Slow) and how they are aligned - and it will also be common to use the Filter / Beads line itself as a main filter, i.e., take long positions *only* when the price action is above the Filter MA, and short positions *only* when the price is below the Filter MA.
So what is different with TrendBeads:
=====================================
Simplicity, No Clutter: I put this together to provide a super simple mechanism to track trend on the price chart without so much noise as i also wanted to have other top-chart indicators (like LadderTrader) - so TrendBeads only shows the "beads" on the chart - they act like "traffic lights" with little distracting information - Simplicity here was deliberately part if the idea
Presets, What others are Watching: The other feature I needed was the ability to track price action against "different sets" of Moving Averages quickly - for example, when executing short-term trades, I needed to use Moving Averages with shorter length and want to utilize my RSS_WMA MA type - but when assessing big breakout opportunities, I need to analyze price action against a different set of MA's with (usually) longer length and mainly SMA's (hint, The Minervini template) - This is where the built-in Preset Templates become very useful.
Having these preset templates quickly available (thru the dropdown in indicator settings) provides time saving, convenience and the confidence that we're looking at what other traders are using in their analysis - so not missing out on key-level breakouts or reversals
TrendBeads v1.0 includes the following 5 preset MA templates
======================================================
Preset 1 : RedK_1: 8RSS / 15RSS / 21RSS / 30SMA
Preset 2 : RedK_2: 5WMA / 10SMA / 20SMA / 40SMA
Preset 3 : SWNG_1: 7EMA / 21EMA / 30EMA / 50SMA
Preset 4 : SWNG_2: 10EMA / 21EMA / 50SMA / 100SMA
Preset 5 : SWNG_3: 10EMA / 21EMA / 100SMA / 200SMA
The above presets represent some of the most common sets of MA's traders use in various scenarios (Short-term/day trading, Swing, Long term / growth). Well, except for the first one since it utilizes my own RSS_WMA :) which I use in many charts
I may add some more presets in future.
below chart shows an example of different presets against AAPL for the same time range / window
There's also the ability to manually set different MA source price, MA type and length for each of the 4 MA lines. Supported MA types are SMA , EMA , WMA , HMA and my RSS_WMA
TrendBeads Usage Tips:
=====================
*If you have used any MA crossover (2 lines or 3 lines) on your chart, your should find TradeBeads very easy to use. TrendBeads works the same way except that the signal will show as colored beads on the Filter MA line instead of showing multiple crossing lines .. and that is by design.
* Feel free to expose any or all of the individual MA lines - for example, i find that exposing the Proxy Line helps in quickly finding famous chart patterns ( cup & handle , H&S ..etc)
* Experiment with the different presets depending on the type of trade you're working on (swing, long term growth candidates, day trades..etc)
* Note that in a long trend up (Aqua Beads), usually the first gray + orange sequence will usually act as a "reversal sign" - and are usually not actionable - always look for the "second" color sequence to action/trade .. Same thing for a long trend down -- get used to how the beads change color against the trend changes and play with various timeframes.
* As usual - we should have other indicators that track strength, volume , etc and ensure proper confirmation before trade execution - A good signal is only a small part of a trade - risk management and good trade execution are key to winning.
Hope some fellow traders will find this useful - feel free to leave me any comments or feedback - Good luck!